
TECHNICAL ANALYSIS (by Intraday Dynamics)
Major Indices Week of January 3, 2025
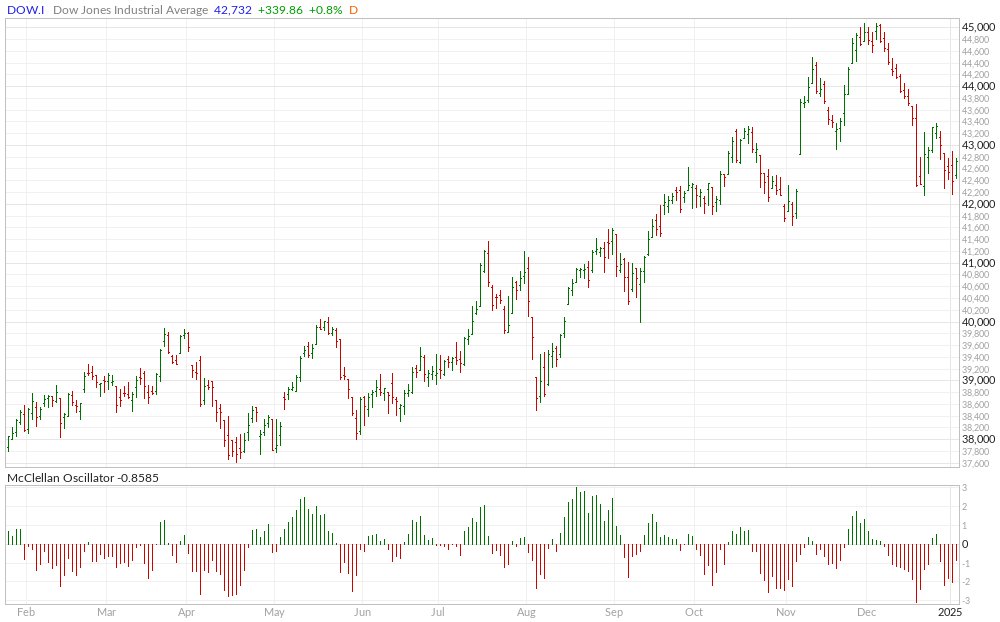
 Dow Jones Industrial Average Weekly Candles
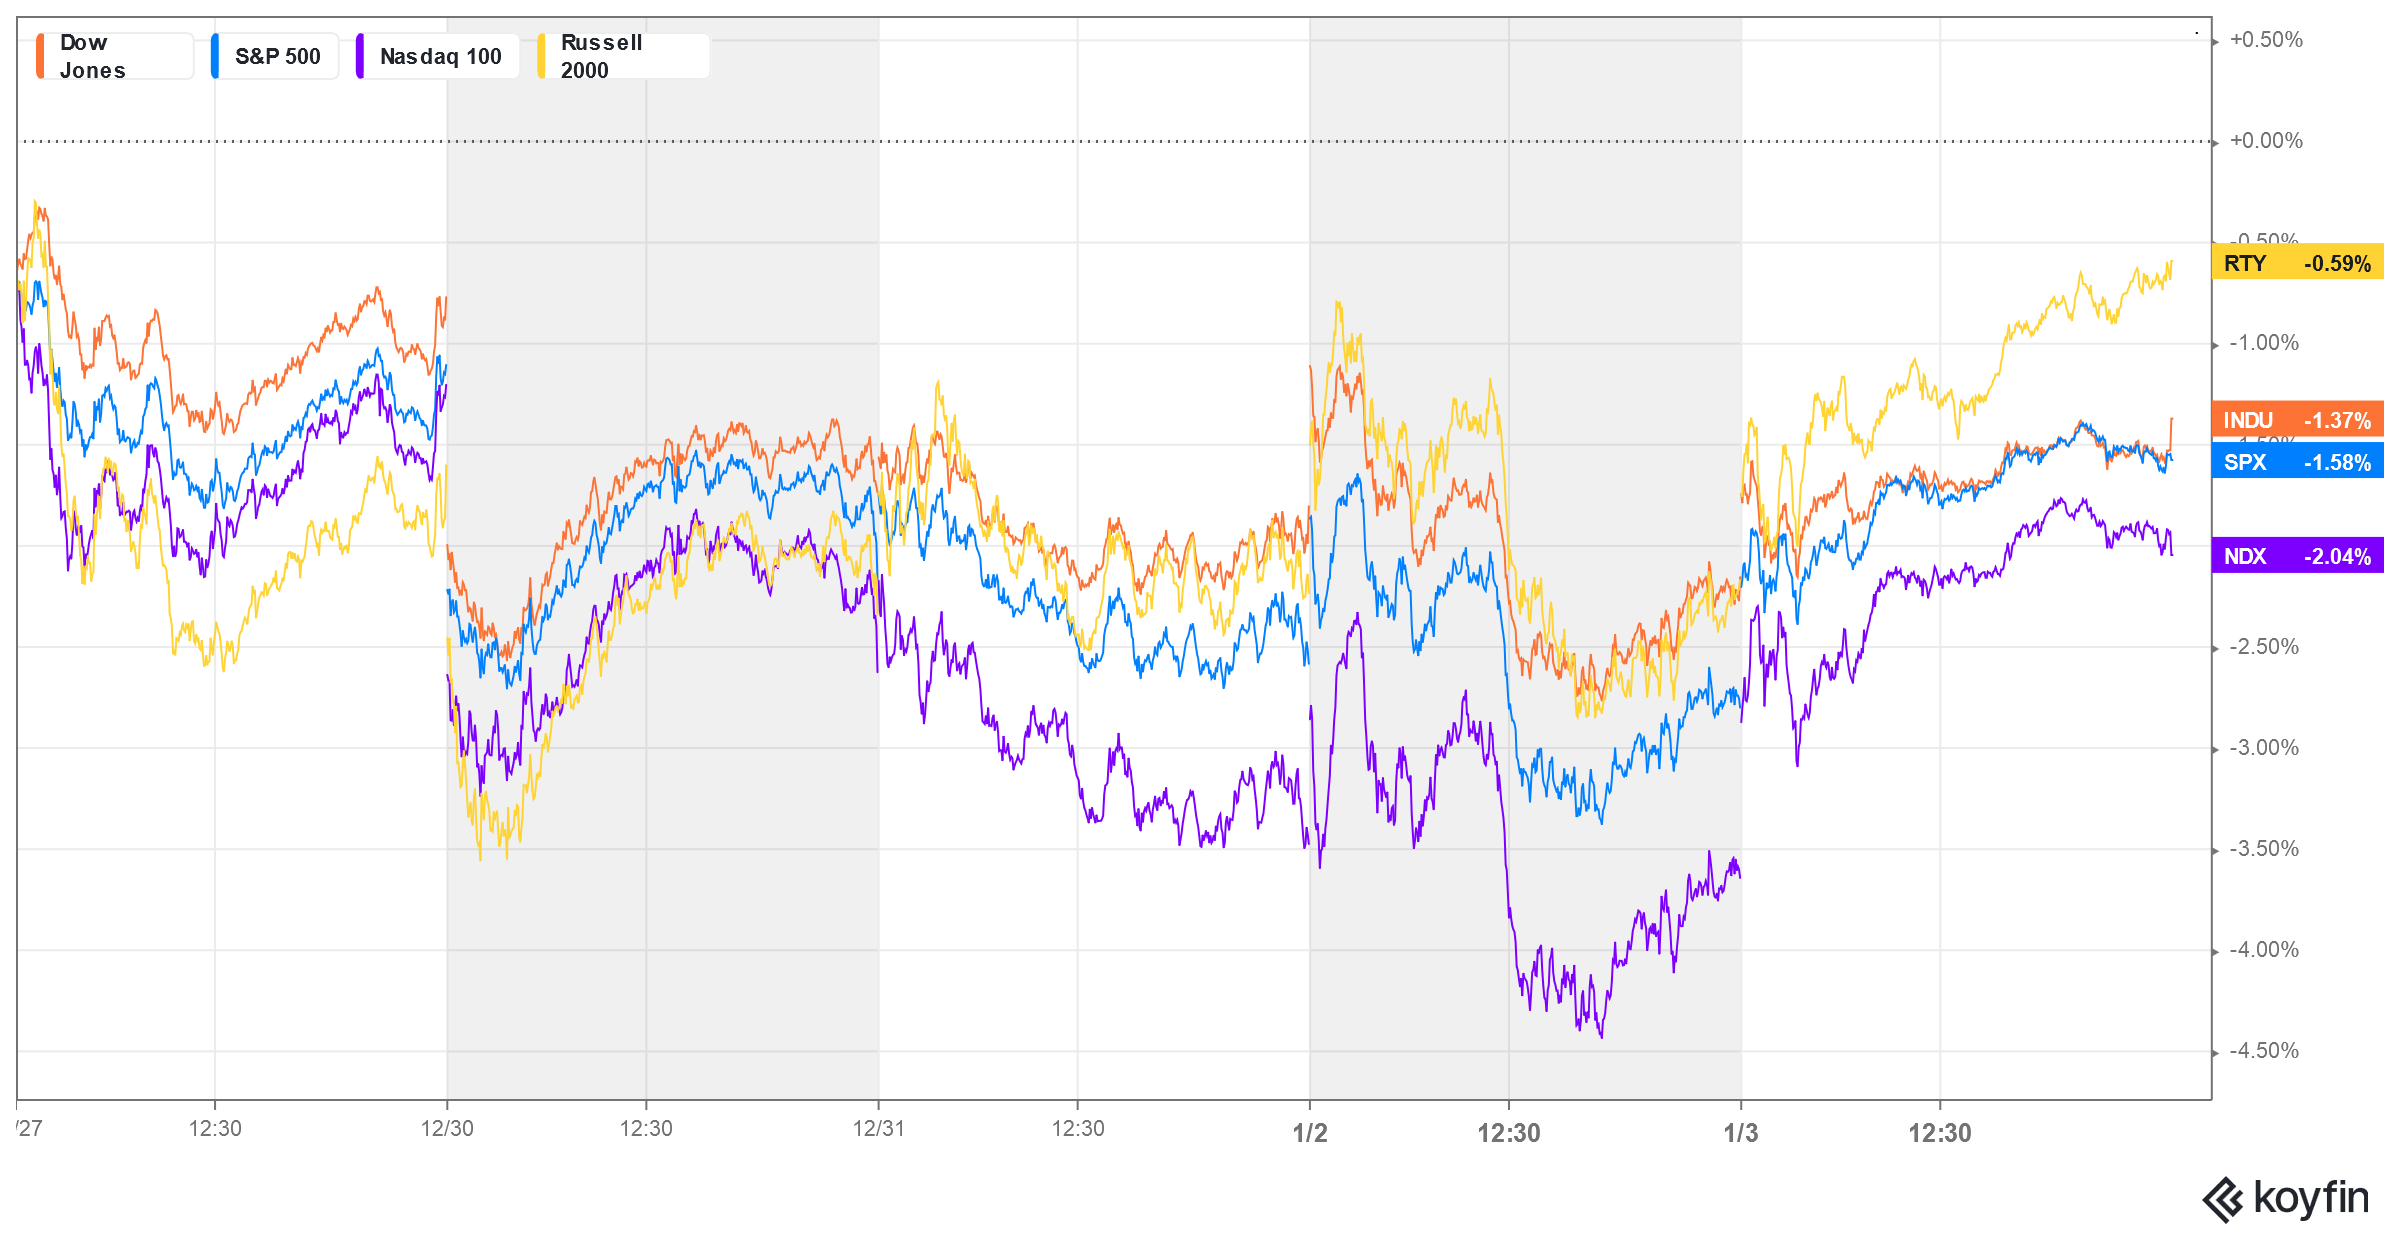
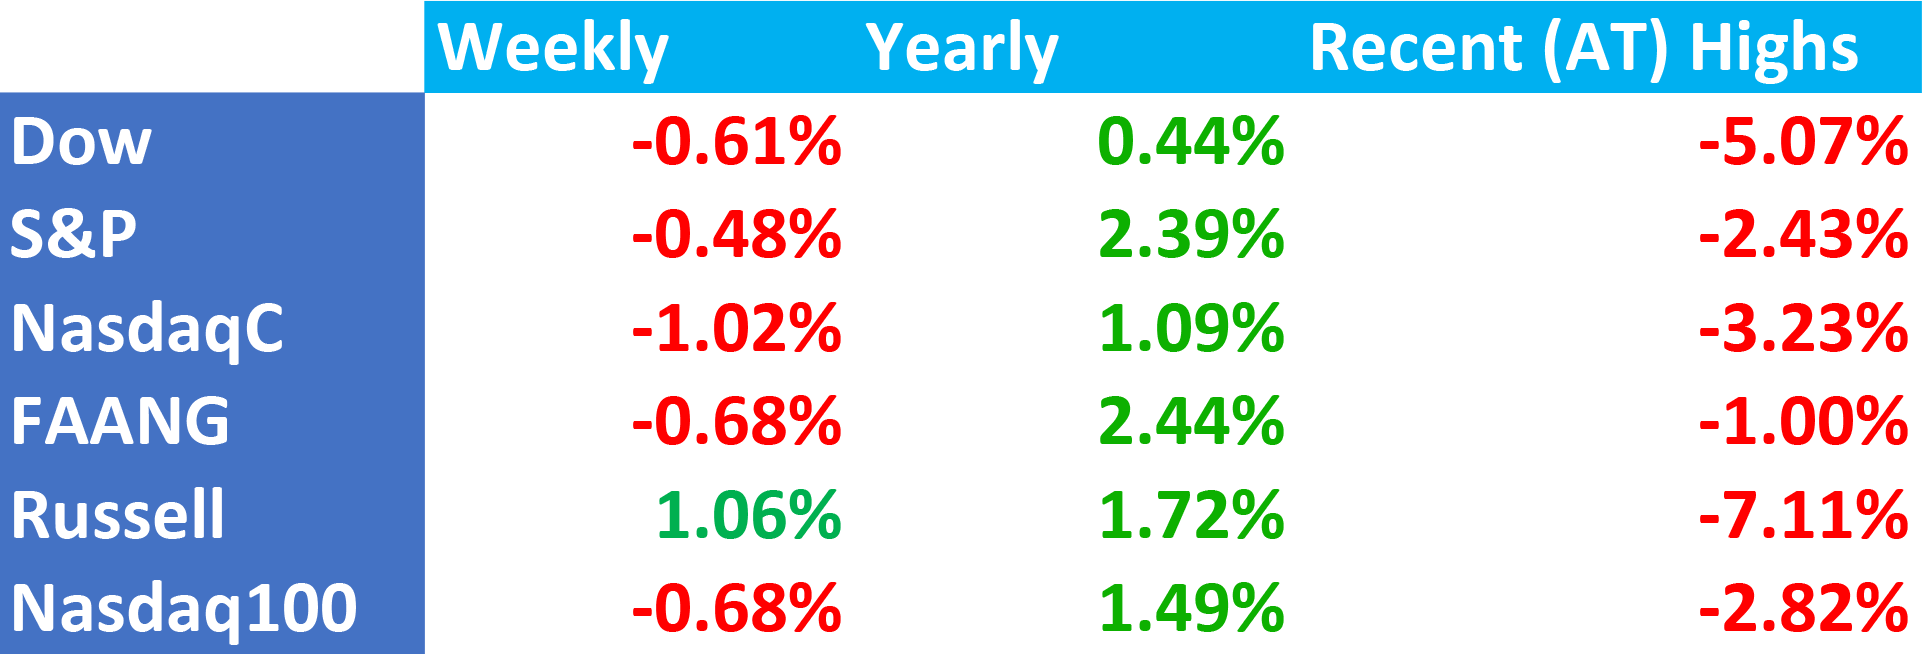
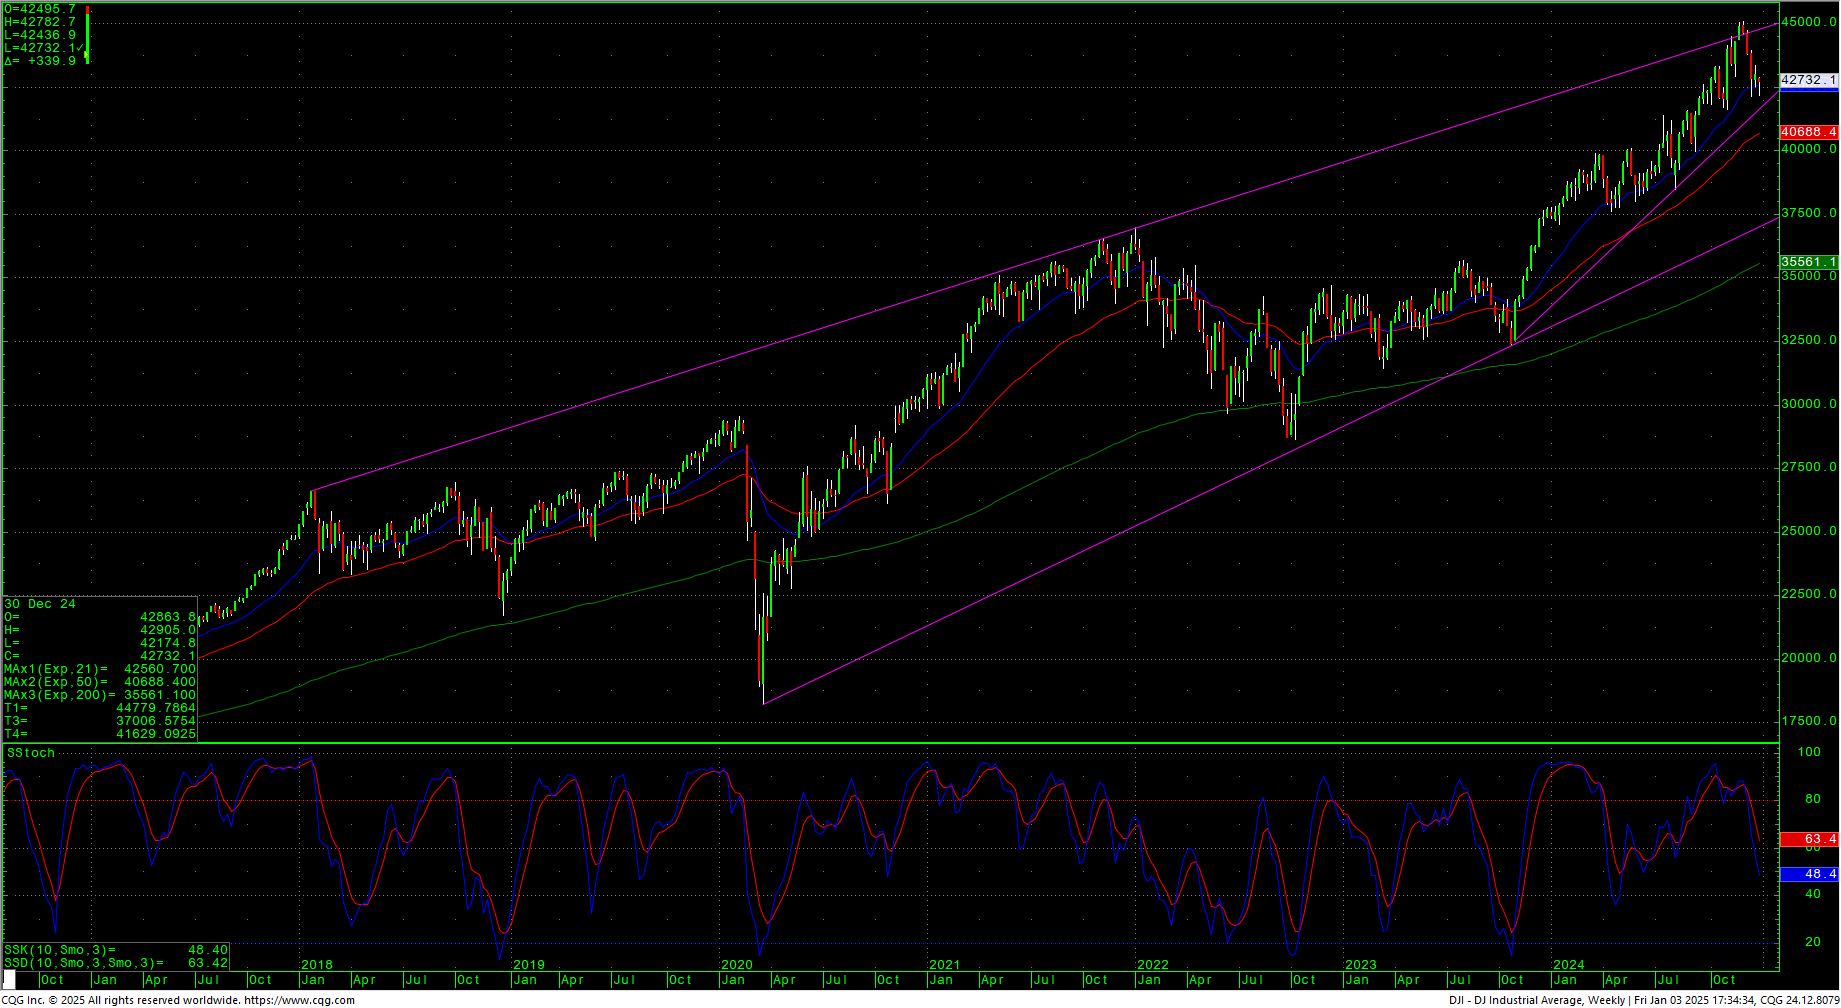 Stocks ended the week mostly lower in choppy trade. Year-end balancing had prices on the defensive, but Friday the secondaries and the tech stocks roared back to life from testing the recent swing lows. The daily charts are schizophrenic on the stochastics and intermediate-term commentary remains the same, at least for the Dow.
NYSE Volume Daily
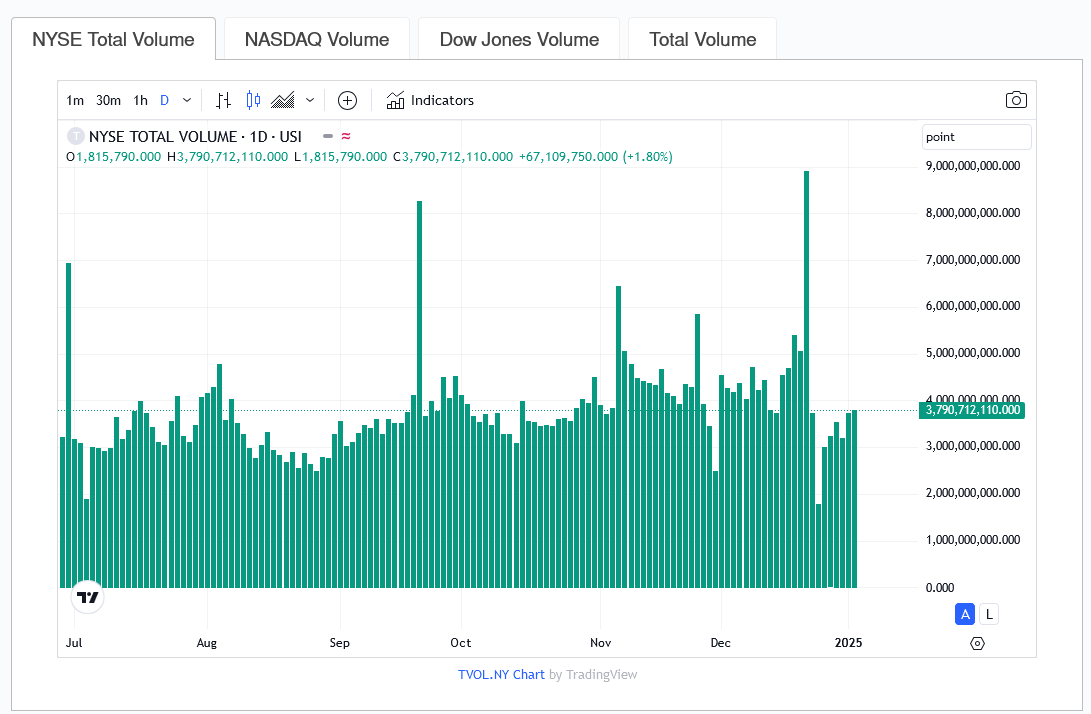 “The Dow now has two very distinct technical signals that require attention. The first is what appears to be an impulse wave from 18 December 2024, and a possible indication of a trend change. But then we have the high volume reversal just two days later on 20 December 2024, where the daily volume eclipsed the previous triple-witching volume of 20 September 2024. In that session on the 20th, the Dow came just a few ticks short of a target at 42123 and filled the large gap left on 6 November 2024. Since that reversal, the Dow has been building a choppy flag and time will tell which one of these key events will play out intermediate term.”
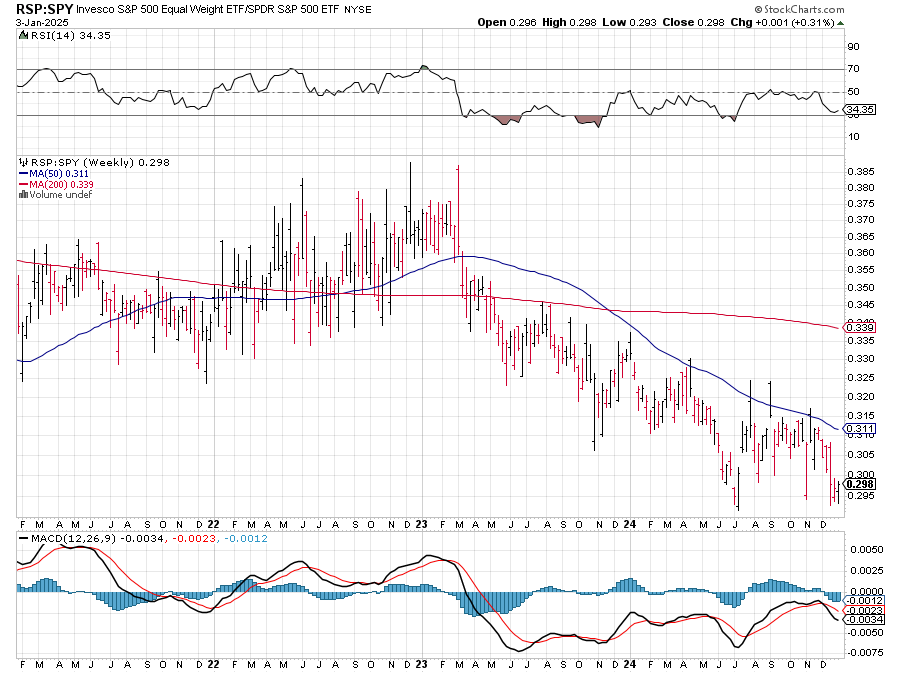
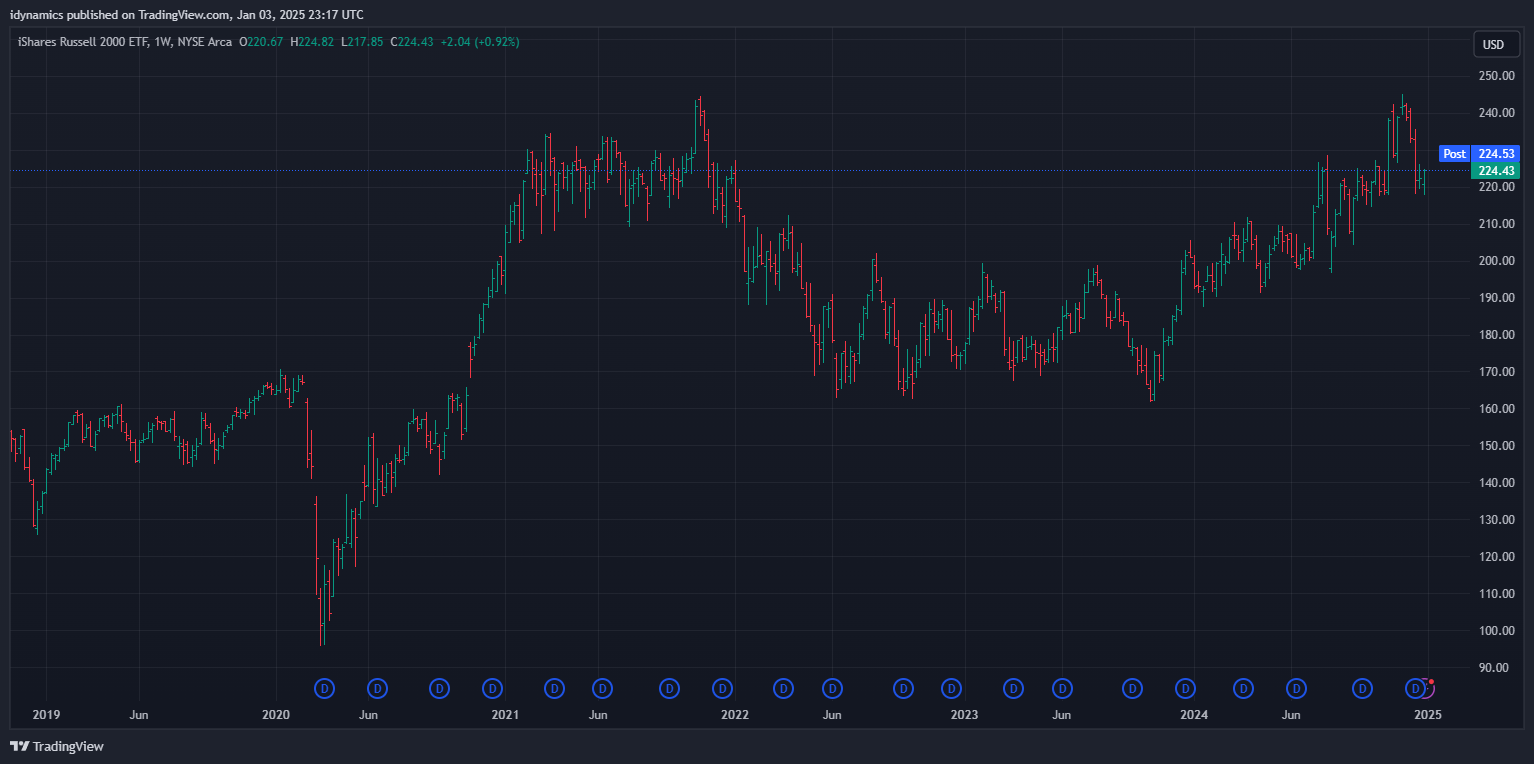
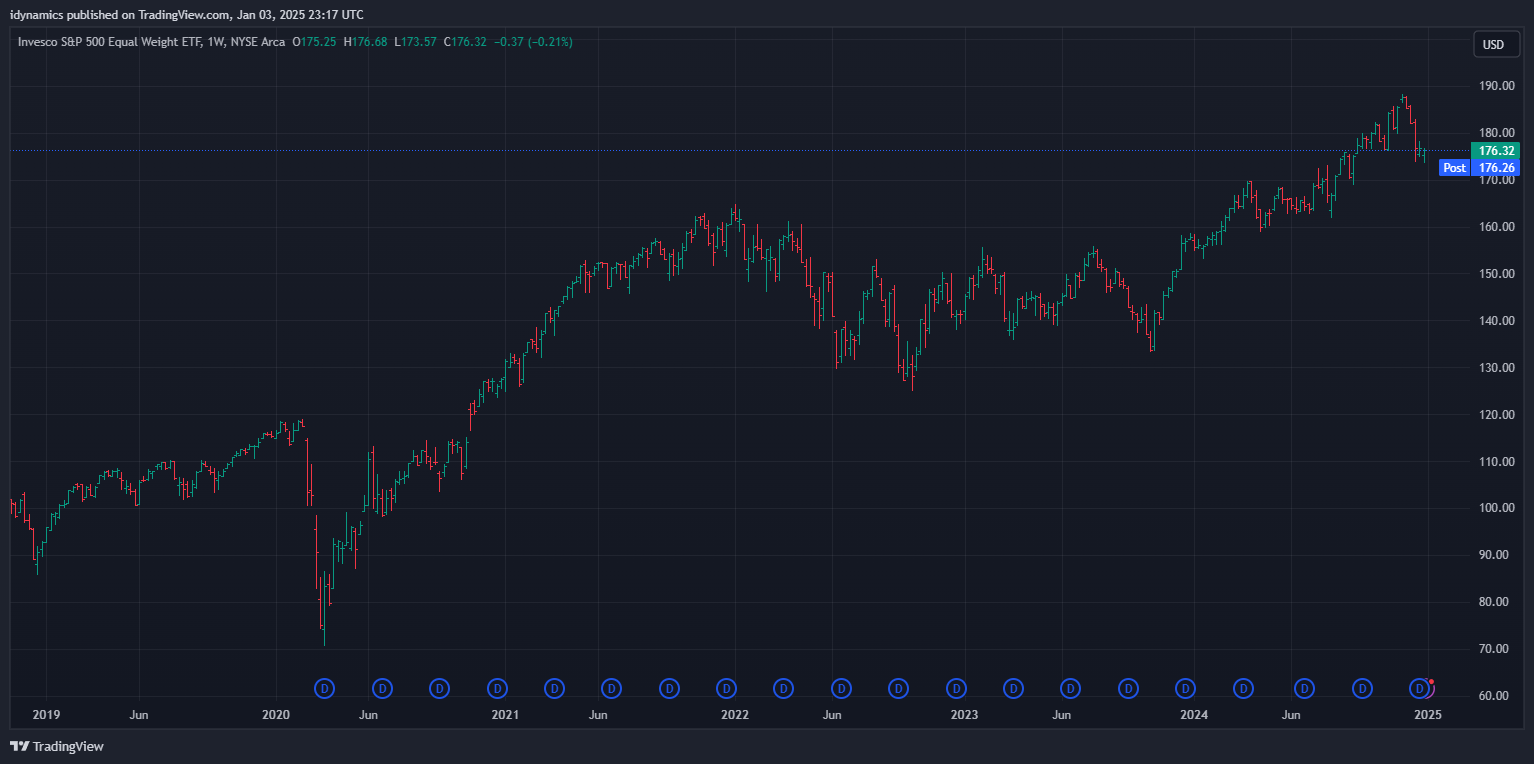
All the indexes closed lower with the exception of the secondary markets. The RSP:SPY had a positive week as a result as it sites at multiyear lows. Sentiment remains in extreme fear in some indicators with breadth remaining weak. The IWM/RSP had reversal weeks. Note that U.S. Employment will be out this Friday, 10 January 2025 and Thursday will ne a national day of mourning for form President Carter.
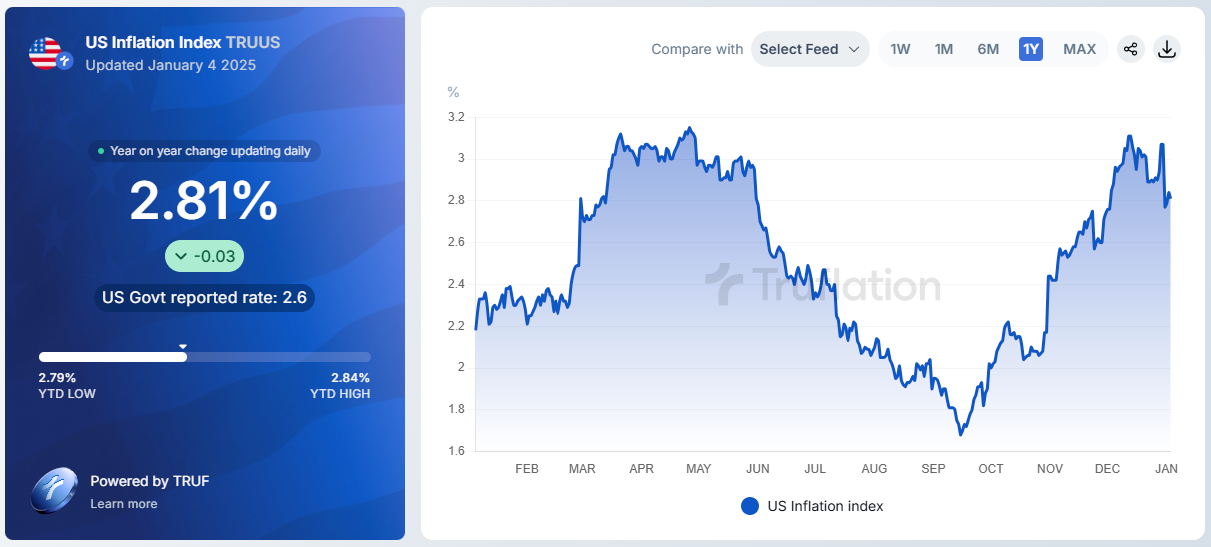
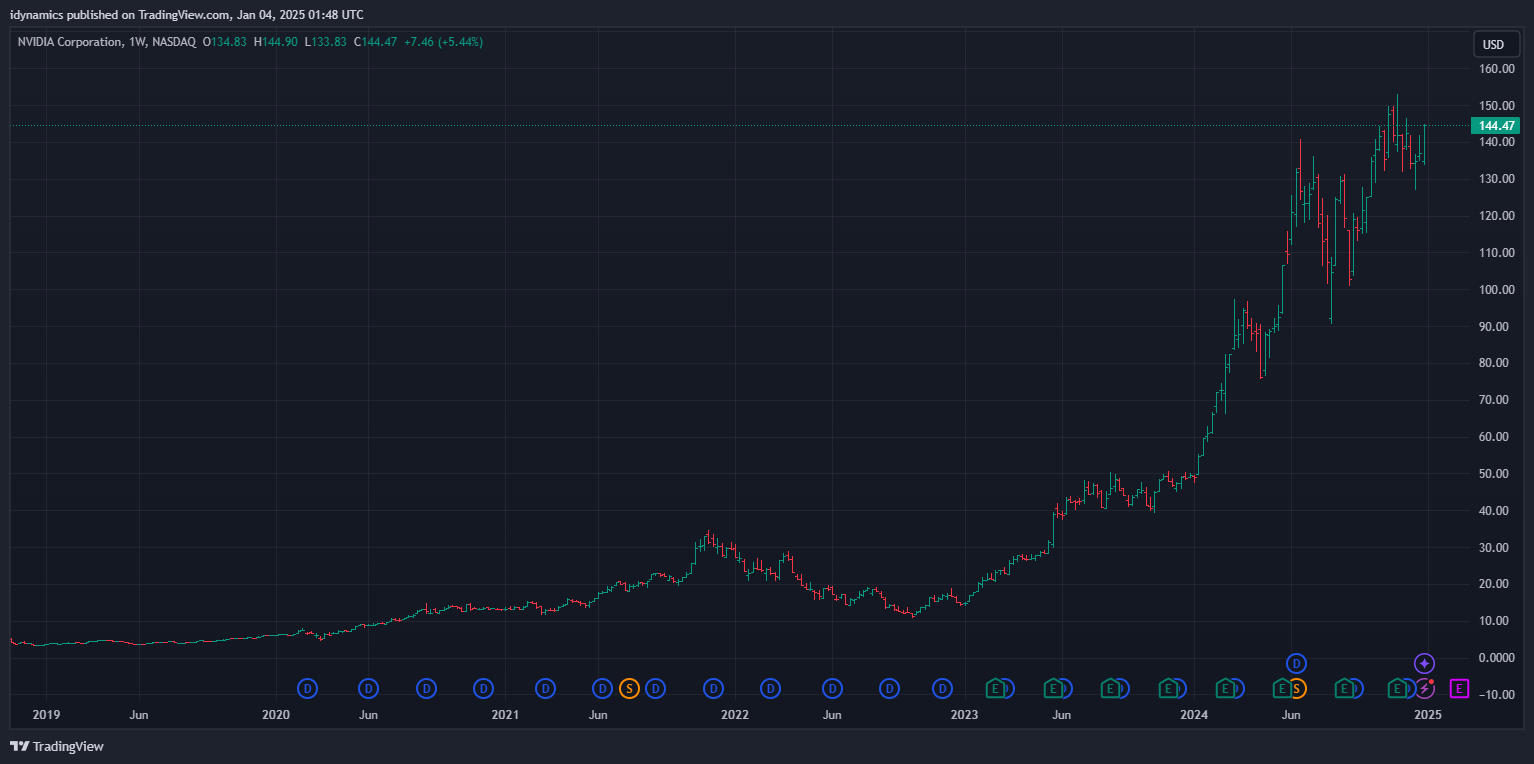
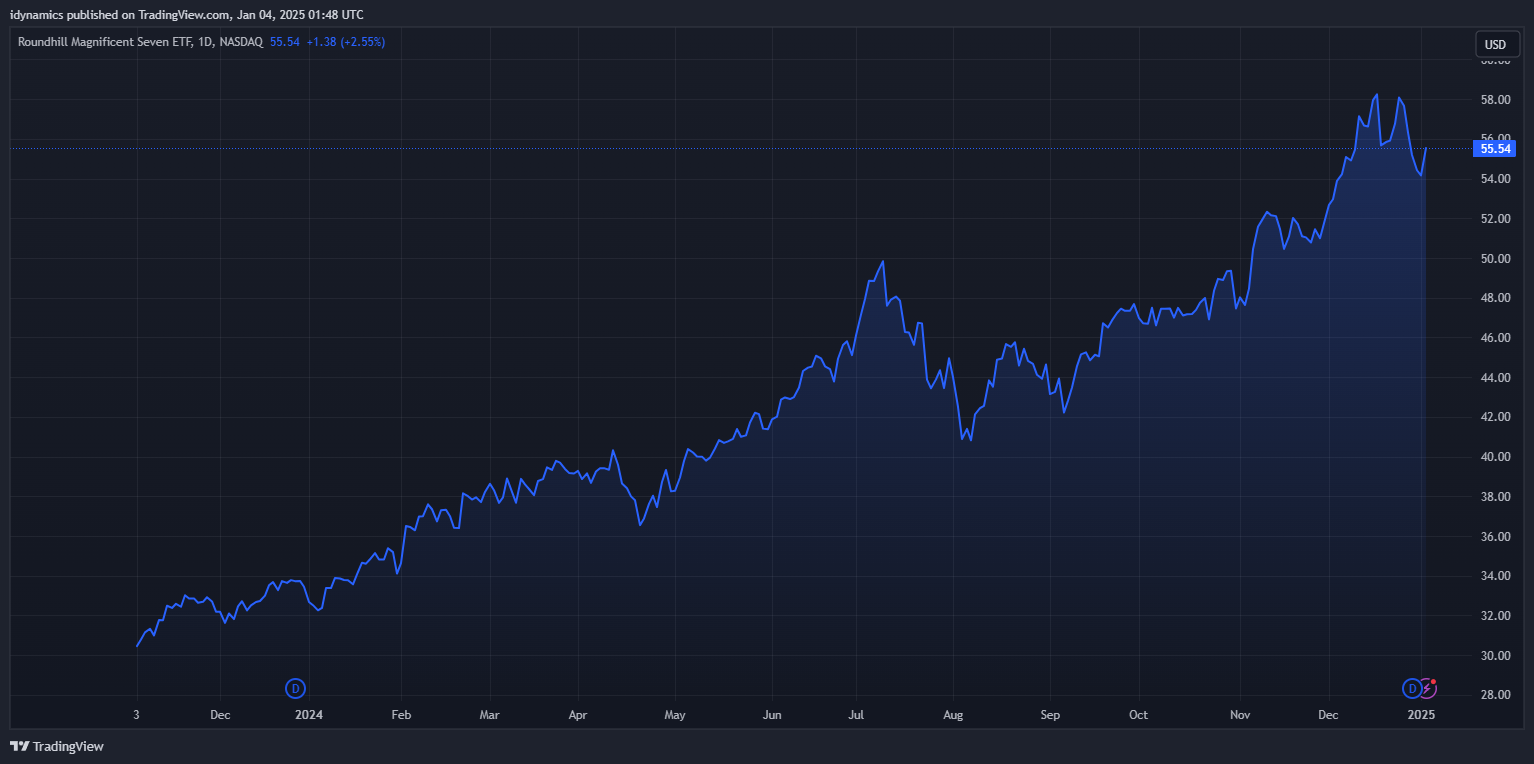
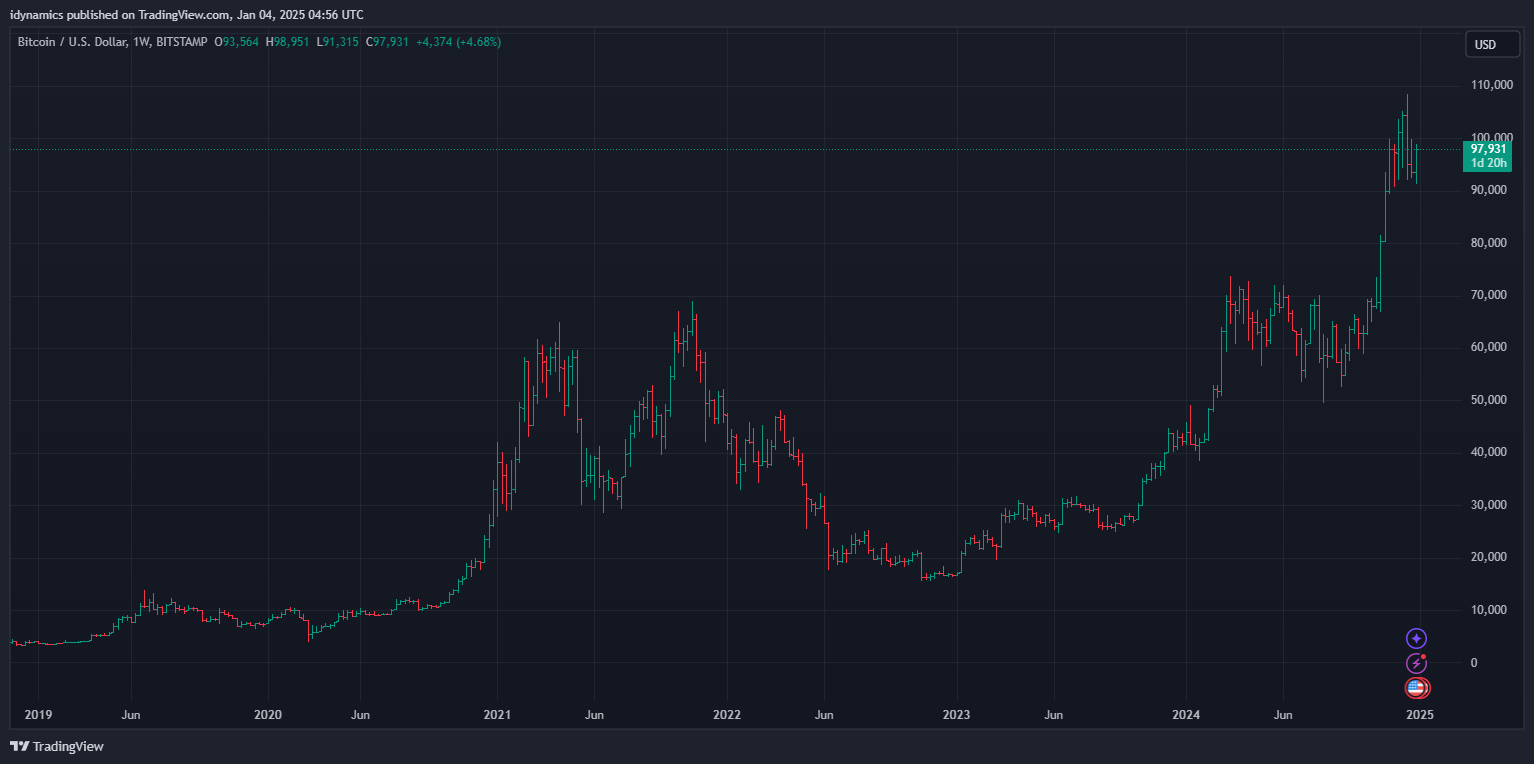
NVDA roared to life on Friday and it now potentially voiding the H&S top pattern. The neckline remains at 126.86 and closes under this area would signal targets in the -100 area (the summer lows. The MAG7 also rallied sharply after prices hit a four week low. Bitcoin joined in the rally after hitting a critical level of support in the 92000/91000 level. A breakdown under 91000 with closes will setup the 74000 level. McClellan Oscillators confirm the recent weakness in the Dow and the A/D line is hitting over a one-year low. The Yield Curve set the highest weekly close since turning positive, ending the week at +0.319% while the 10YR remains above 4.6%. Truflation has dipped back to 2.81%.
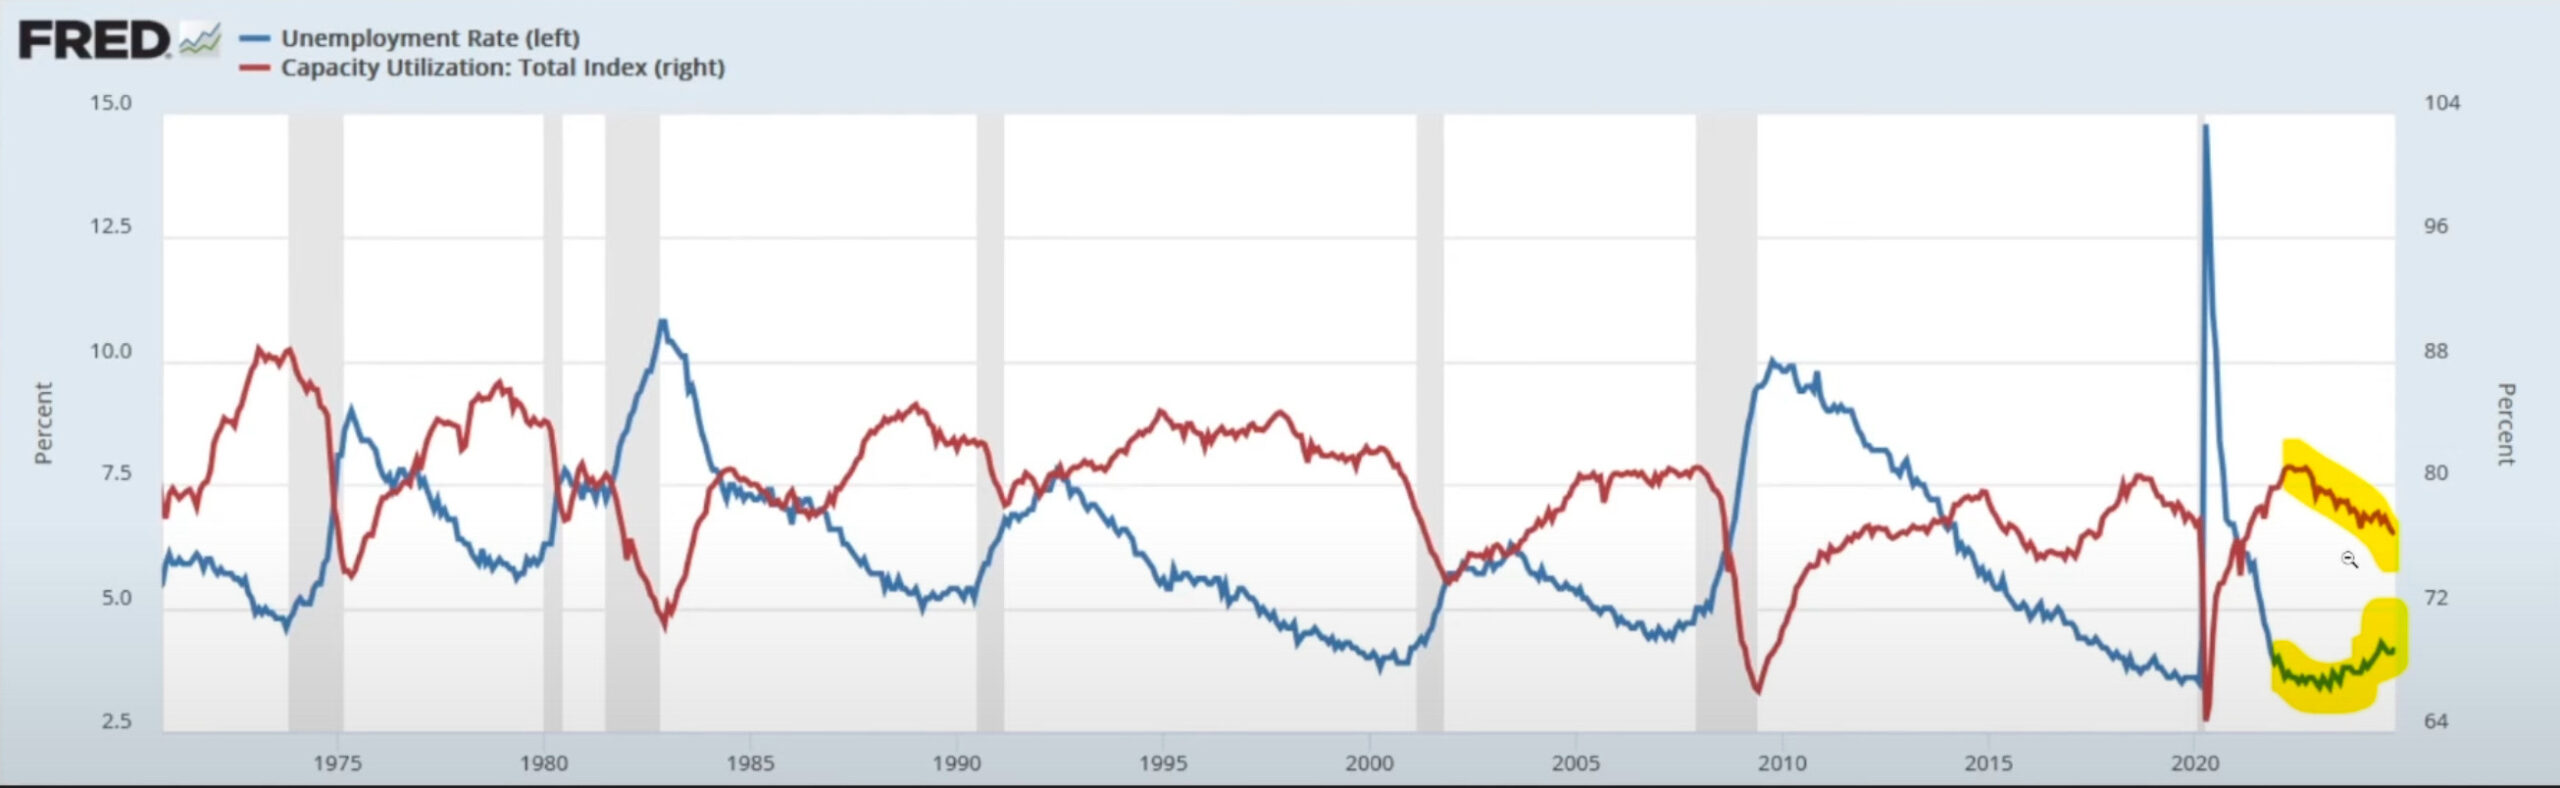
“The narrative on the longest recorded inversion in the yield curve is convoluted as a recession indicator. The recessions do not occur “during” the inversion, they typically start within around six months from when the curve turns positive once again. This past year, the yield curve turned positive 6 September 2024.” Another chart to watch as we have Employment data this week is its relationship to Capacity Utilization and the cycle of recessions as these two trends move toward each other.
 10YR-2YR Yield Curve Daily

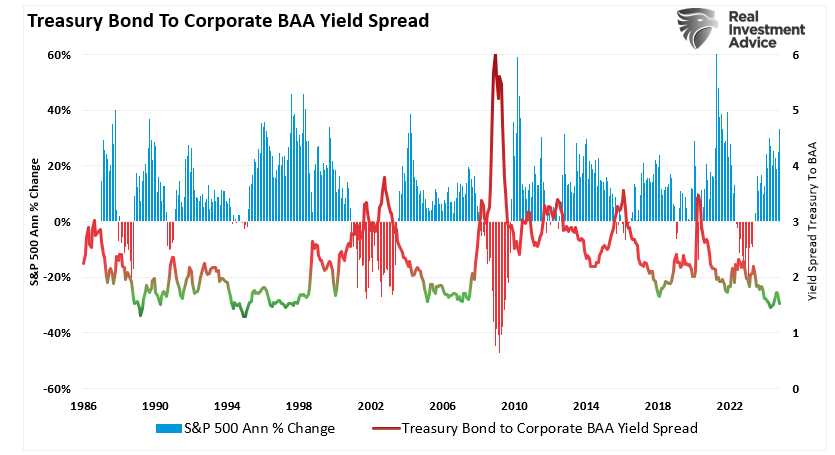
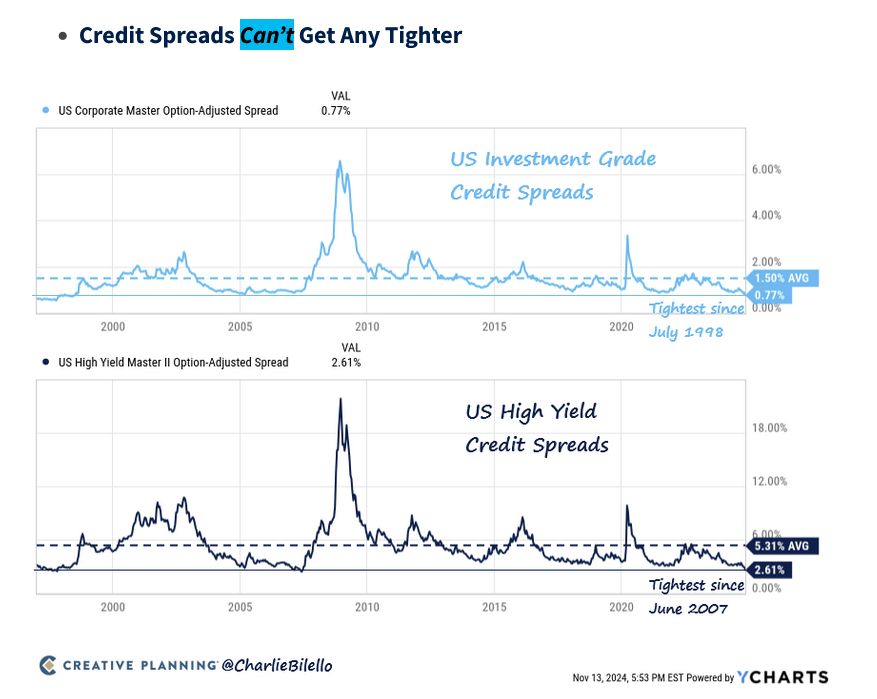
 Buffet still sitting on the largest cash holdings in history while credit spreads test record lows. The spreads say extreme greed while sentiment leans toward fear. Who wins?
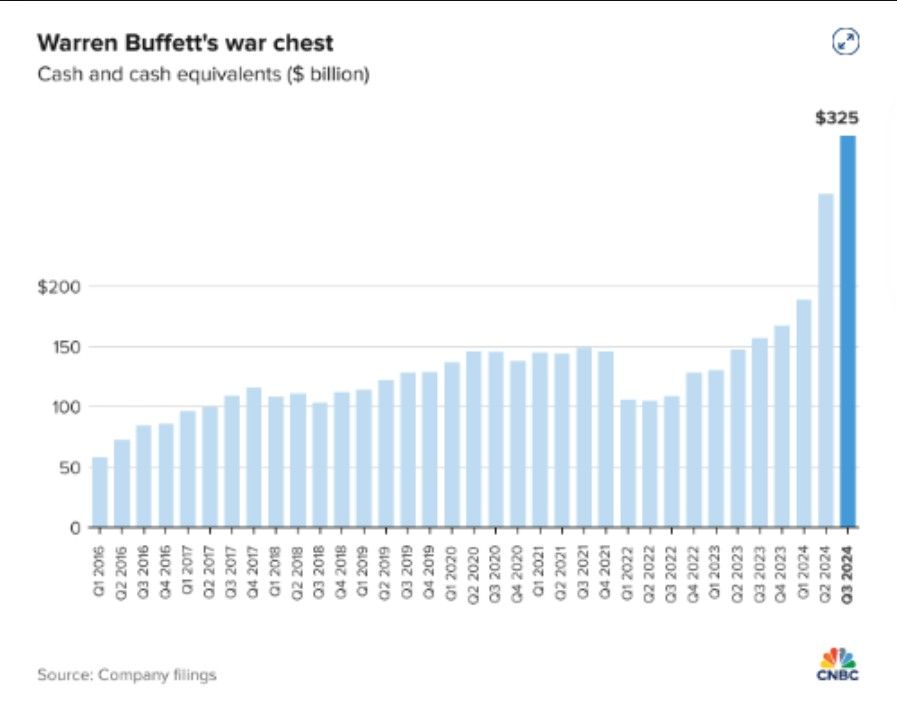
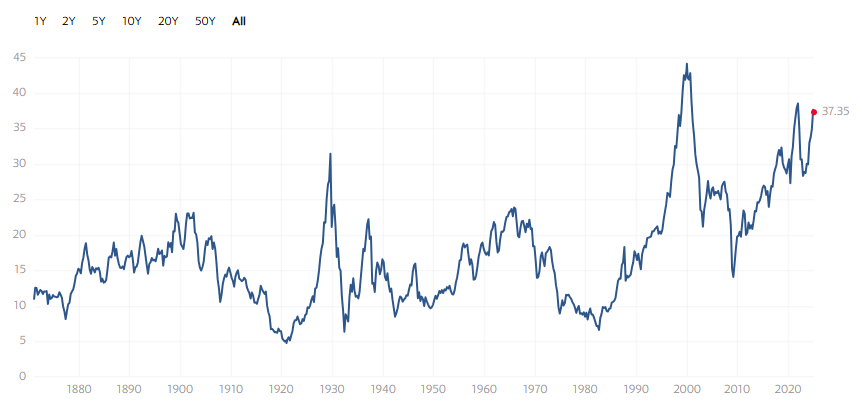
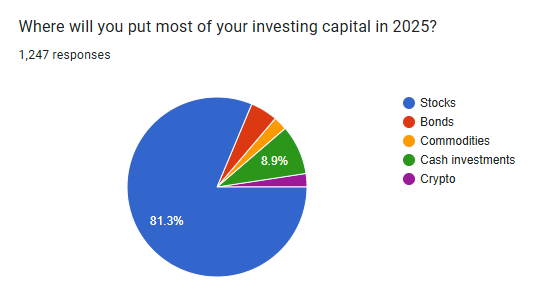
 The Schiller PE Ratio remains near record levels and Asset Managers remain fully committed to stocks in 2025.
VIX Weekly H-L-C

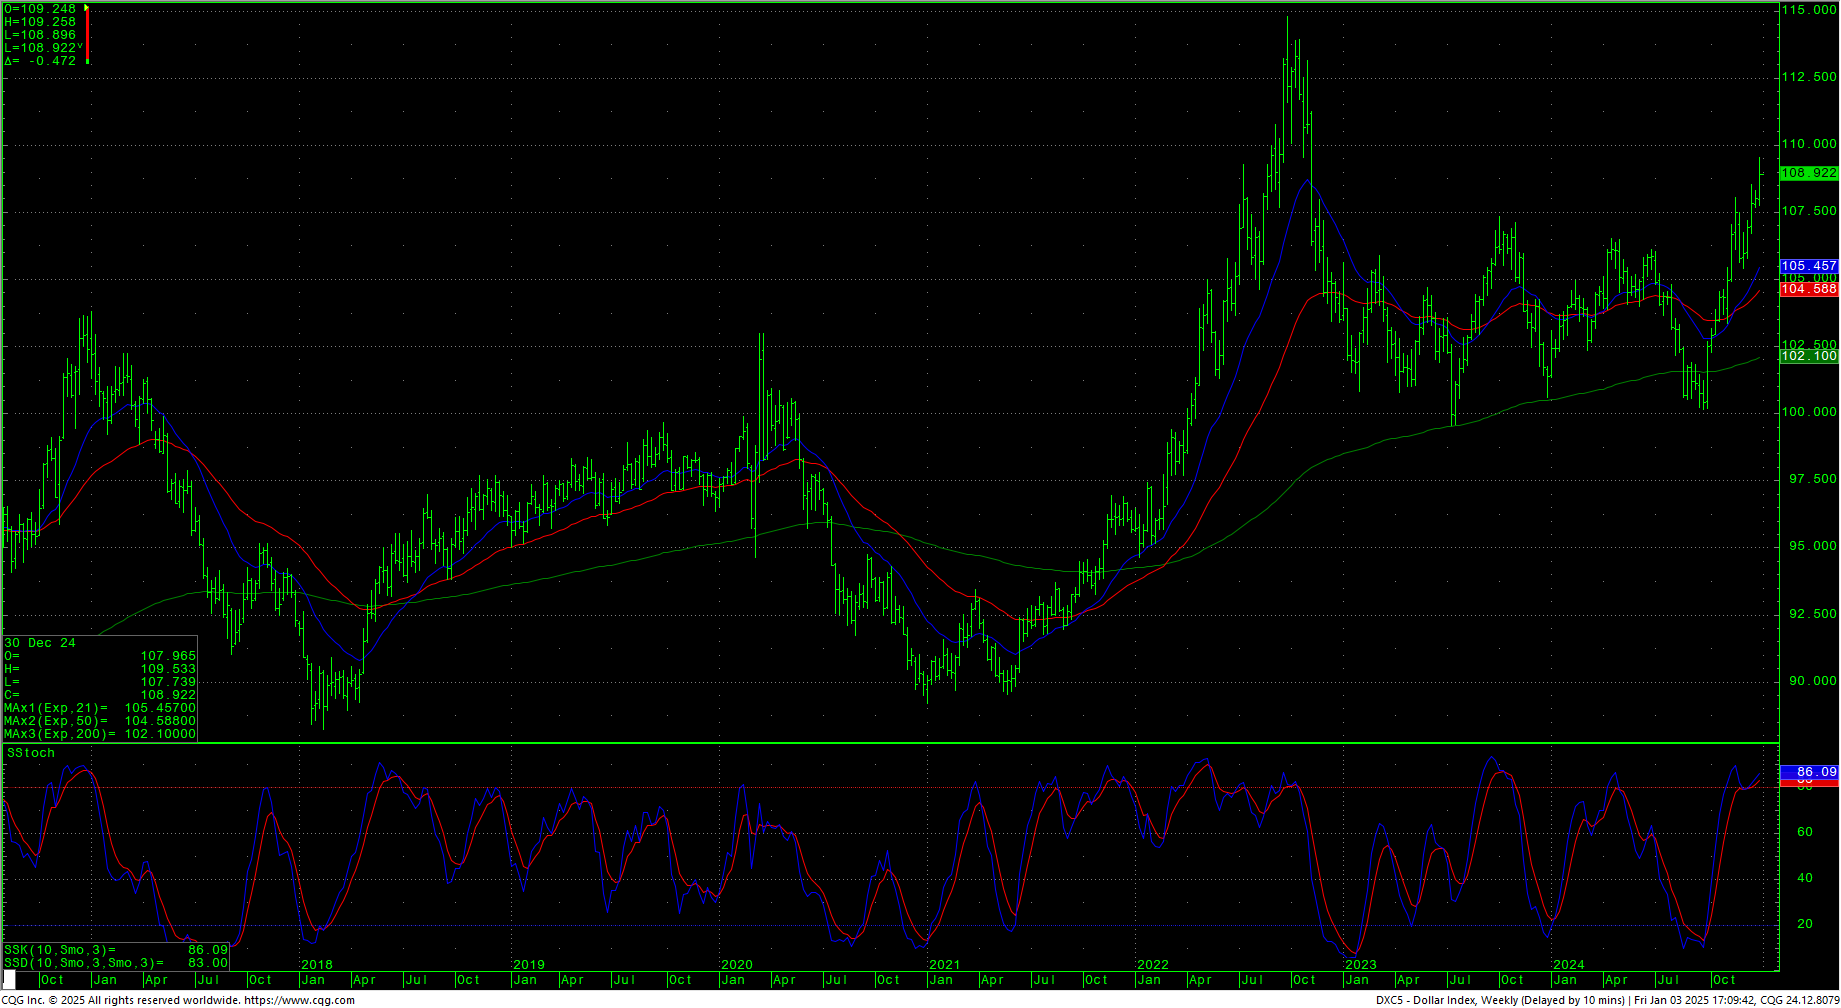
The VIX ended the week basically unchanged, on the bottom of the weekly range. The US Dollar soared to the highest levels since November 2022.
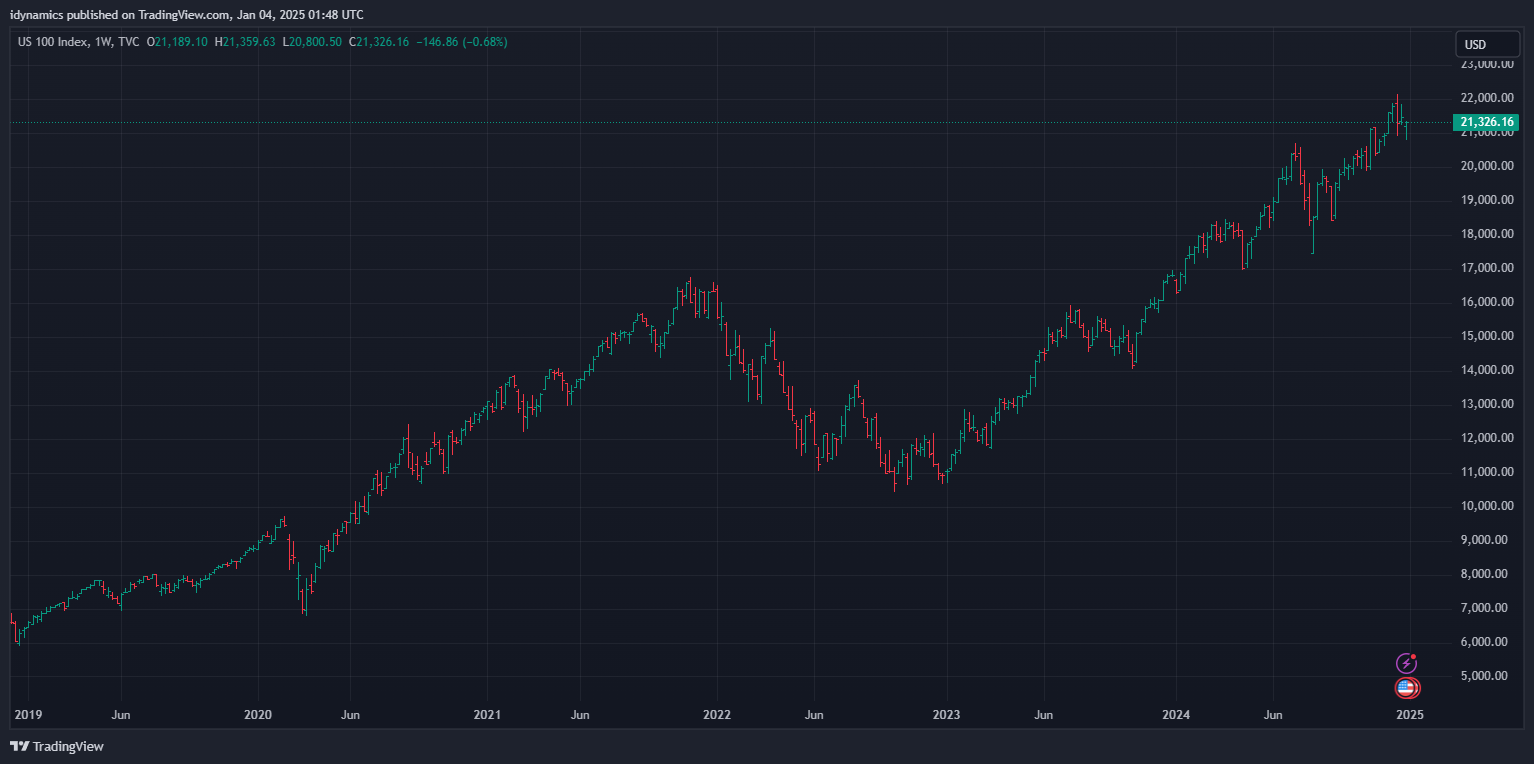
 Nasdaq 100 Weekly H-L-C
 52-Week A/D Line
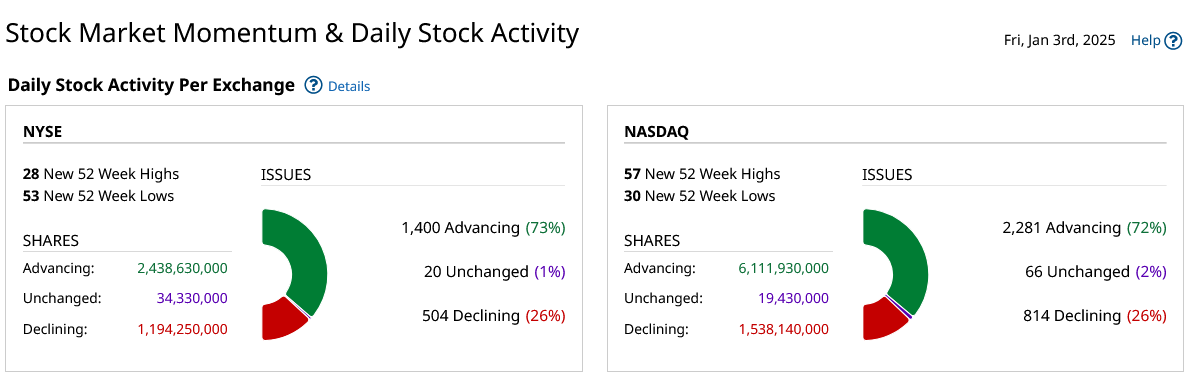
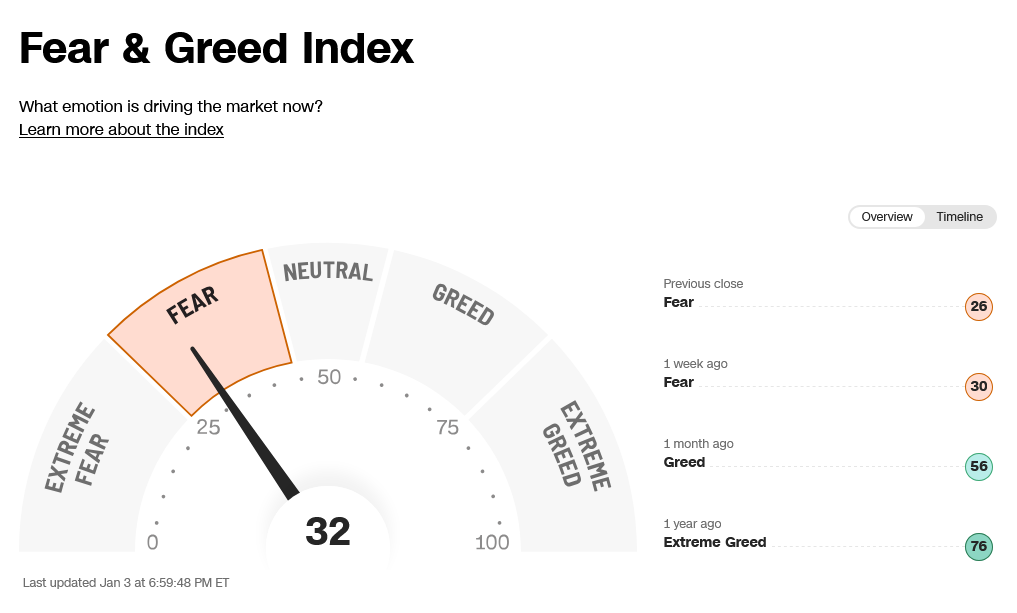
Breadth recovered but reflects the fear in sentiment, showing extreme fear.
CNN Fear & Greed Index
 AAII Investor Sentiment Survey


