
TECHNICAL ANALYSIS (by Intraday Dynamics)
Major Indices Week of January 5, 2024
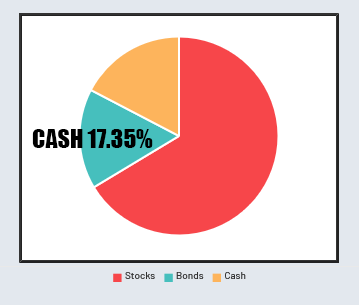
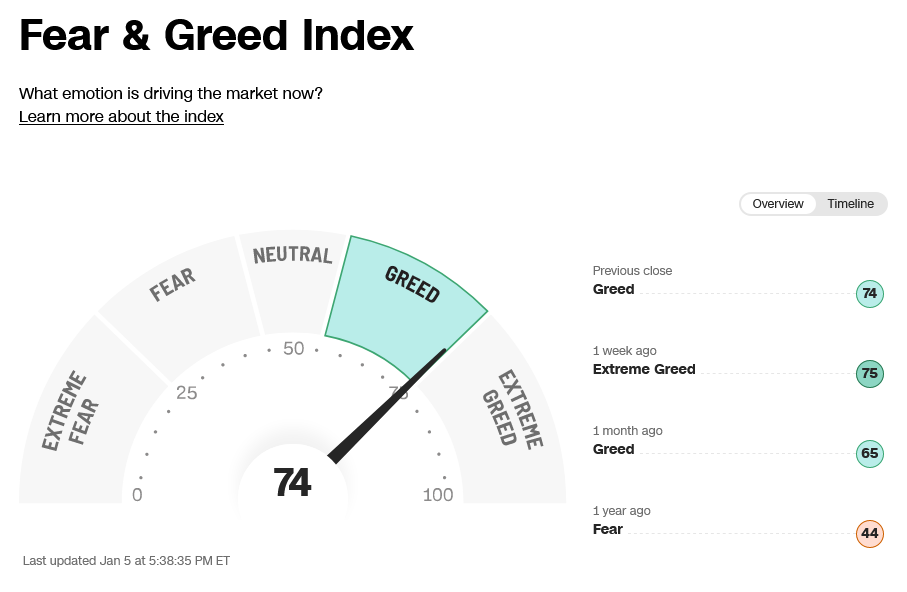
 Stocks started the week lower for most major indices and saw selling throughout the week, to start off 2024 the opposite of how it closed out last year. The action tempered some of the extreme greed on sentiment and left short-term charts oversold on Friday’s close, while the daily charts work off severely overbought conditions and the weeklies creep into overbought territory. The market ended its historic 9-week up streak and the action most likely signals the end of the first leg of this impulse wave. (Price and time now dictate any further correction.) Timing-wise, a number of indices set closing lows in Thursday’s minor timing and we begin the week with some critical timing…see notes below. According to the AAII Asset Allocation Survey, players ended the year with only 17.35% cash on the sidelines. Secondary markets took a big hit along with tech stocks, although the RSP/SPY eked out a slightly higher close on the weekly chart but settled on the bottom of the range.
AAII Asset Allocation Survey
RSP/SPY Weekly 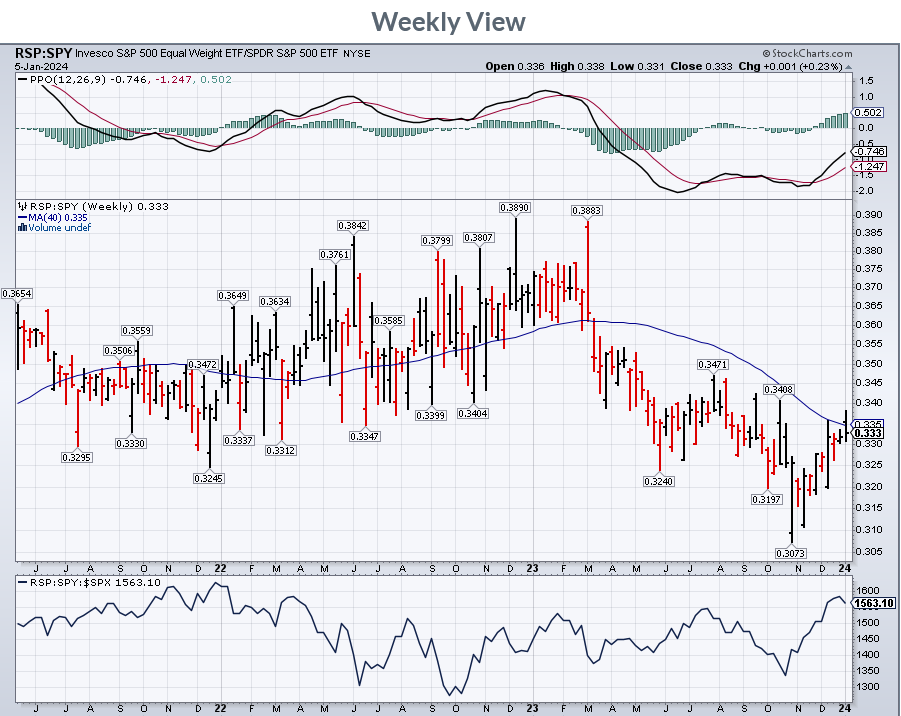 52-Week A/D Line
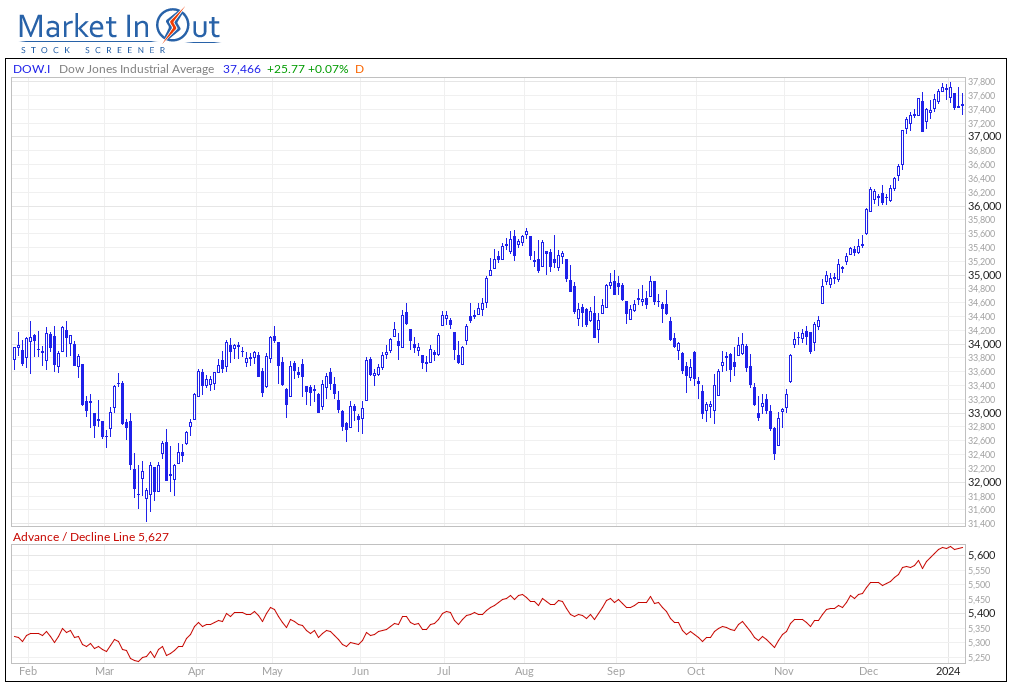
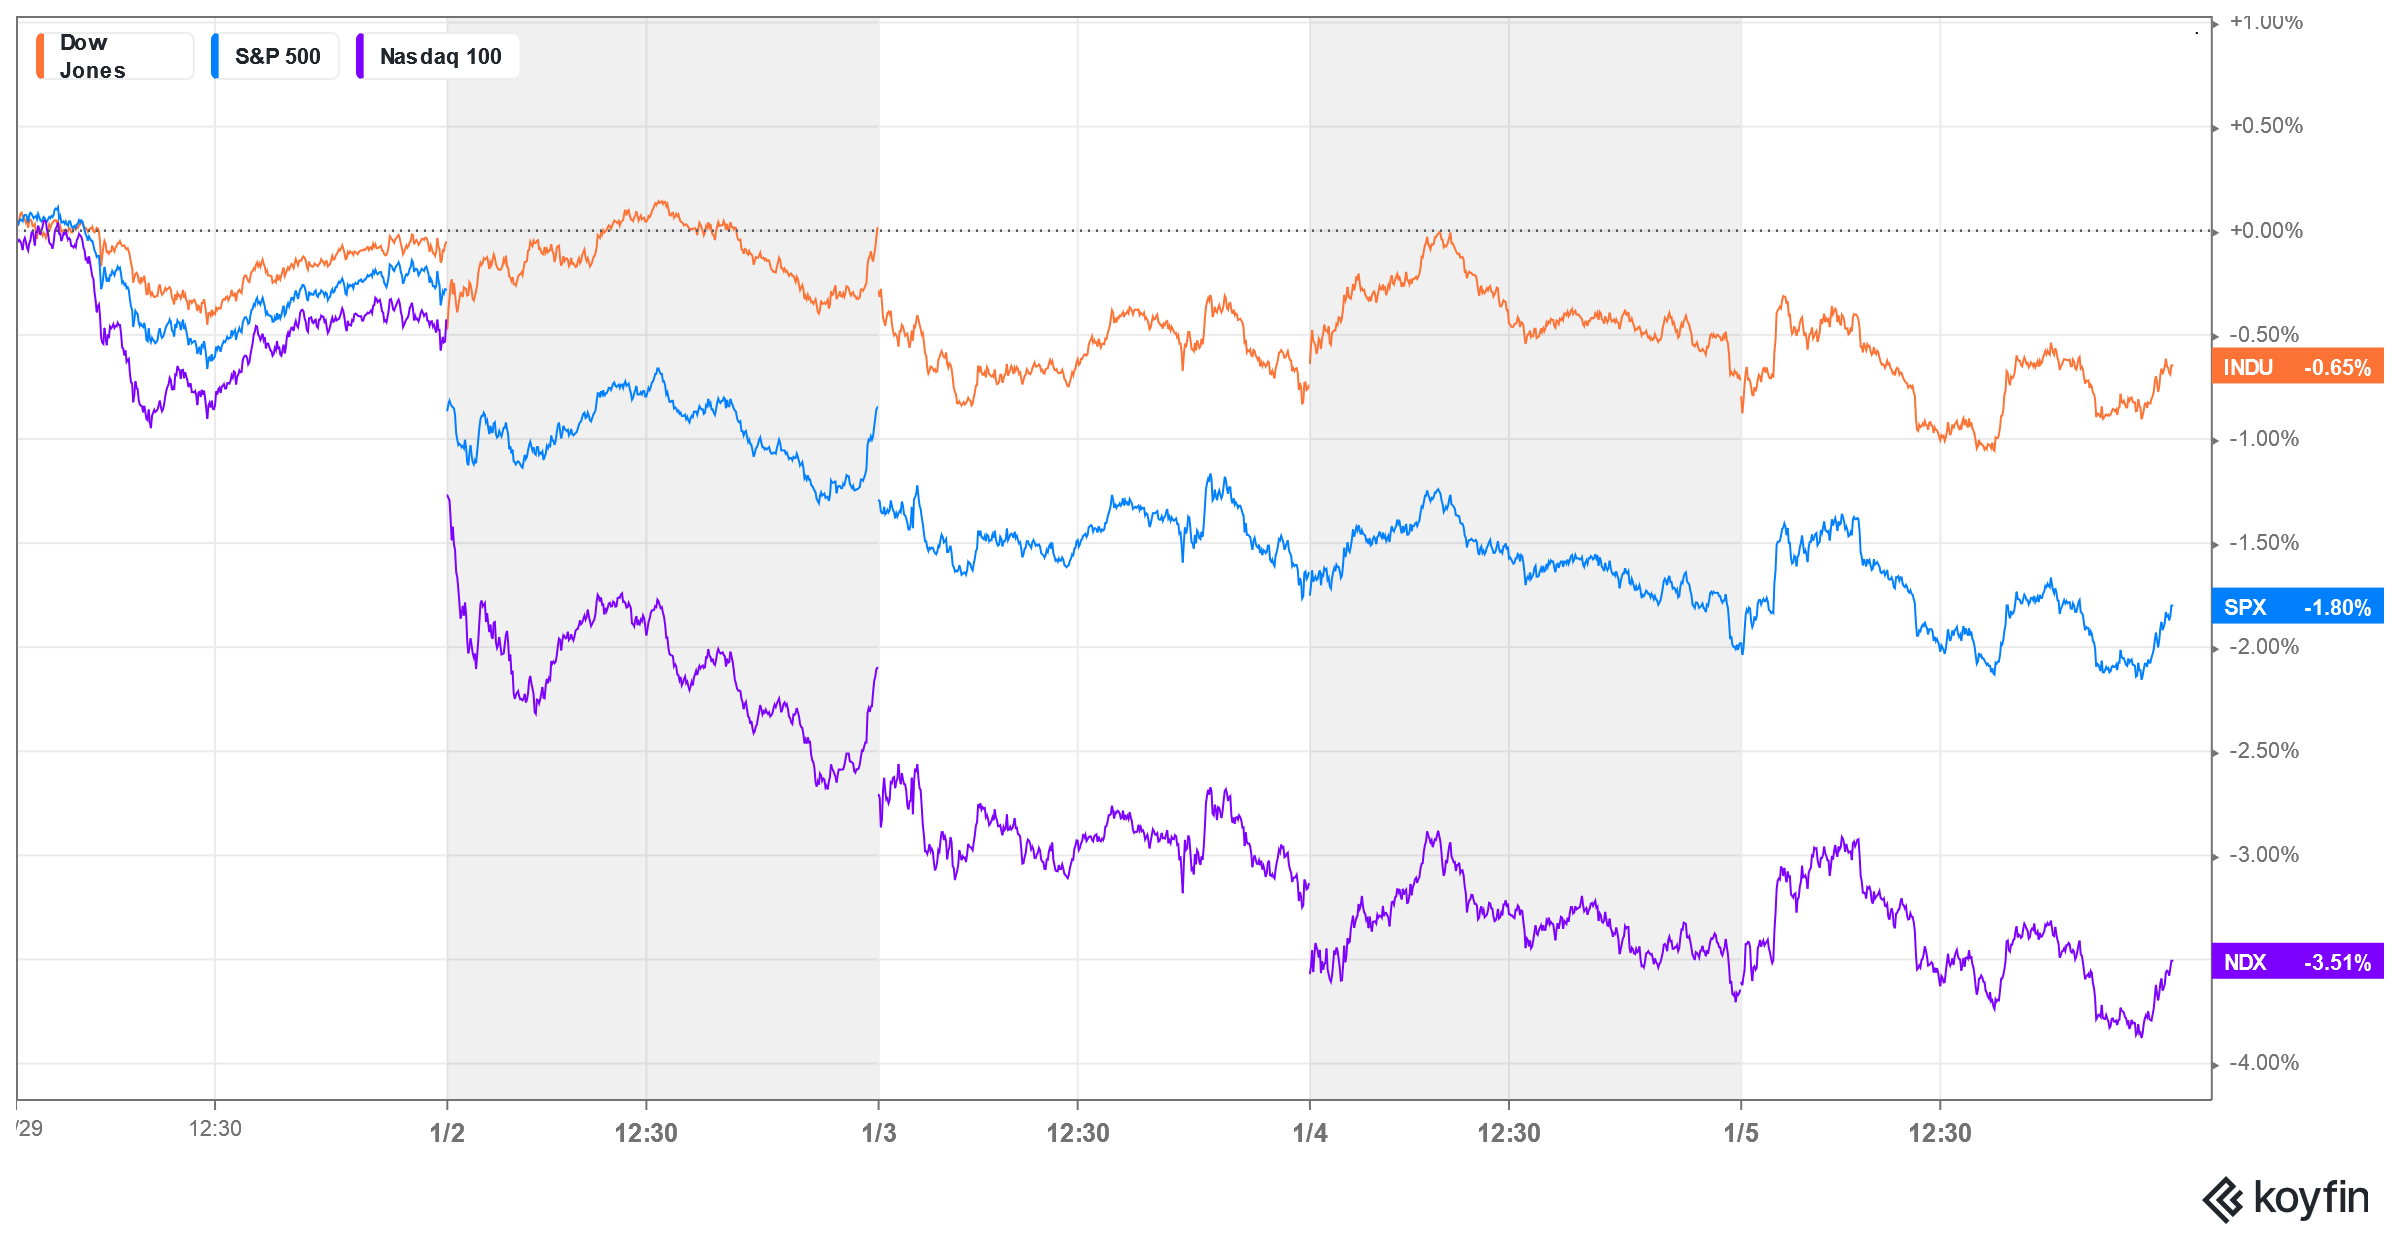
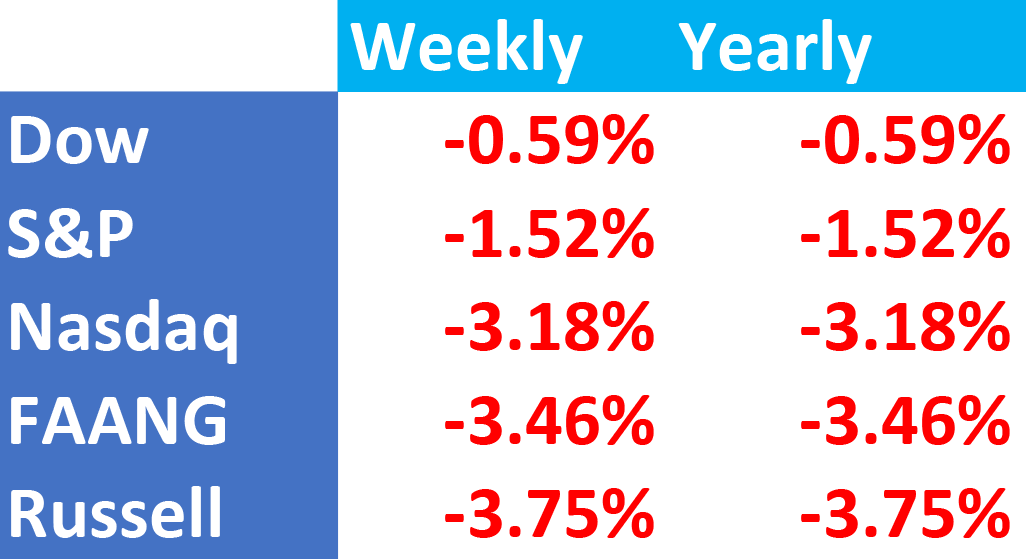
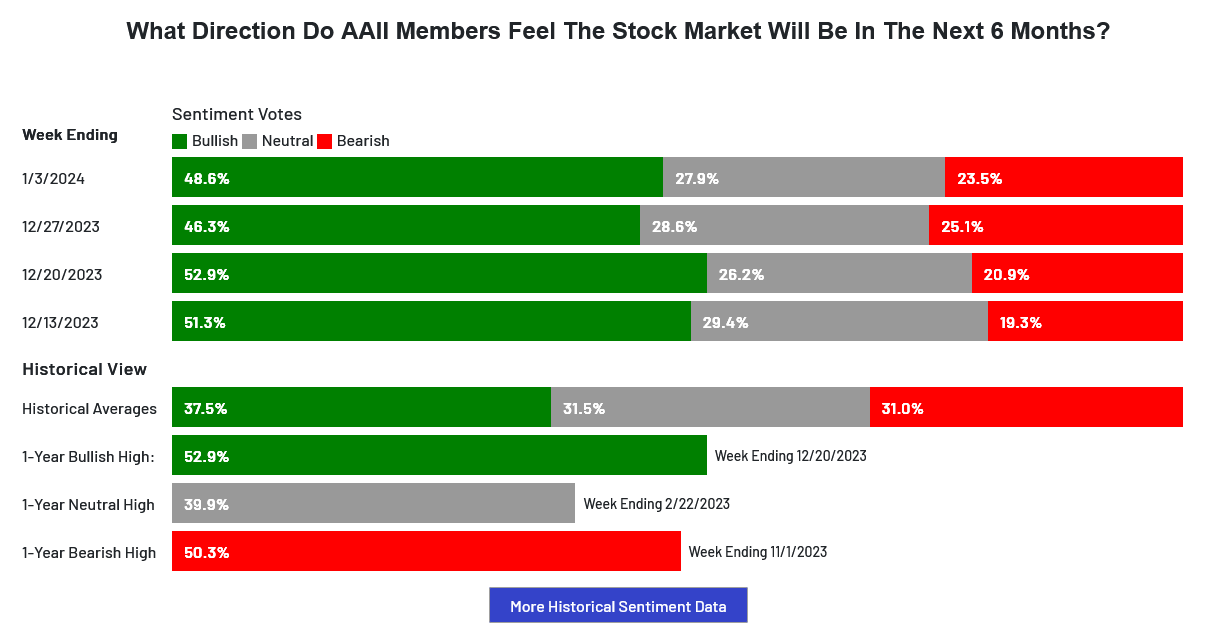
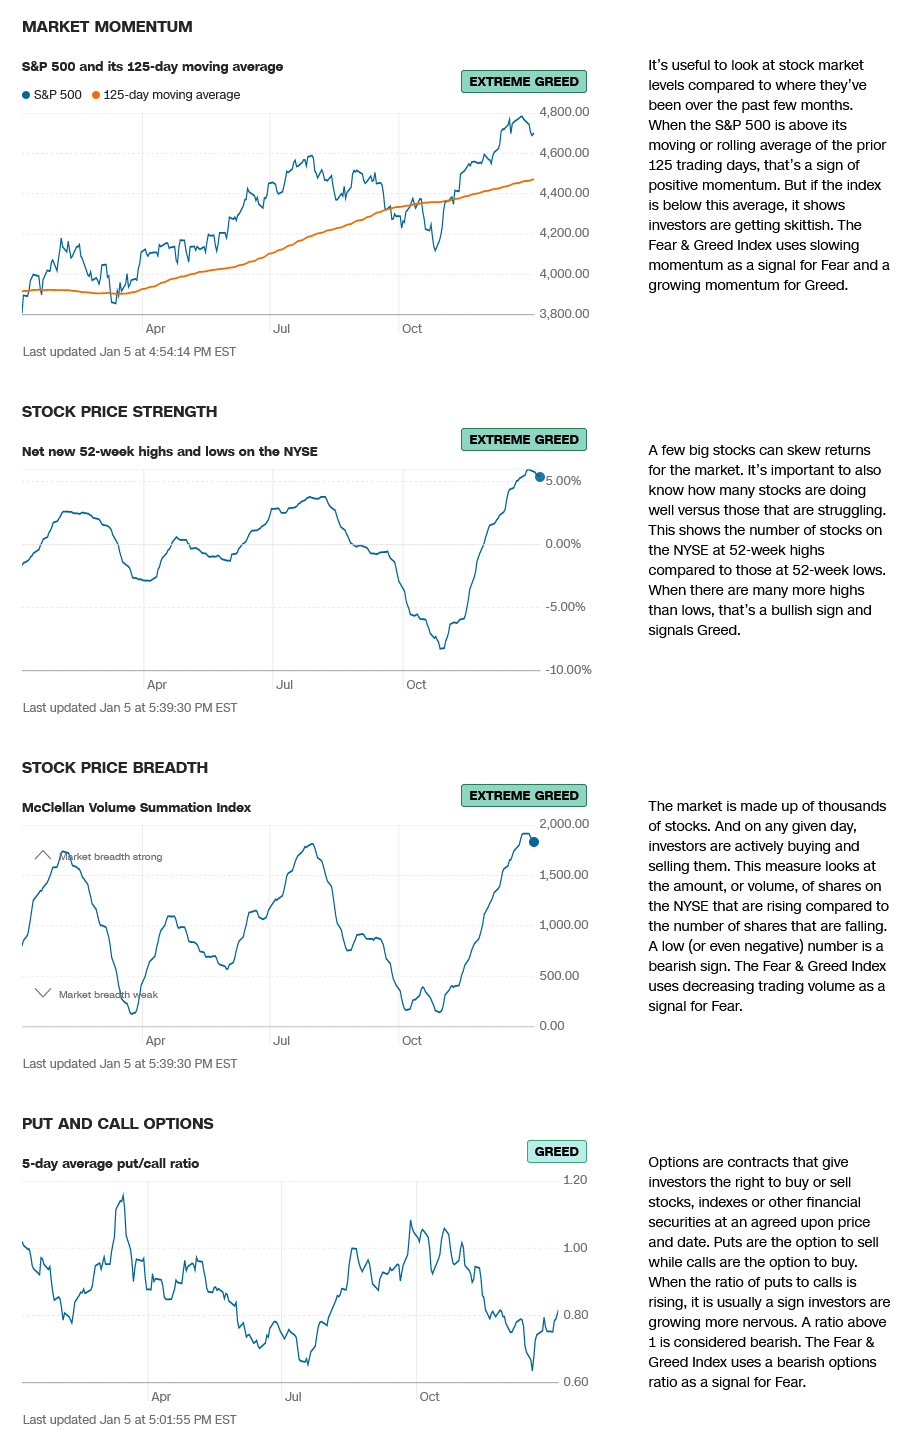
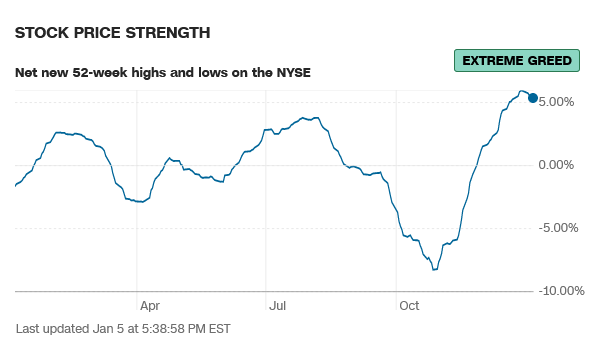
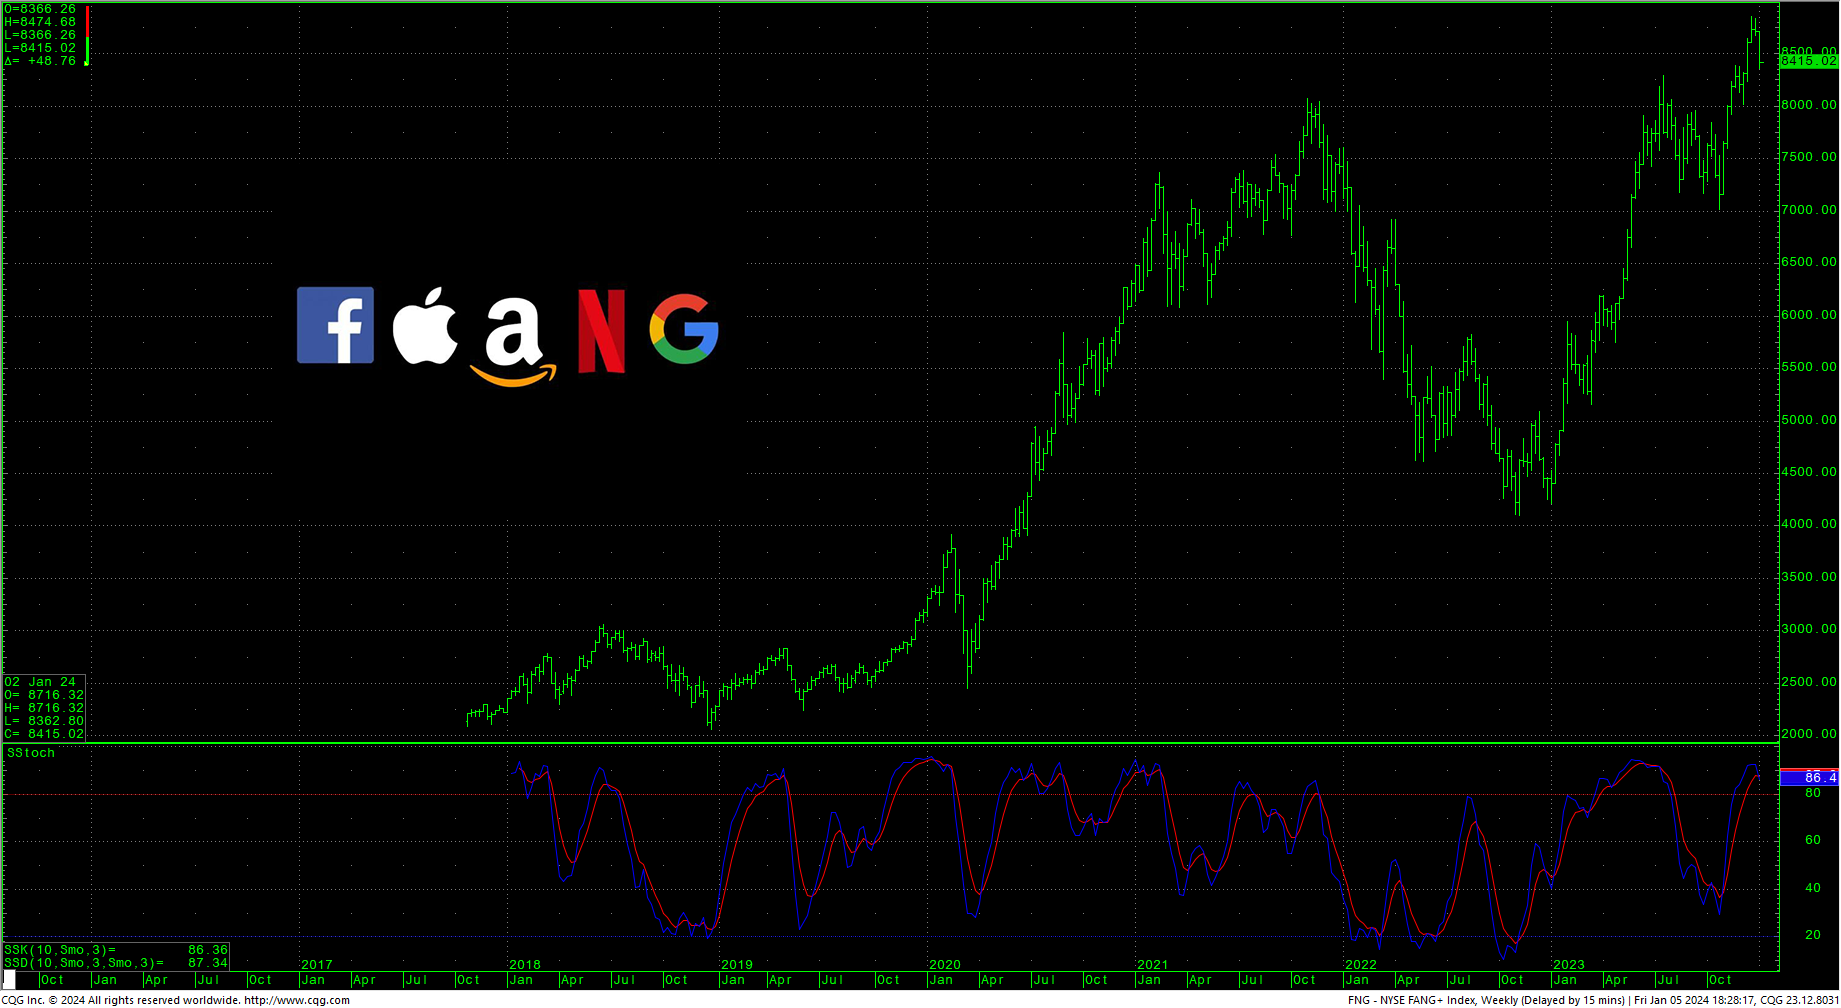
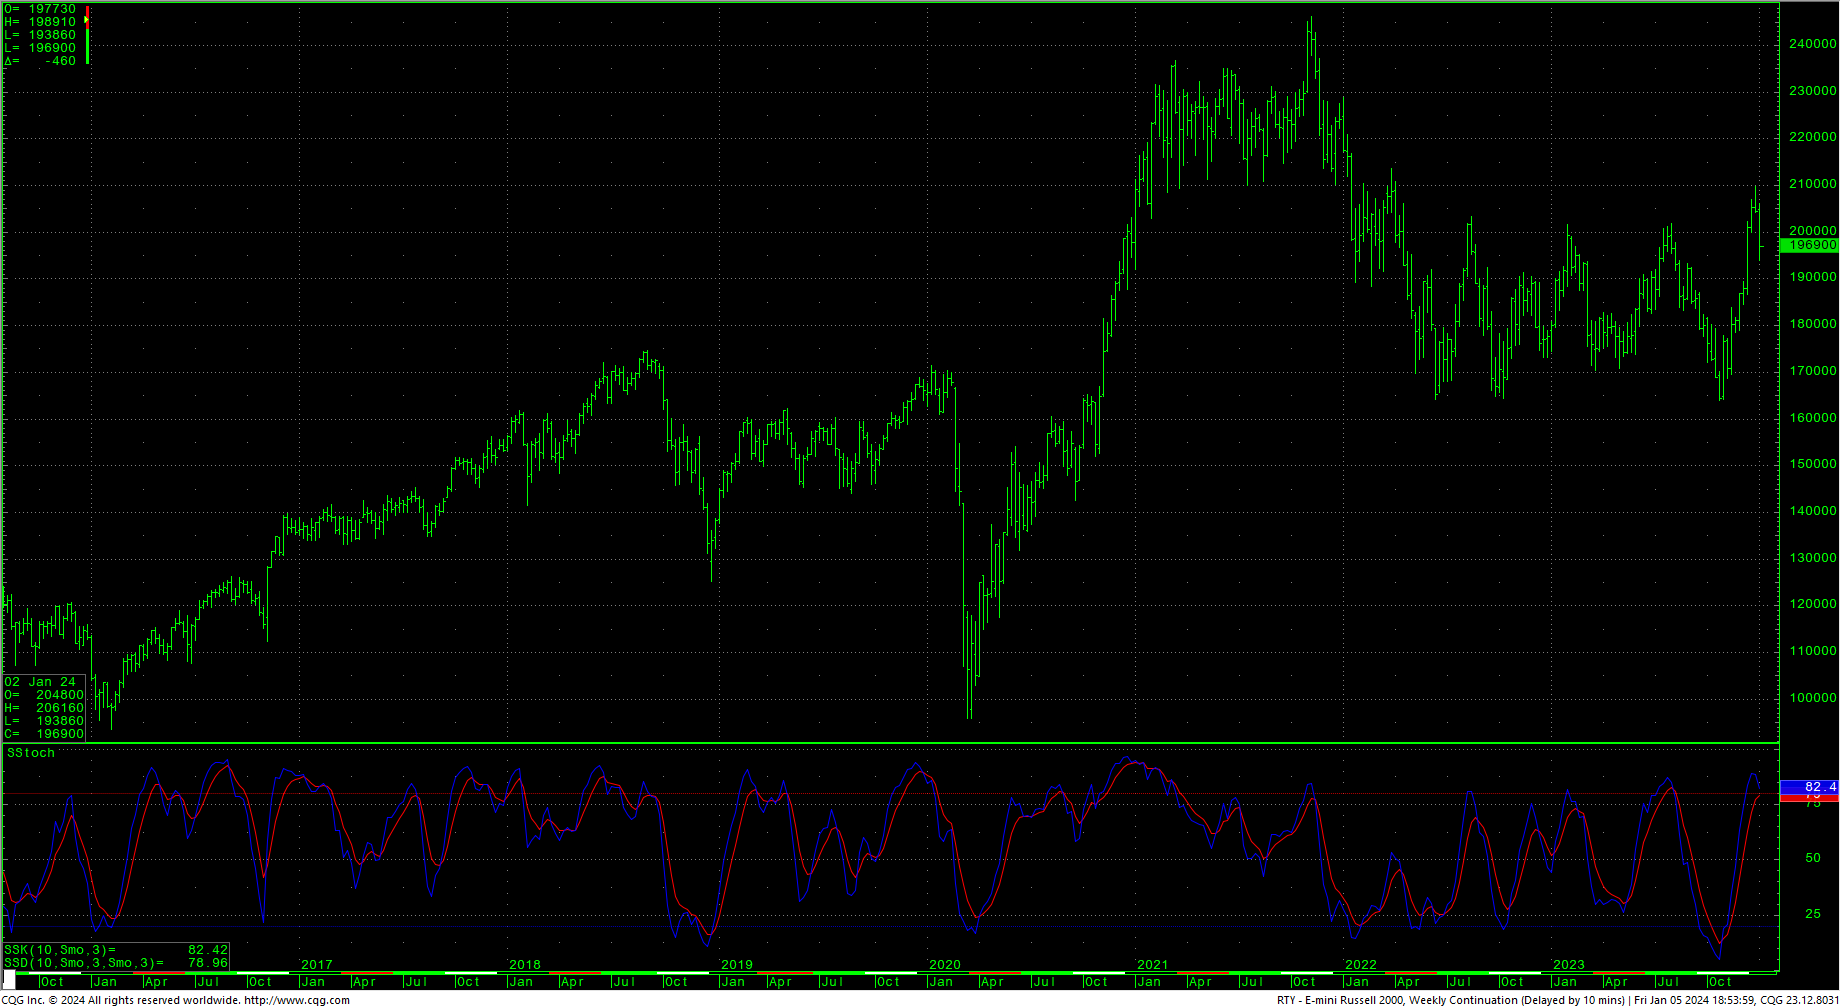
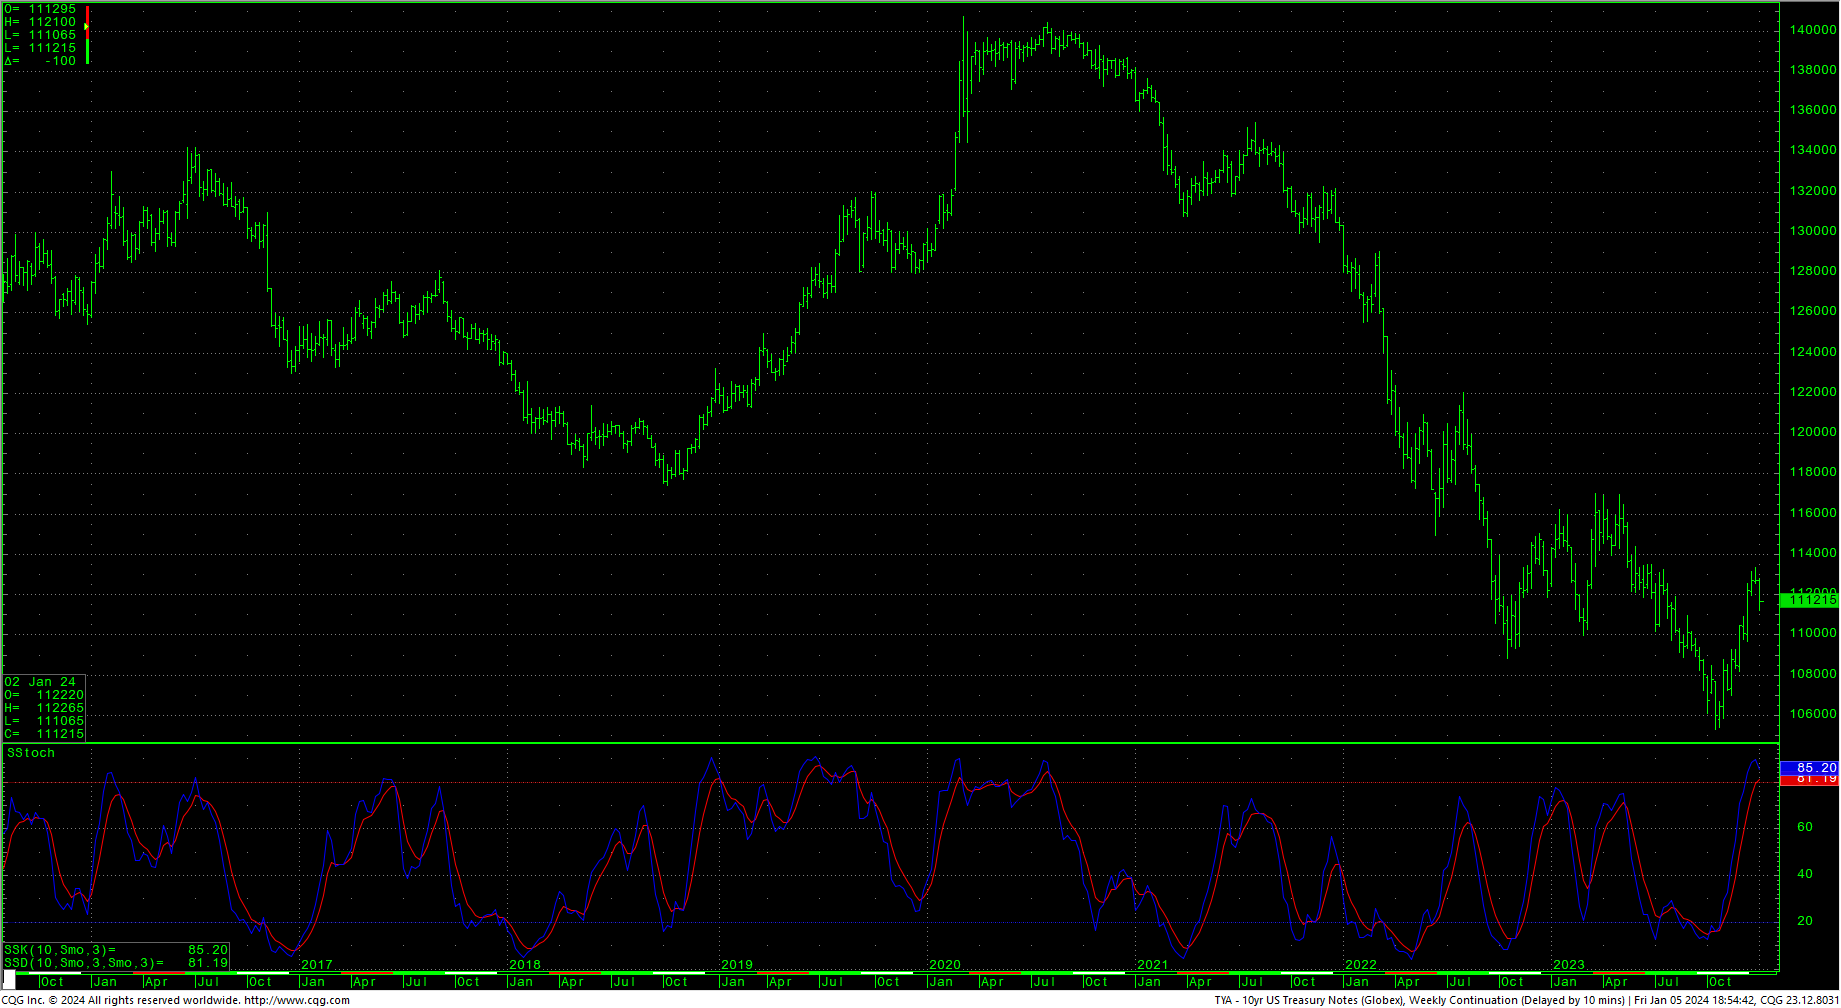
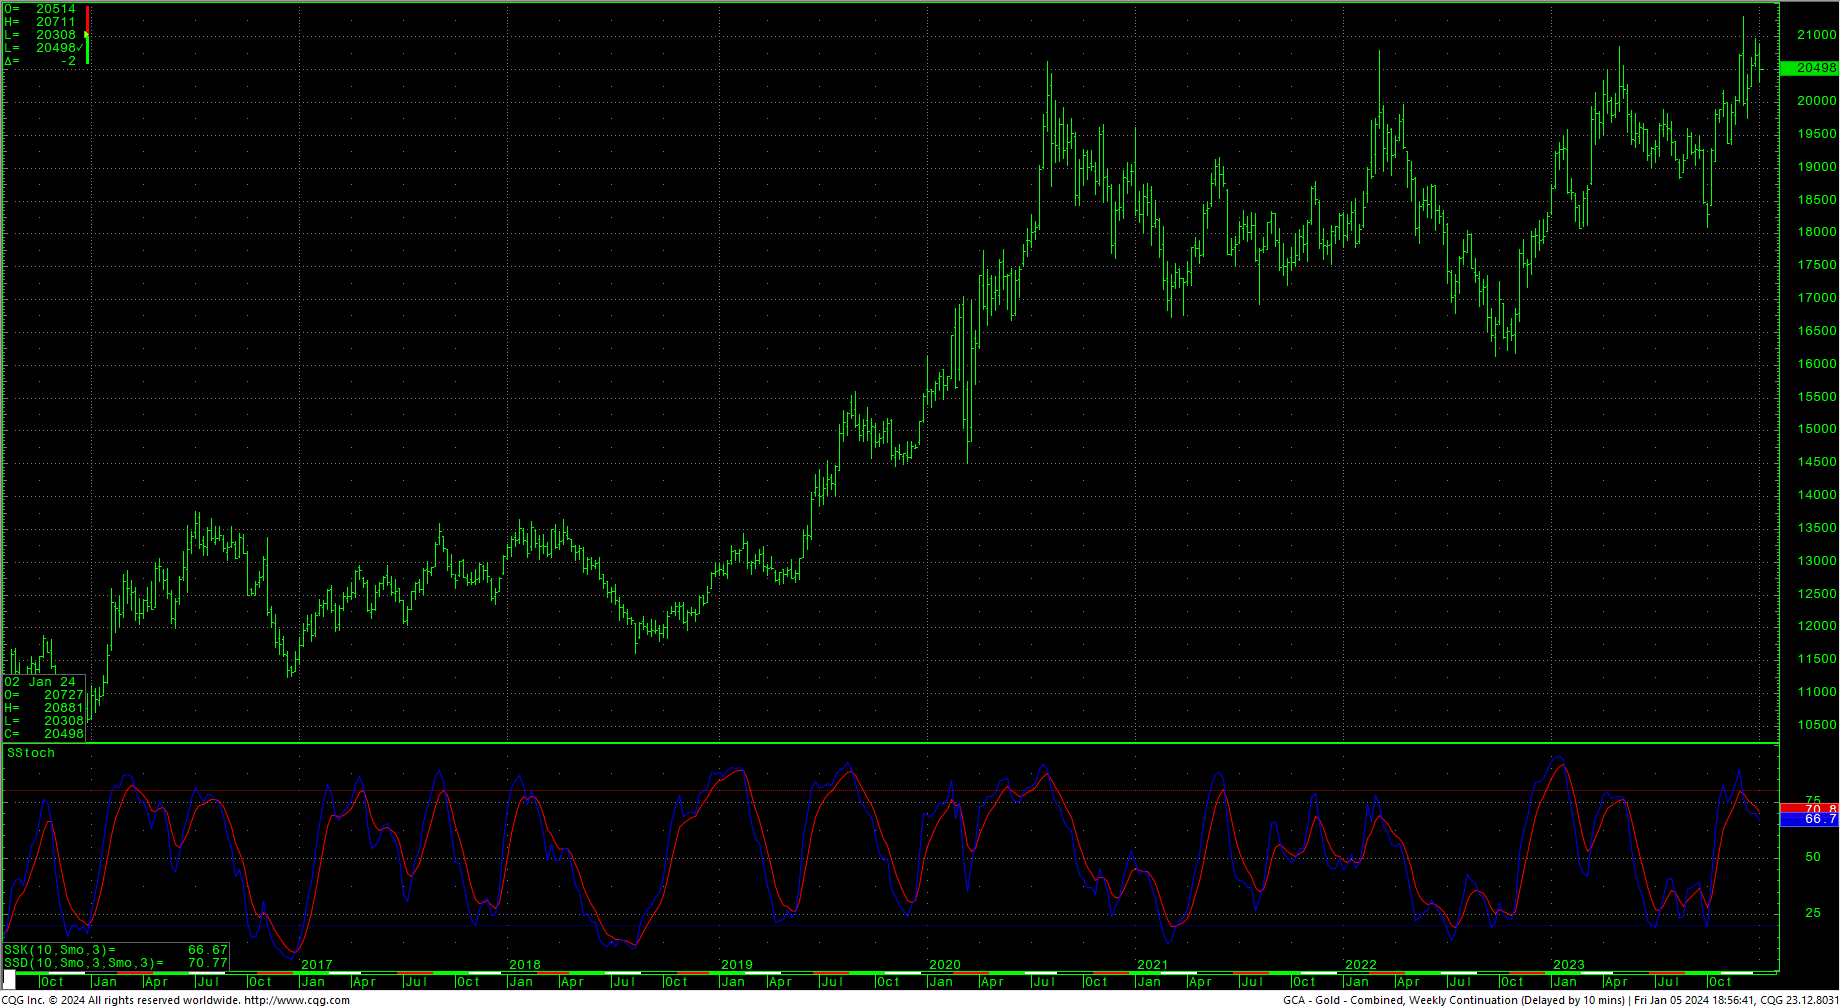
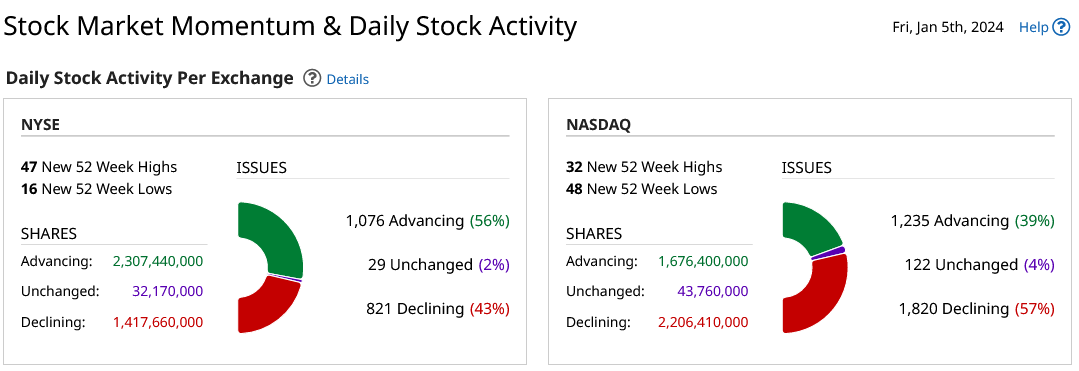 Most sentiment indicators remain in greed/extreme greed readings but tempered slightly the past week. Last week in the AAII Sentiment Survey, Optimism Continued Its Climb. The Dow A/D line sits at 5627, a multi-year high. The VIX closed higher but on the bottom of the week’s range. The Put/Call ratio moved up to 0.82, still reflecting greed. The 52-week, A/D dropped to +5.42% which indicates extreme greed. The Dow closed the week down -0.59%. The S&P was down -1.52%. The Nasdaq ended the week down sharply, off -3.18%, the FANG was sharply lower, down -3.46% and the Russell lead the market down, settling -3.75% lower. The 10-year notes sold off hard as the nearby TYH4 reacted to resistance outlined in the Special Report. The CRB was up -0.90%…crude oil closed higher, on the upper end of a bullish reversal week while gold settled lower and grains sold off. The CoT shows asset managers buying the market and speculators and dealers sold.
Timing Points
The next critical timing point falls is this Monday/Tuesday. Note, we may see higher volume, or, the timing will be the wind up for the pitch (building energy for a move following)…which comes later in the week with the CPI reports.
- 01/08-09 *** X possible extreme
- 01/15 **
- 01/23-24 *** X Key week for financials
CNN Fear & Greed Index
 AAII Investor Sentiment Survey
 Dow Jones Industrial Average Hourly HLC
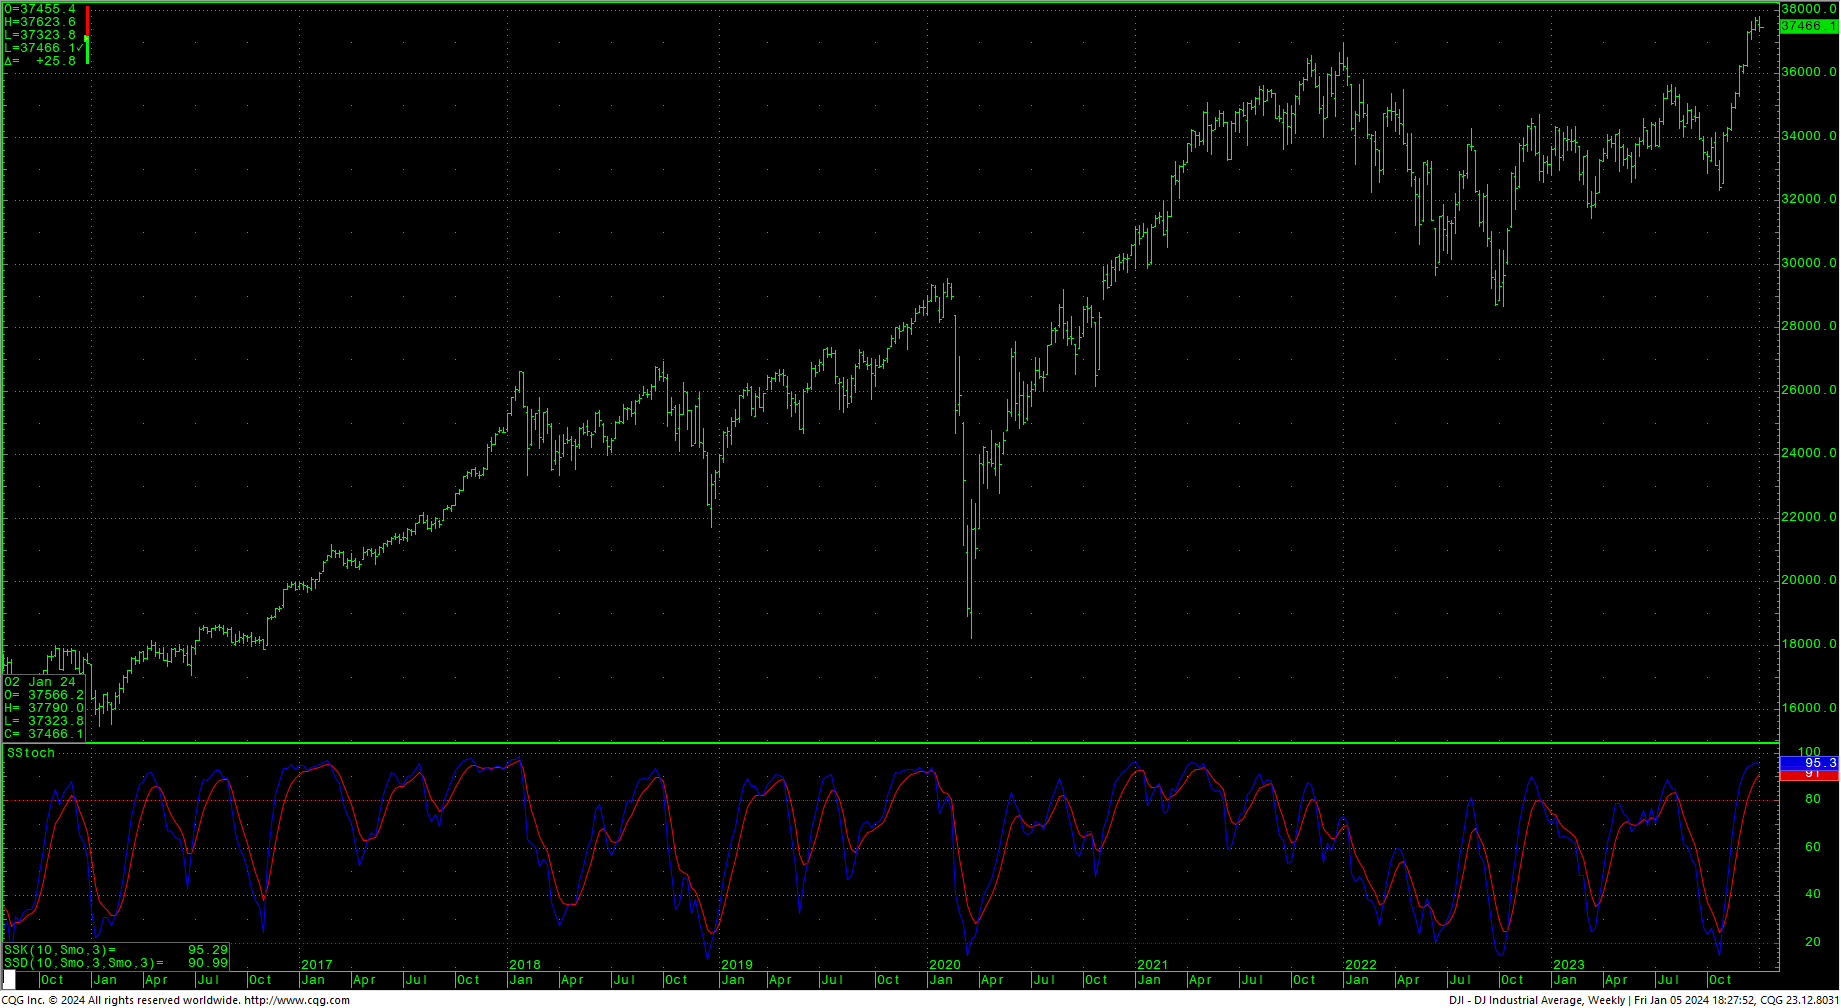
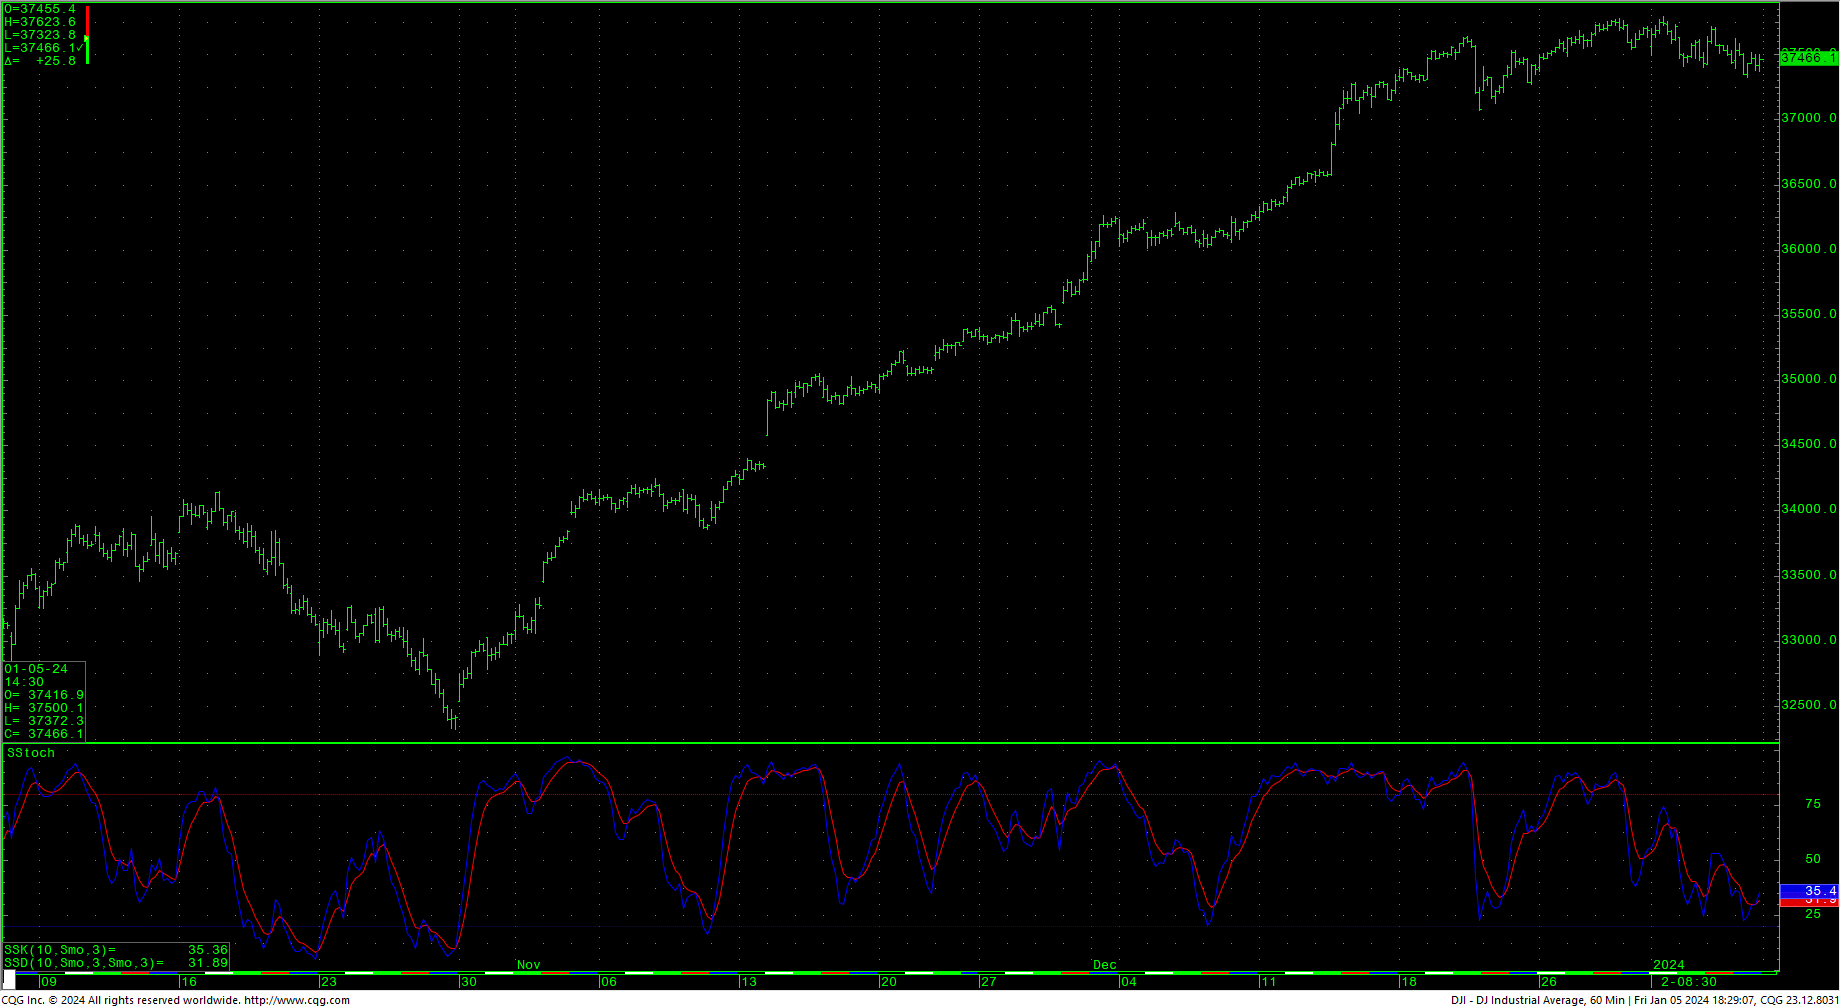 The Dow hourly ended the week in oversold territory with prices congesting off to the side of the recent record highs. Resistance is 37501, 37556 and 37611/37615. A drive above 37615 should minimally test 37679 with potential to 37790. A breakout rally over 37790 should renew momentum toward the upside targets of 38378.5 and 38454.7. Closes over 38454.7 suggest a move to long-term targets at 37095. Closes over 37095 offer counts to targets at 40245.4.
Support is at 37323 and 37298. Under 37298 can carry to 37073 and 36994. Closes under 36994 setup 36748 and pivotal near-term support of 36502/36495. Closes under 36495 opens counts toward 35703. A breakdown under 35703 can carry to 35058 with potential to critical short-term support of 34413/34408 through 34302. Closes below 34302 open counts to 33955 with potential to 33225. Closes under 33225 open counts to critical long-term support of 32148/32140 with support at 32327. A breakdown with closes under 32140 is bearish and opens counts into the 31565/31555 area.
Dow Jones Industrial Average Weekly HLC
Resistance
|
Support
|
S&P 500 Cash Index
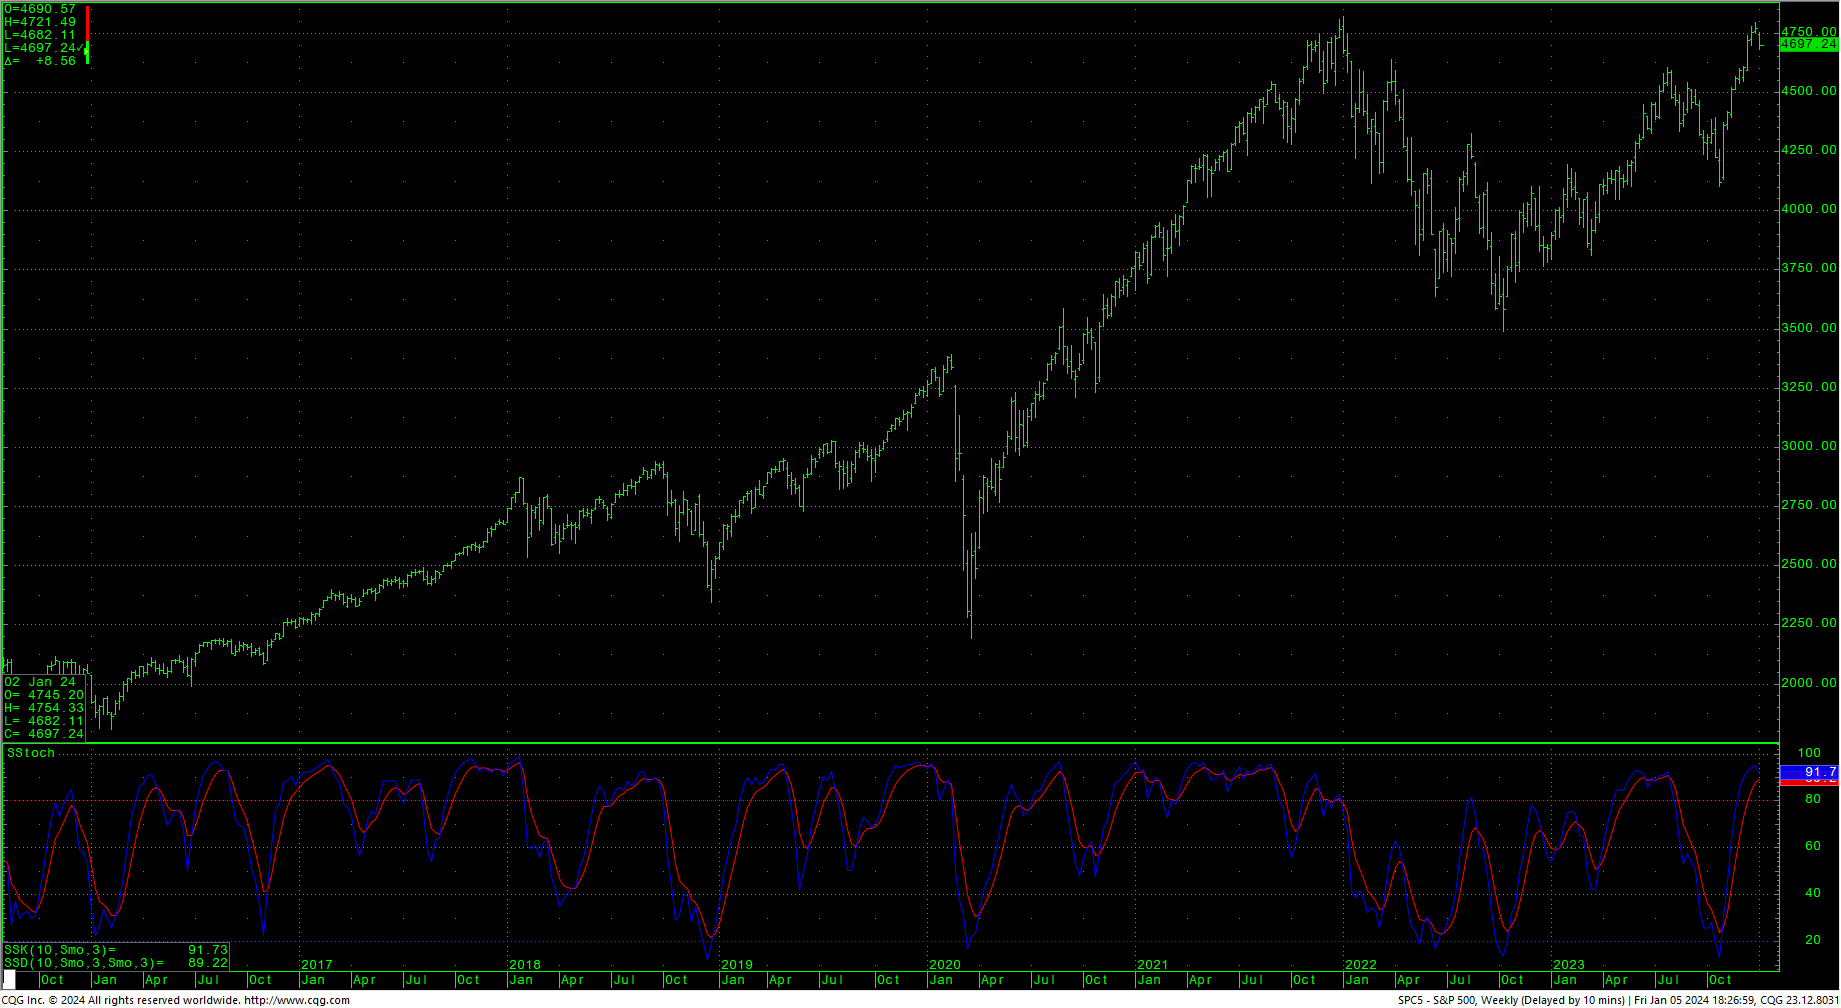
The S&P hourly is oversold and flashing a preliminary bullish divergence. The market has tested a key swing low on the hourly while the daily is working off overbought conditions. The question now is, how steep any developing correction may need to be versus how much time is required to build congestion for a potential new wave. Resistance is 4724, 4737, and 4750/4755. Rallies over 4755 setup a drive to 4767 with potential to 4793/4797. Closes over 4797 should minimally carry the index to the record intraday highs at 4818.62. Closes above 4818/4819 opens counts to 4952/5000 with potential to 5144. Closes over 5144 set up a drive to 5288 with counts to 5432. A breakout over 5432 will open potential to the 5720 area.
Support is at 4682, 4660 and pivotal short-term at 4629/4625. A breakdown with closes under 4625 sets up a move to 4590 with potential to 4630/4629. A breakdown under 4629 should test 4529. Daily closes under 4529 count to 4448 with potential to critical short-term support of 4367/4362. Daily closes under 4362 set up a move to 4266 with potential to support at 4103/4102. Daily closes under 4102 open counts to critical long-term support of 3917/3910.
S&P 500 Index Weekly HLC
Resistance
|
Support
|


