
TECHNICAL ANALYSIS (by Intraday Dynamics)
Major Indices Week of February 2, 2024
 QQQ Nasdaq Weekly
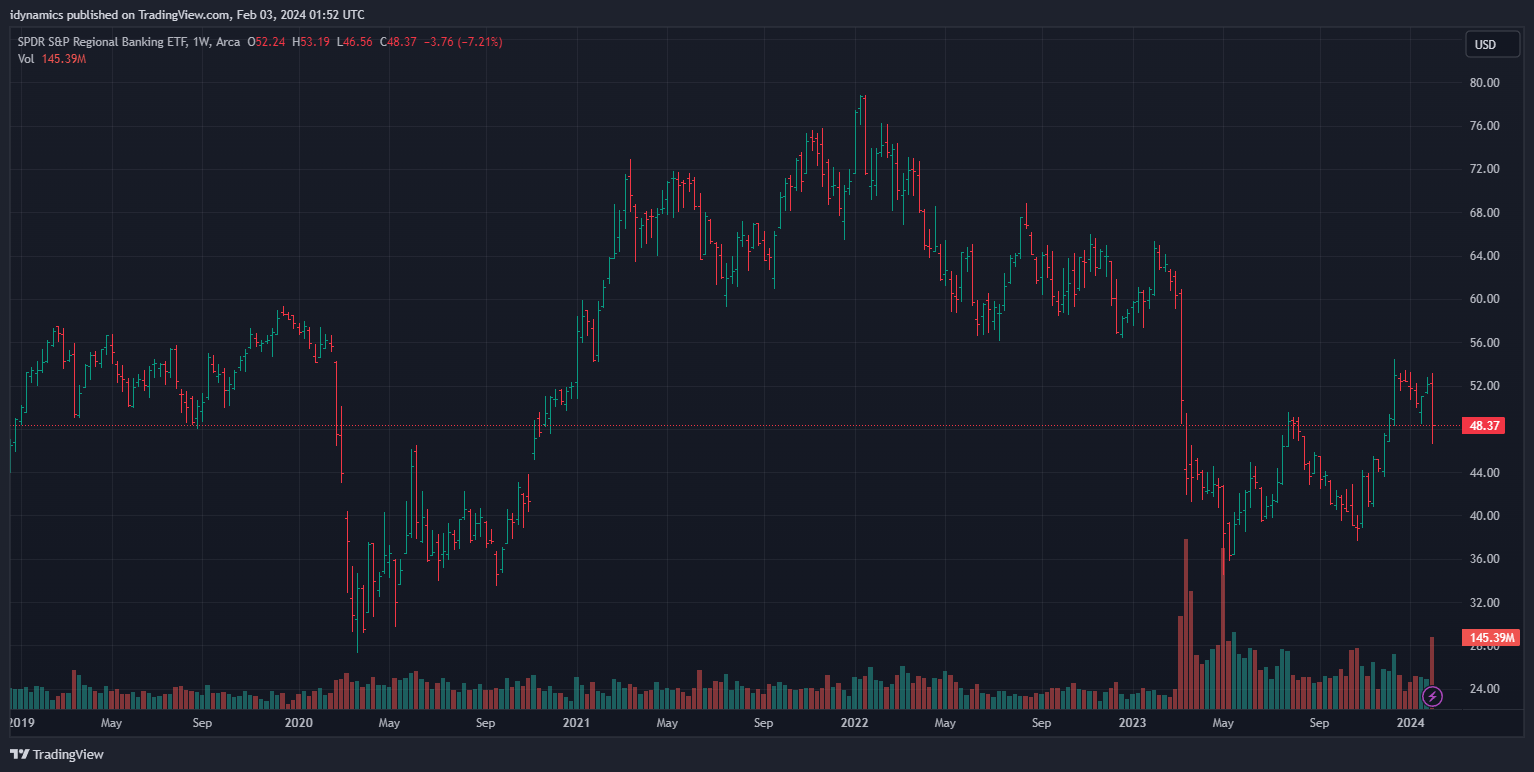
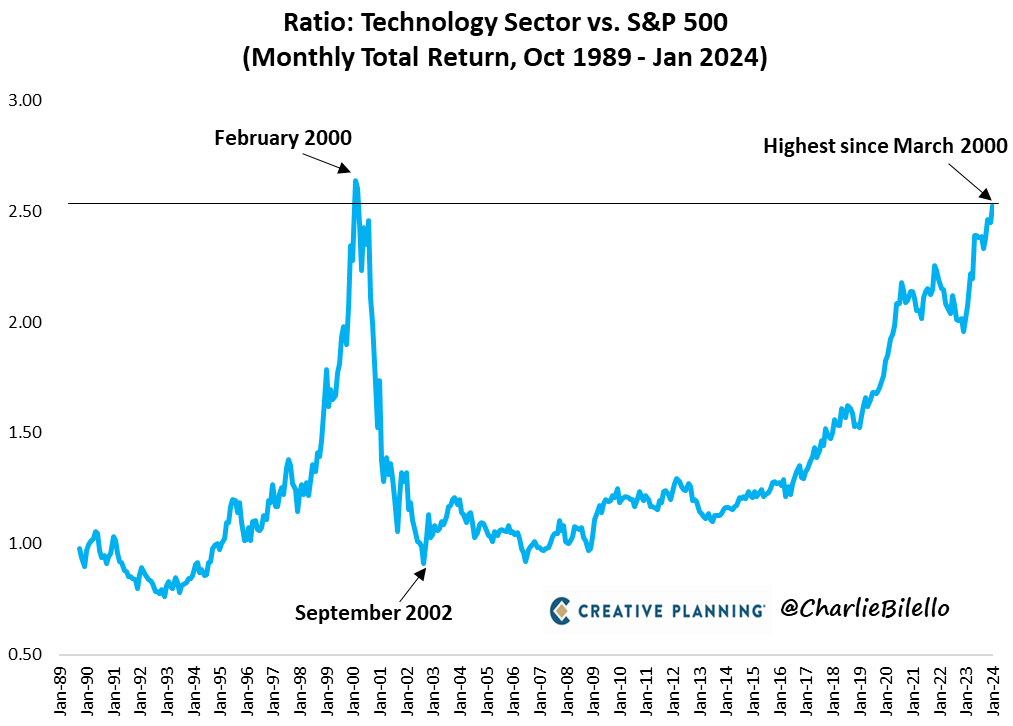
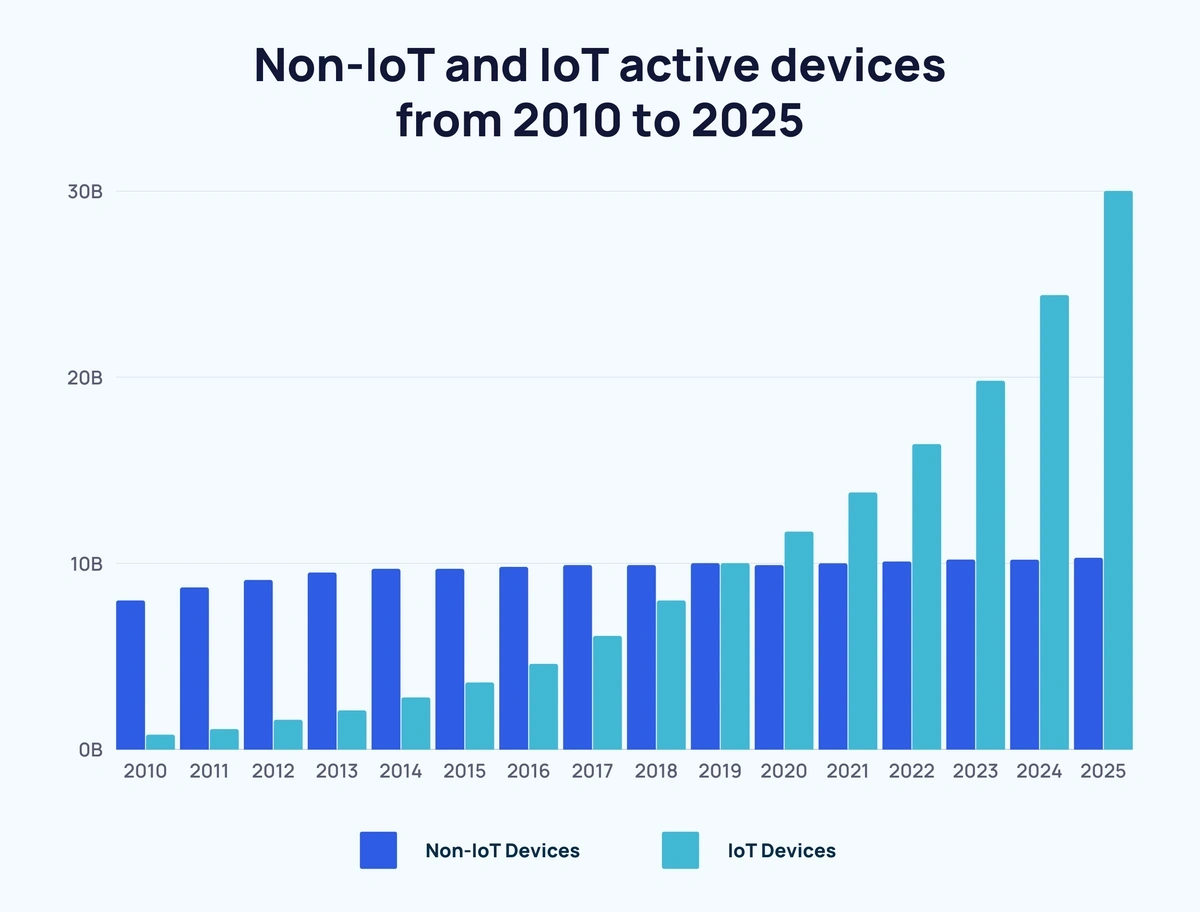
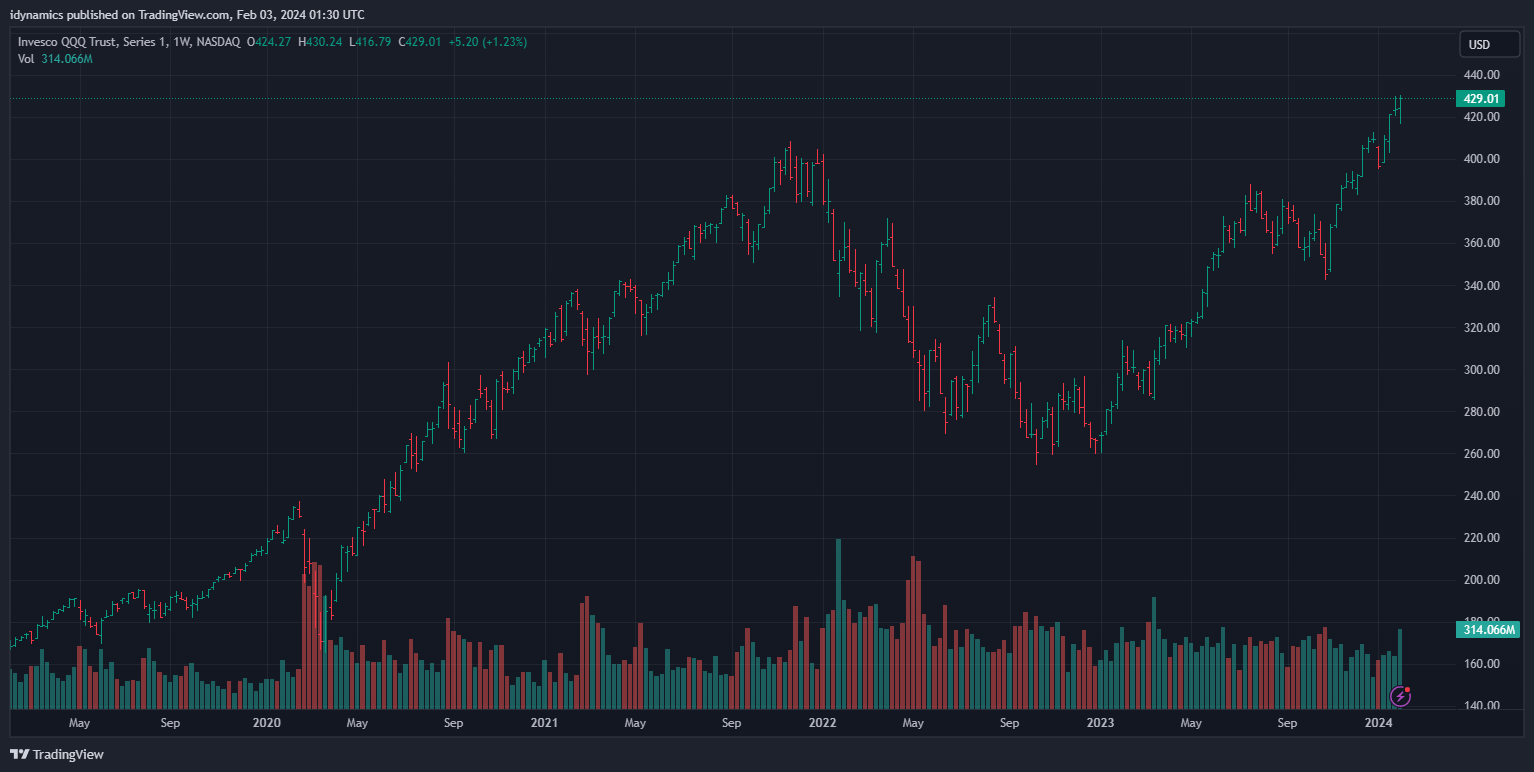 Stocks traded a wild week with most major indices trading to new record highs, for the fourth week in a row. The market moved through a tense week of trade with the focus primarily on the Fed and anticipation of rate cuts for 2024. That view was smashed on Wednesday when the Fed Chairman indicated it is way too soon to discuss cuts. Then, in Friday’s cycle timing, an extremely robust Unemployment report gave prices an early shock, only to see indices explode to record highs, led by the red-hot tech market. Coupled in this mix was a meltdown last week in regional banks, leading to yellow-light calls from several analysts. There is much scuttlebutt going around about how the current tech rally means the market is ‘thin.’ Accompanying this sentiment is the continued extremely weak action in the secondary markets. Number crunchers are likening the current explosive tech trade to the DotCom bubble at the turn of the century. The DotCom bubble was driven by a massive accounting shell game. The current tech rally is being driven by demand for chips, which is only going become even more gonzo in the next 5-6 years as IoT devices appear in literally every single appliance, car, security system, energy monitoring, household devices….the list is very, very long. And all those devices will need cloud storage which all spells chips.
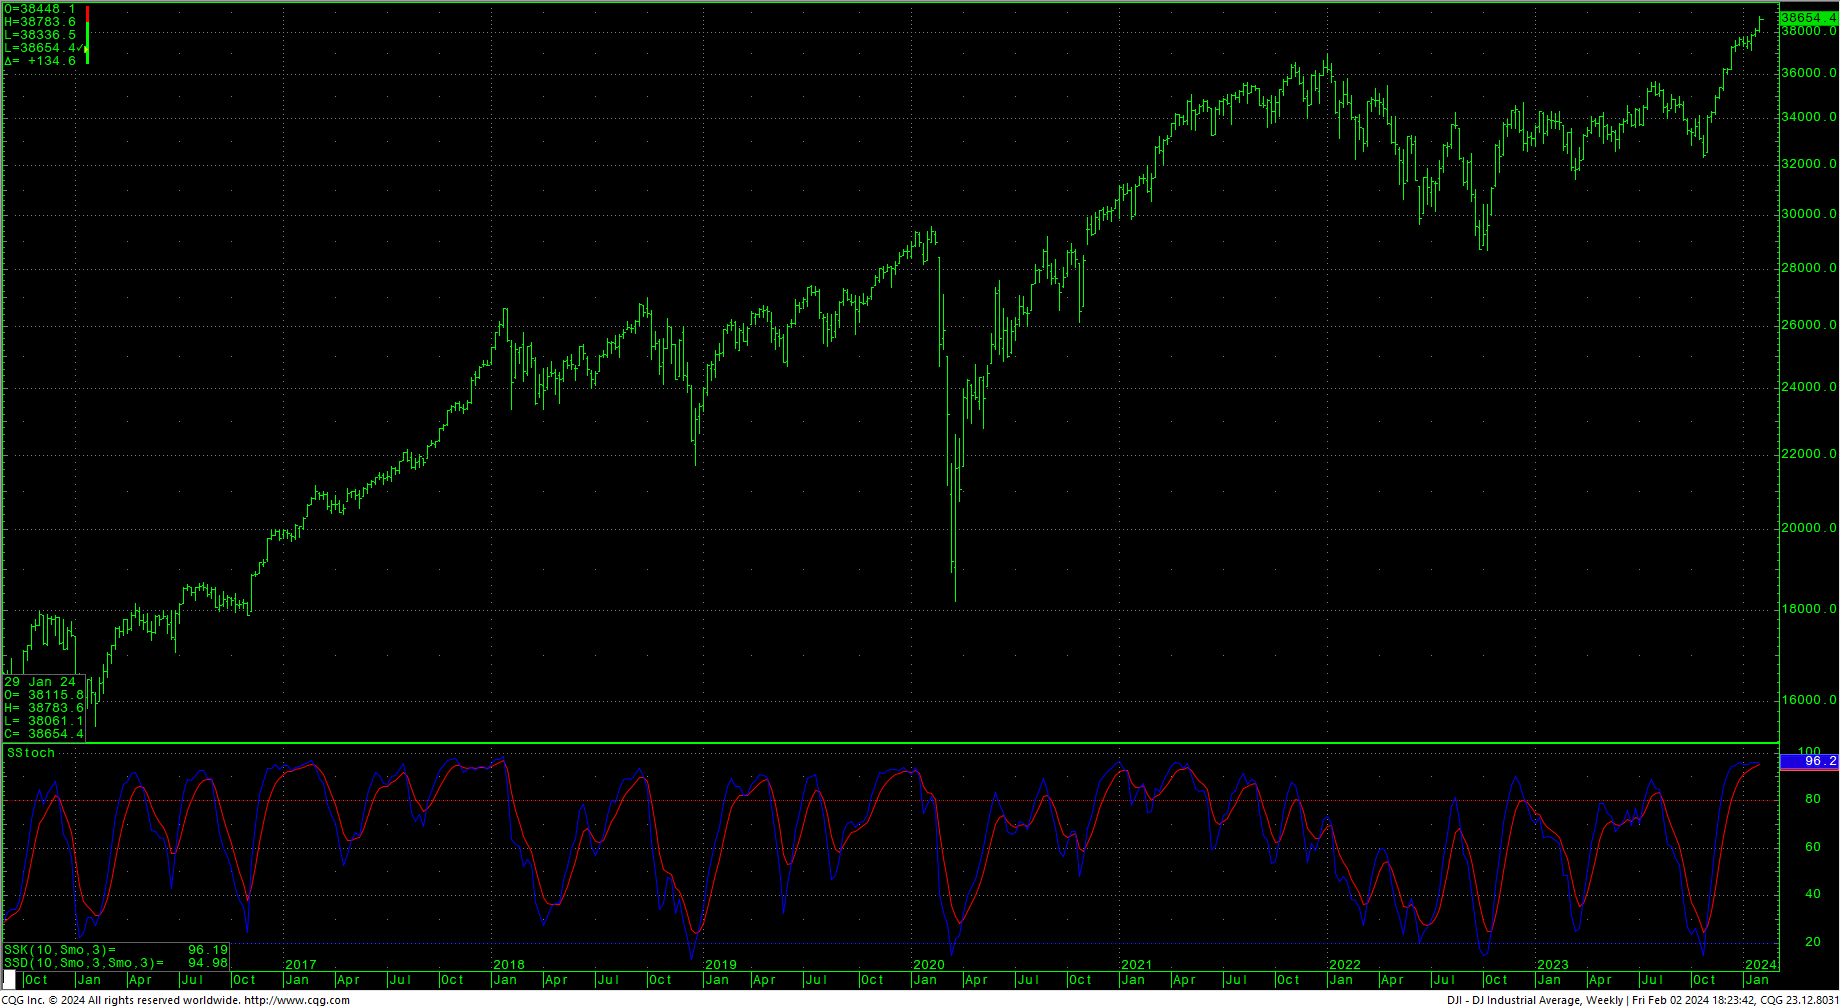
 Last week, we mentioned that, “…psychologically, the market could well be on the threshold of a ‘melt up’ in a third wave drive that will carry the Dow toward the 45000 level…If prices continue to surge here, the Dow should minimally get to the target area just overhead at 38378.5-38454.7” We have now met that target area. In fact, the Dow targets, and the targets we outlined in the Special Report on S&P Mini Futures “key overhead targets on the SPH4 chart at 4948 and 4974.” Both these objectives offered strong hourly resistance mid-week and led to tradeable declines prior to Friday’s big surge.
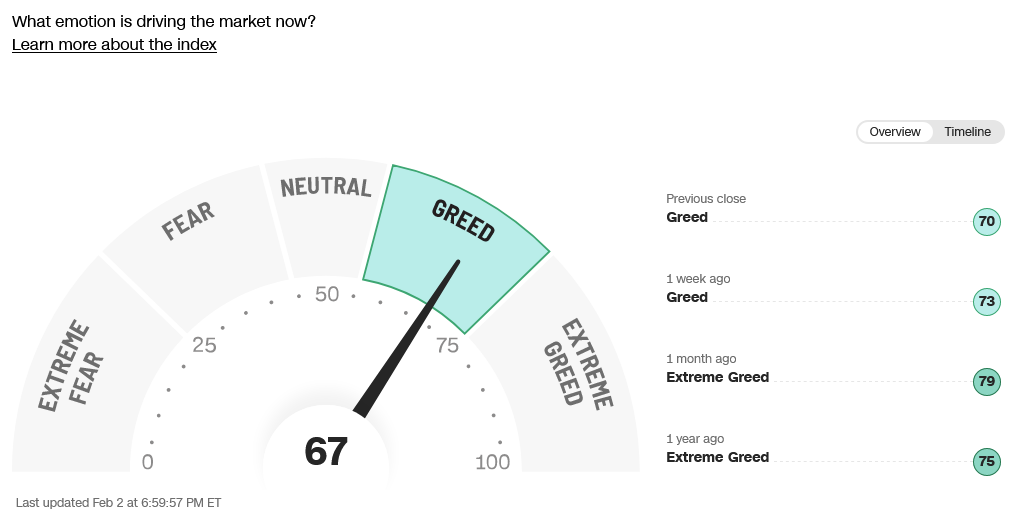
Sentiment remains genuinely frothy, yet there is still not the kind of exuberance and/or volume that indicates things are getting crazy or manic. There is also over $6 trillion sidelined in money markets. With the regional bank meltdown and big name banks scoring record breaking profits in 2023, the question for the near-term will be whether those money market funds succumb to FOMO and fuel a further third wave rally, or will it find its way back into the banks? Now that the Dow has hit the target area of 38378.5-38454.7 and closed above it, there is potential now to 39075 with a target at 40245.4 and rallies above that count to further targets at 45,244. Timing-wise, Friday marked minor timing and the next critical timing point is this Wednesday/Thursday and should be key to all the financial markets including the bonds and the dollar.
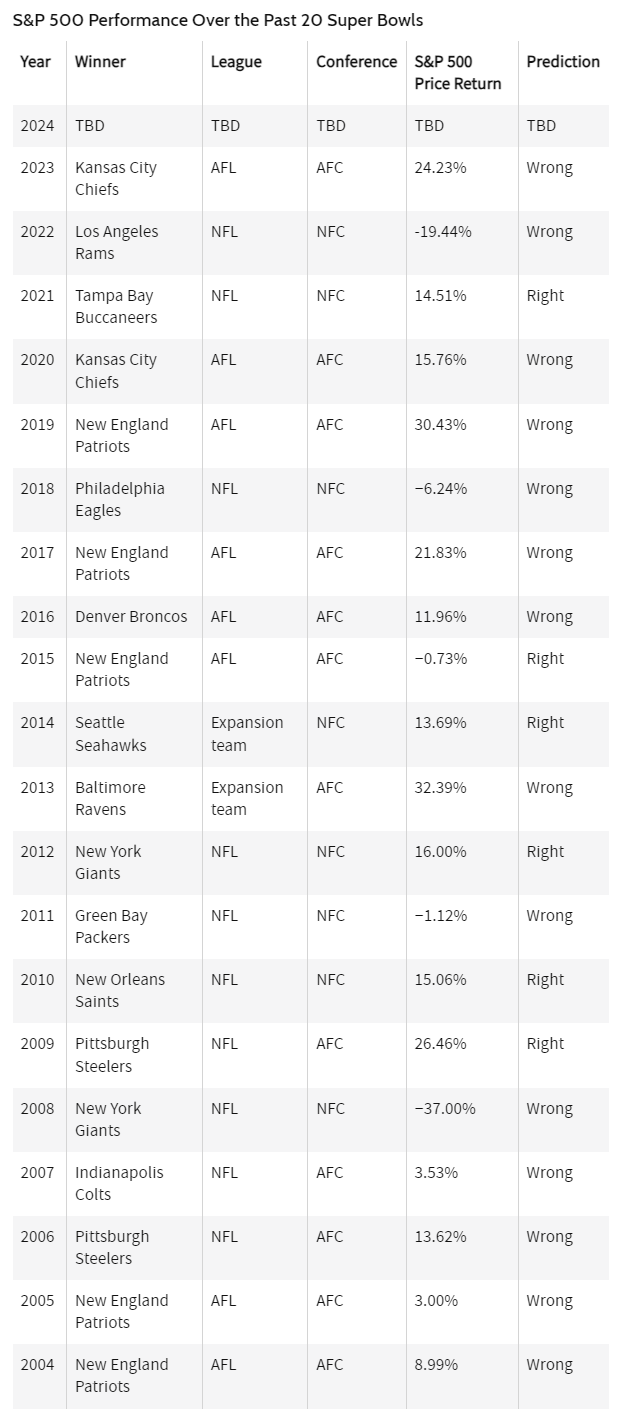
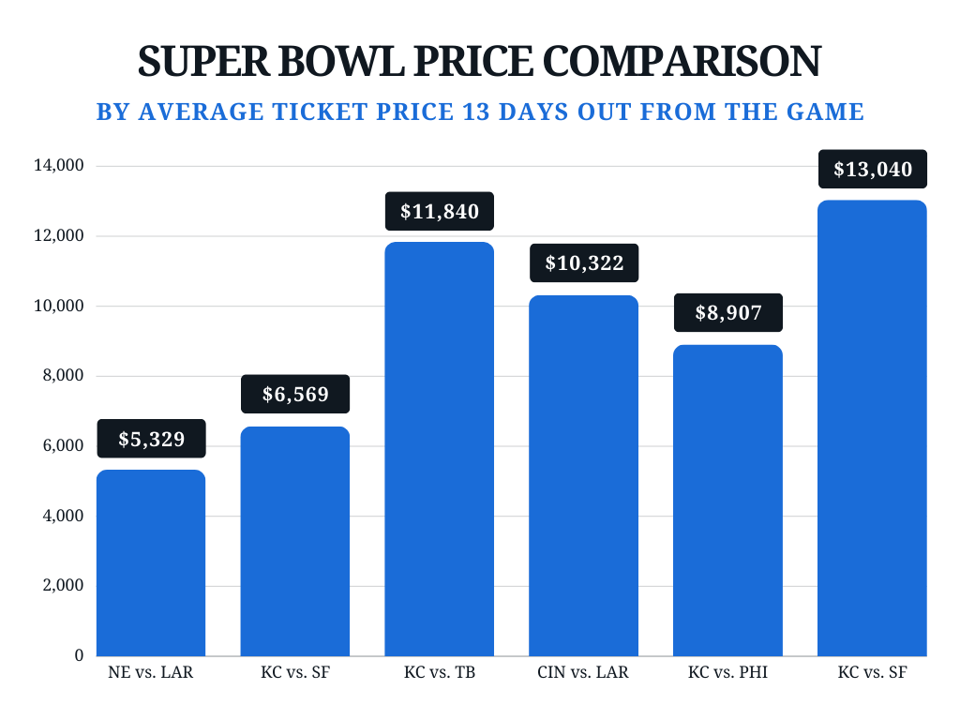 Just for fun, it’s time to look at the Super Bowl Indicator for the market…and remember that, in the past two decades, the so-called indicator has been an abject failure at prediction.
52-Week A/D Line
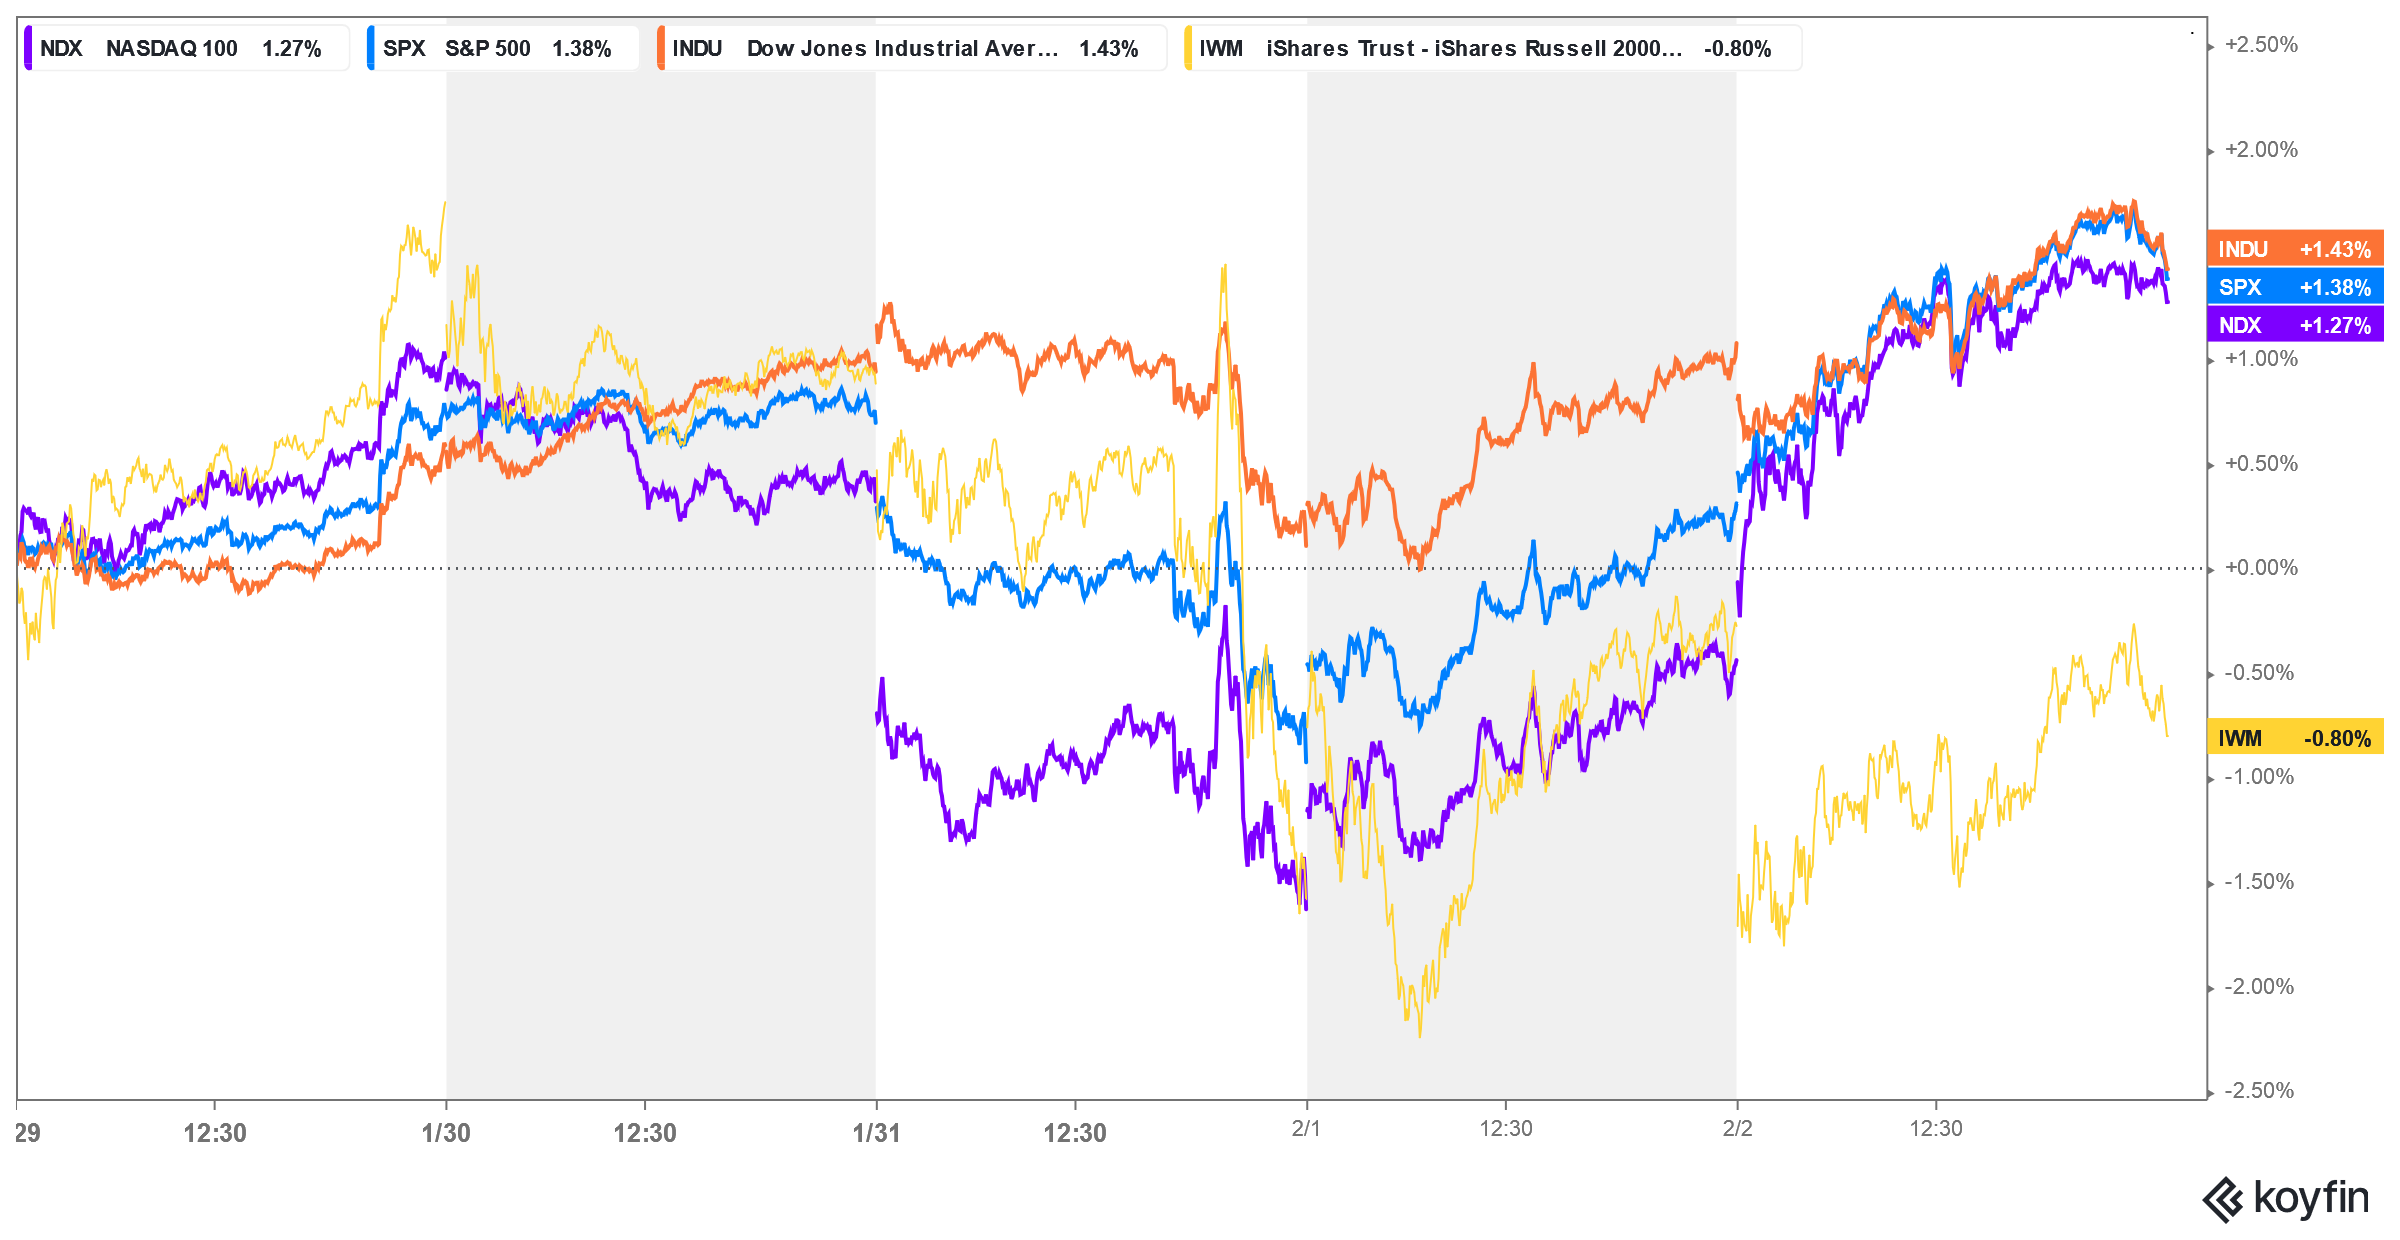
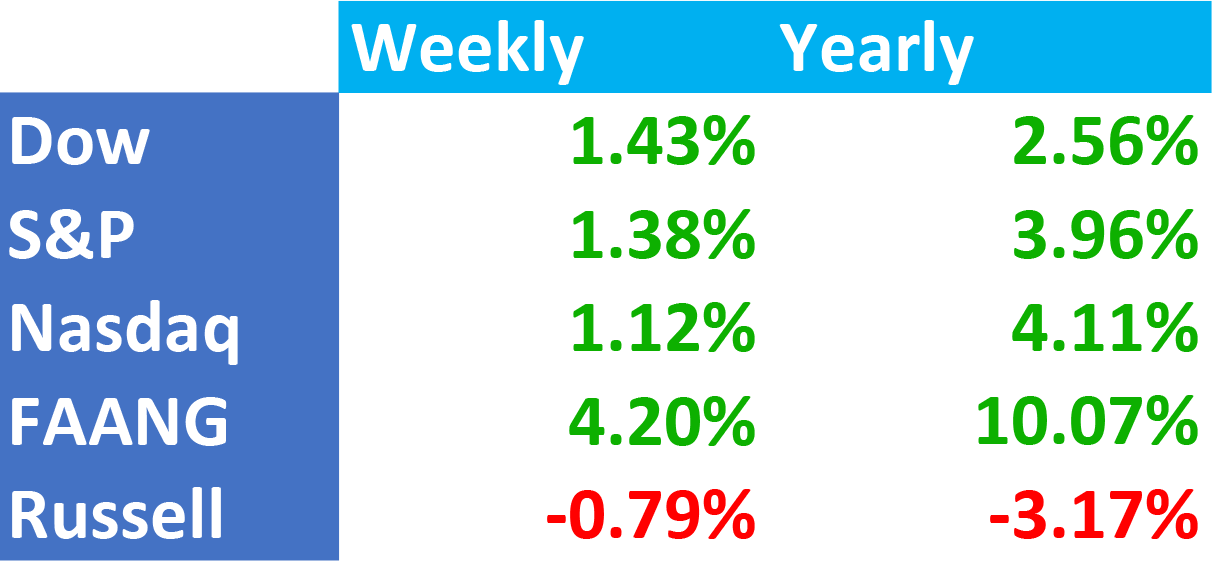
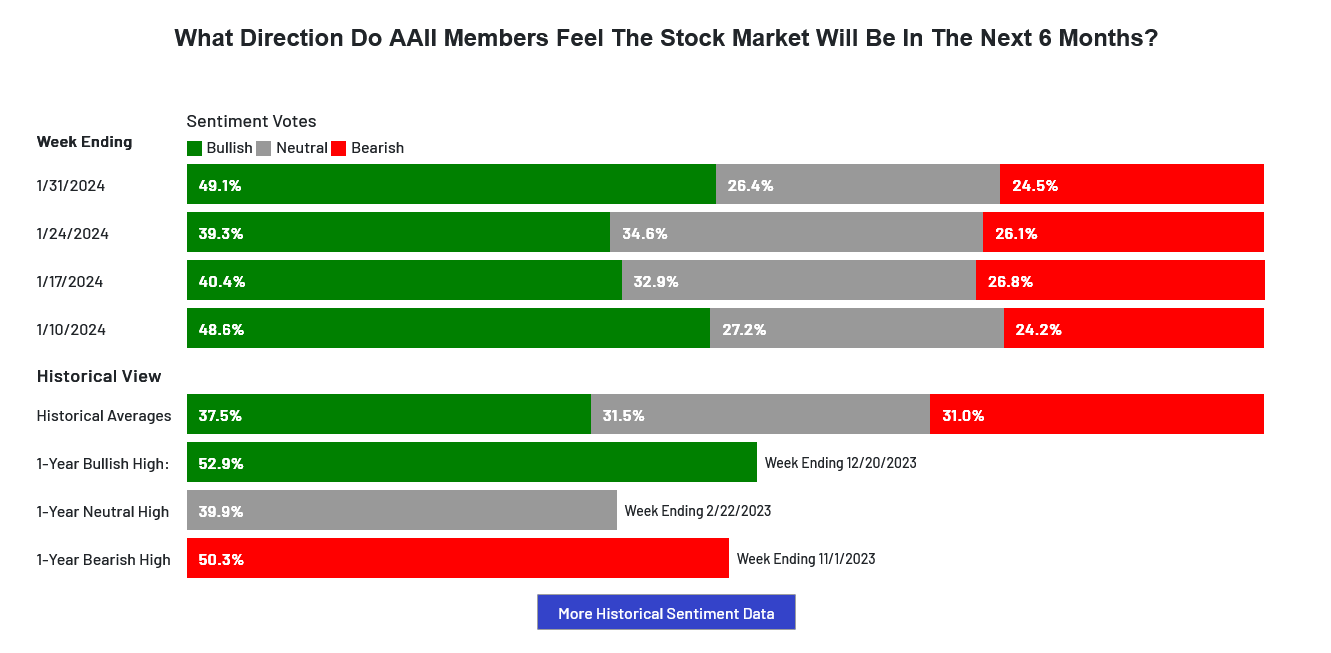
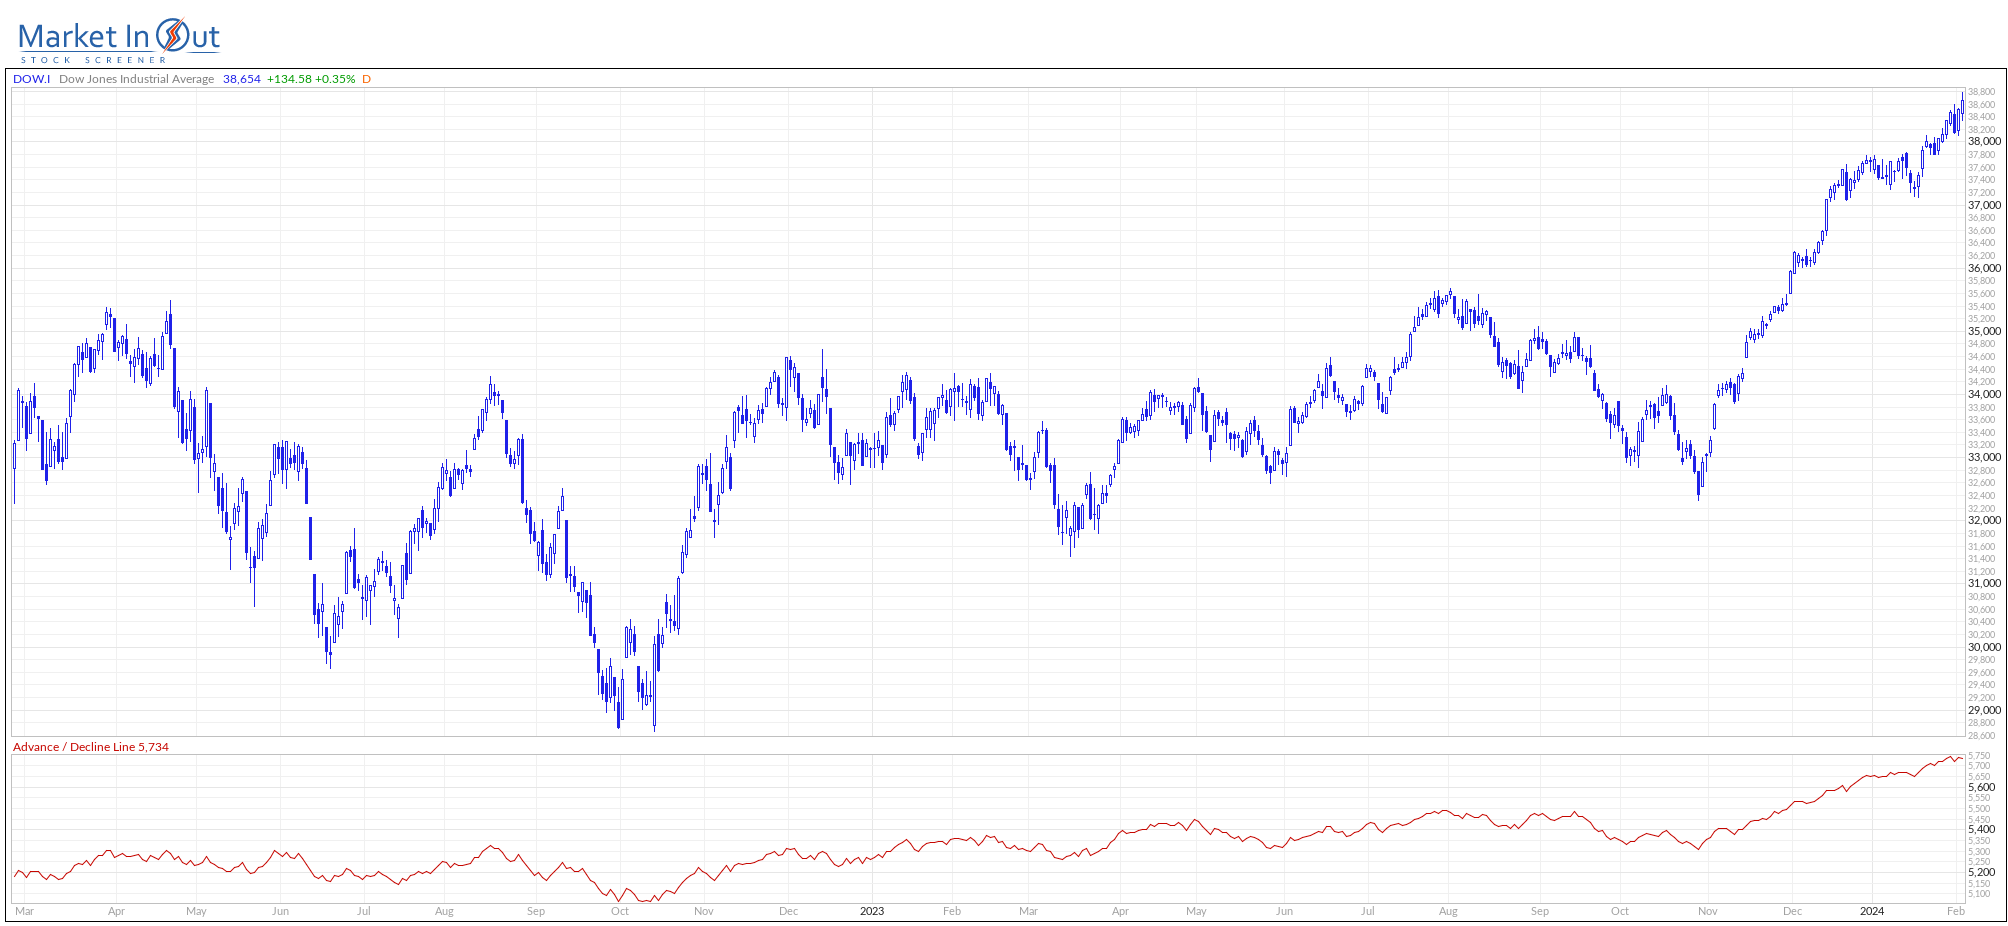
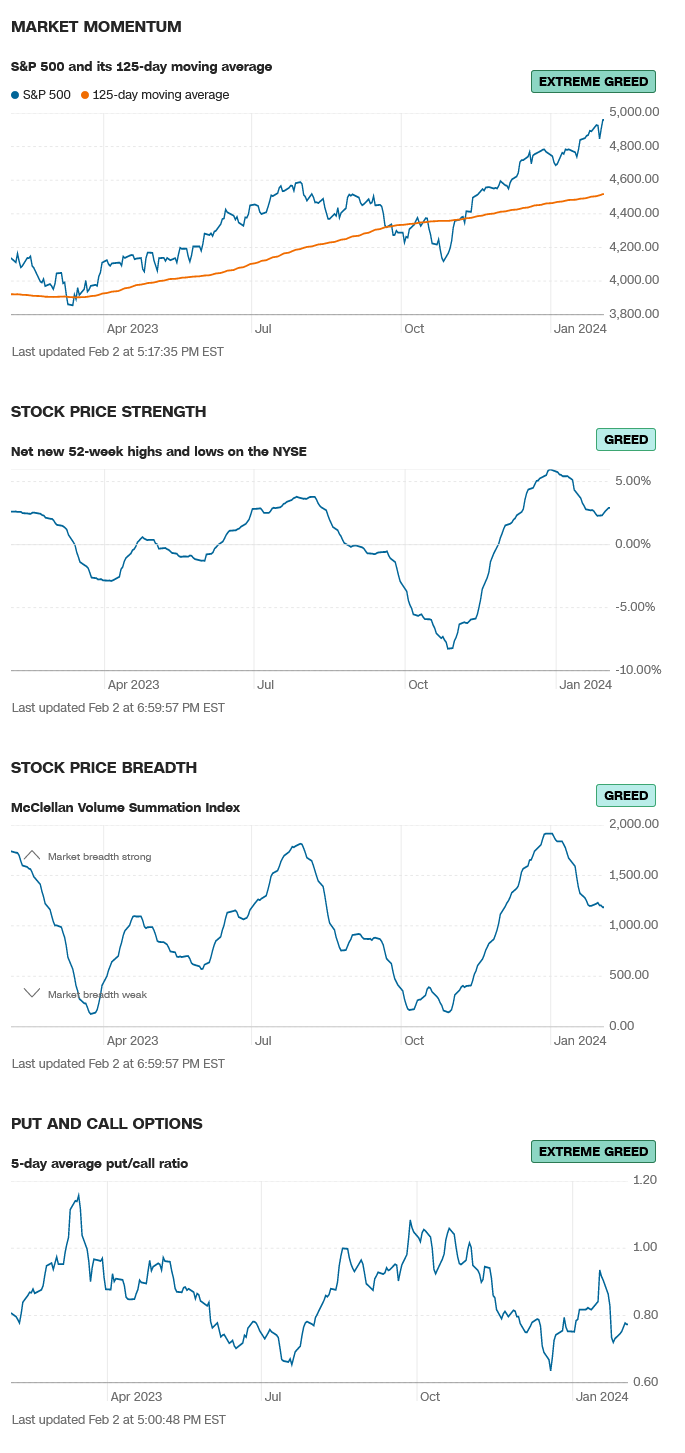
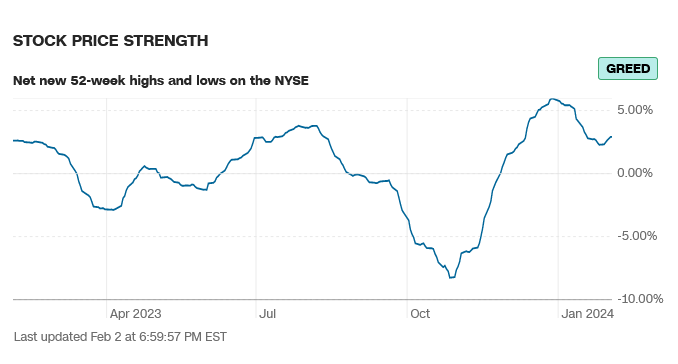
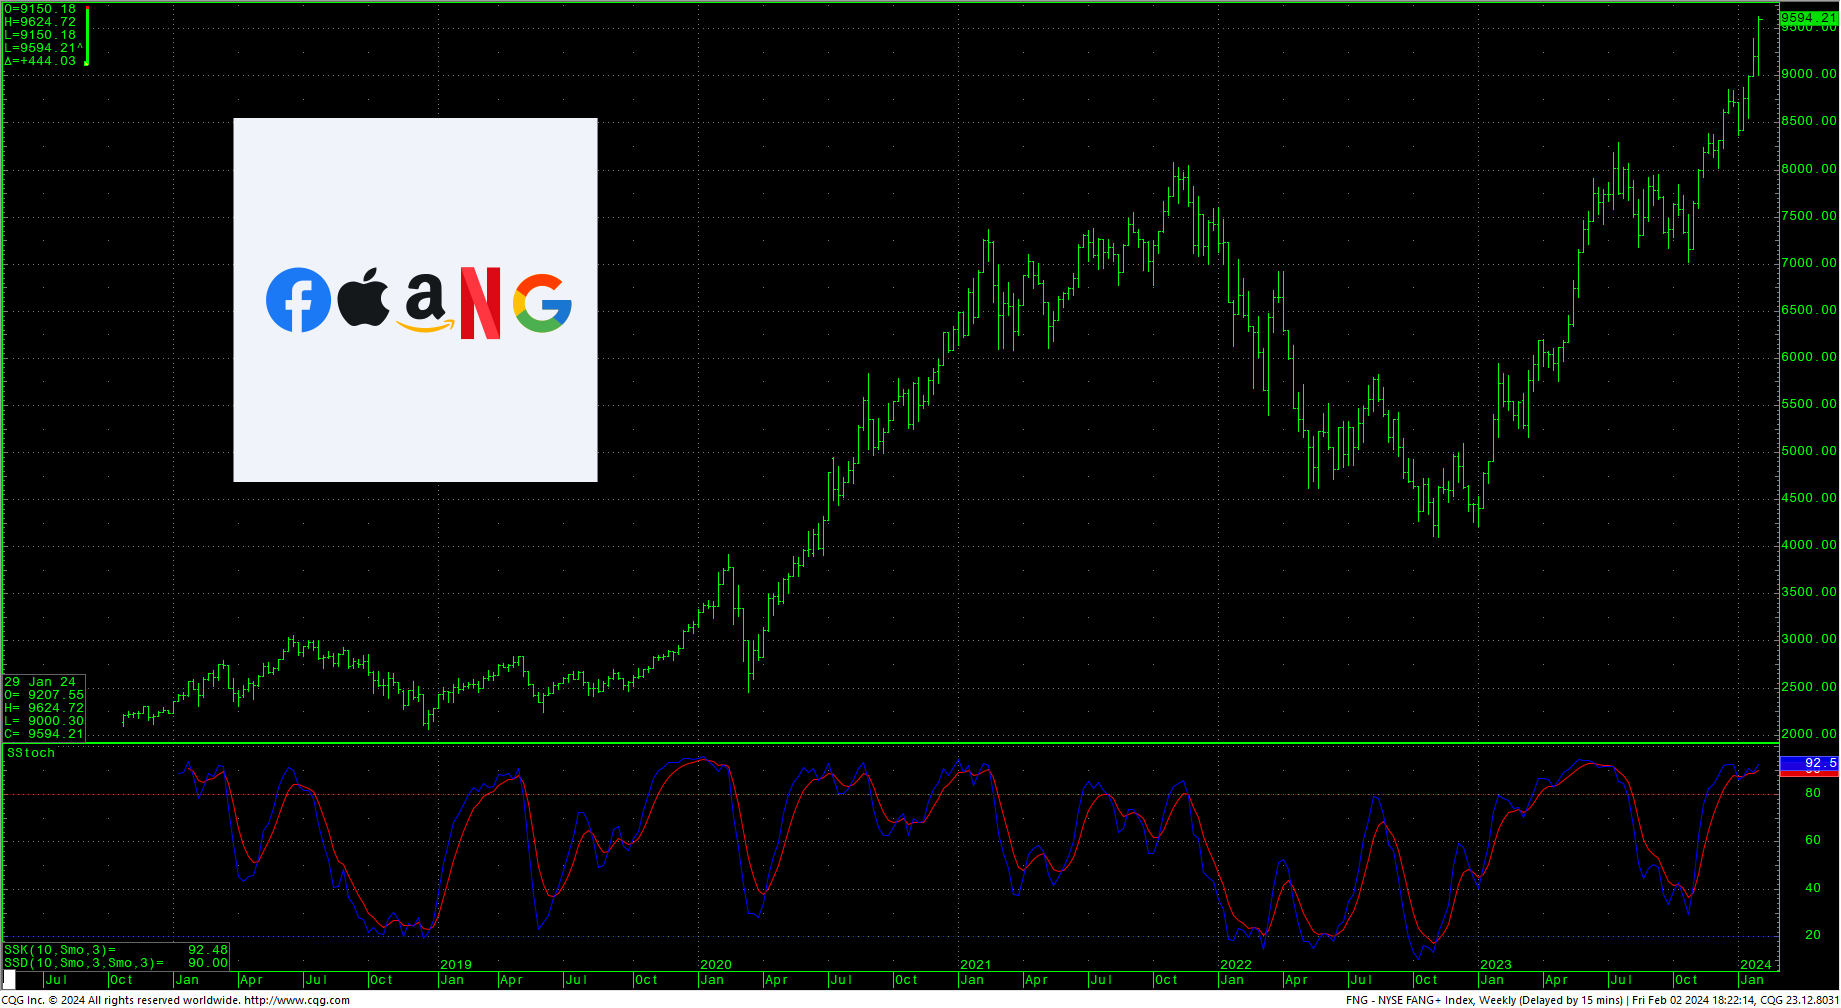
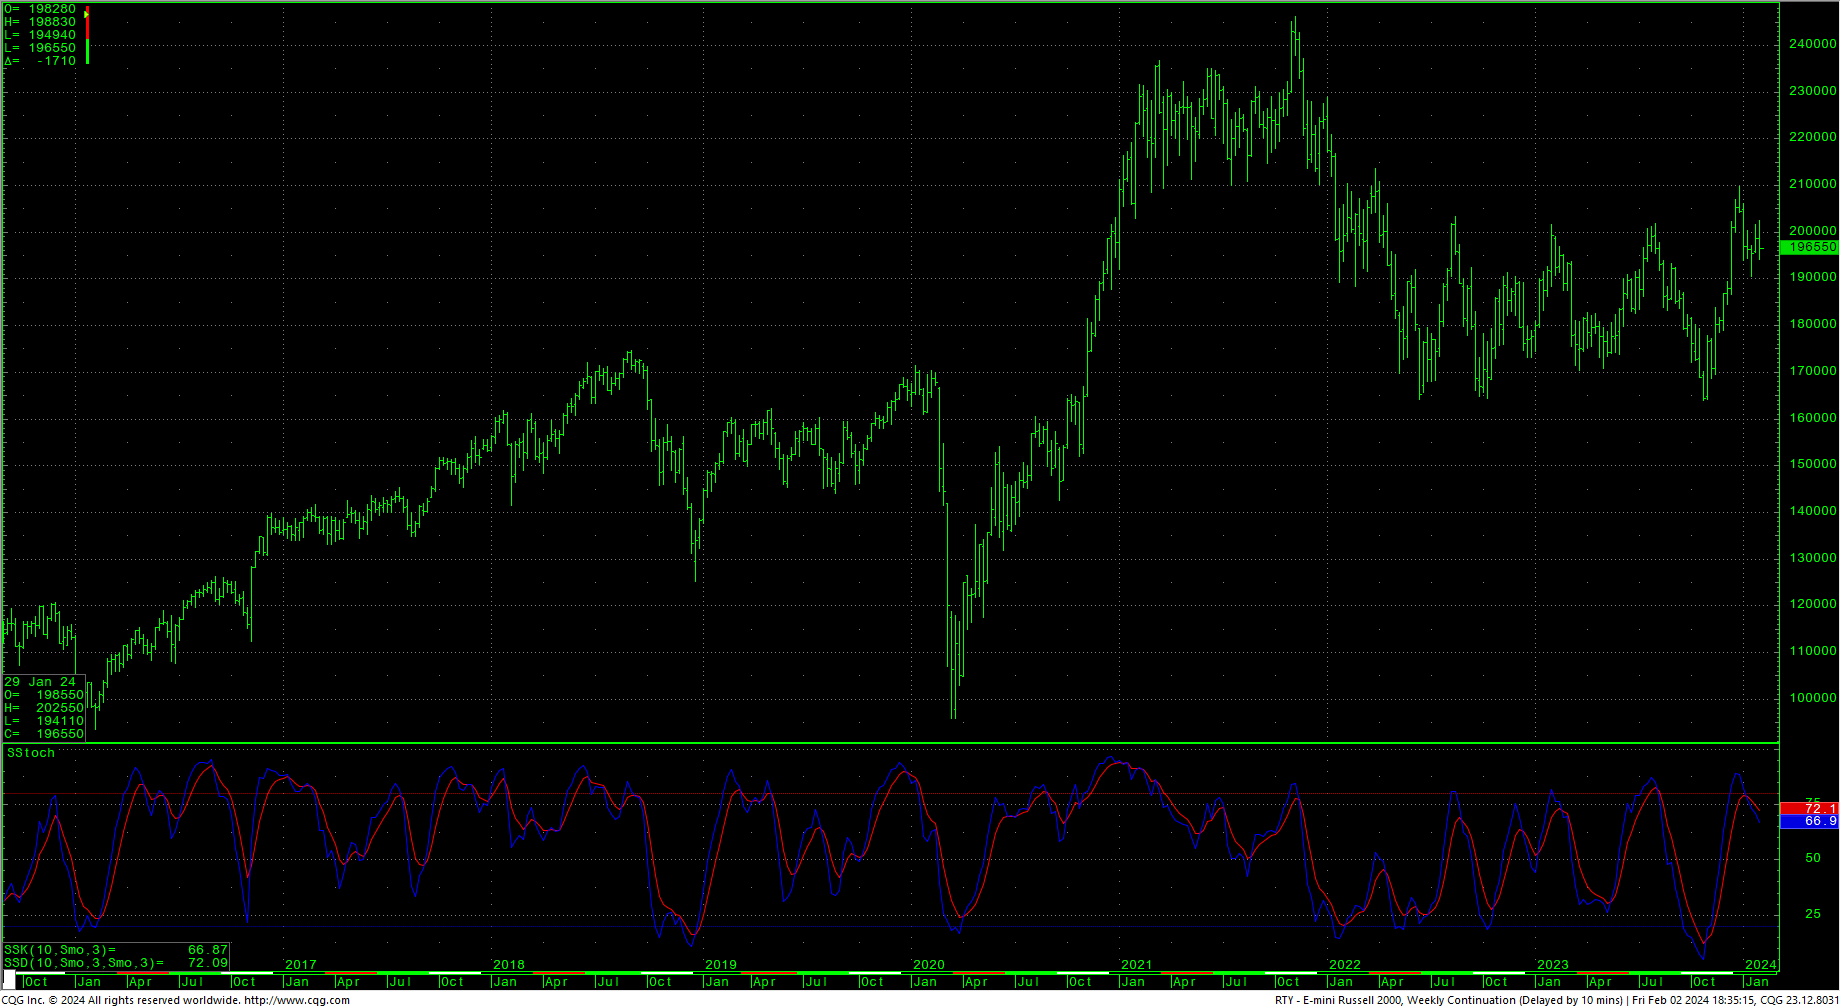
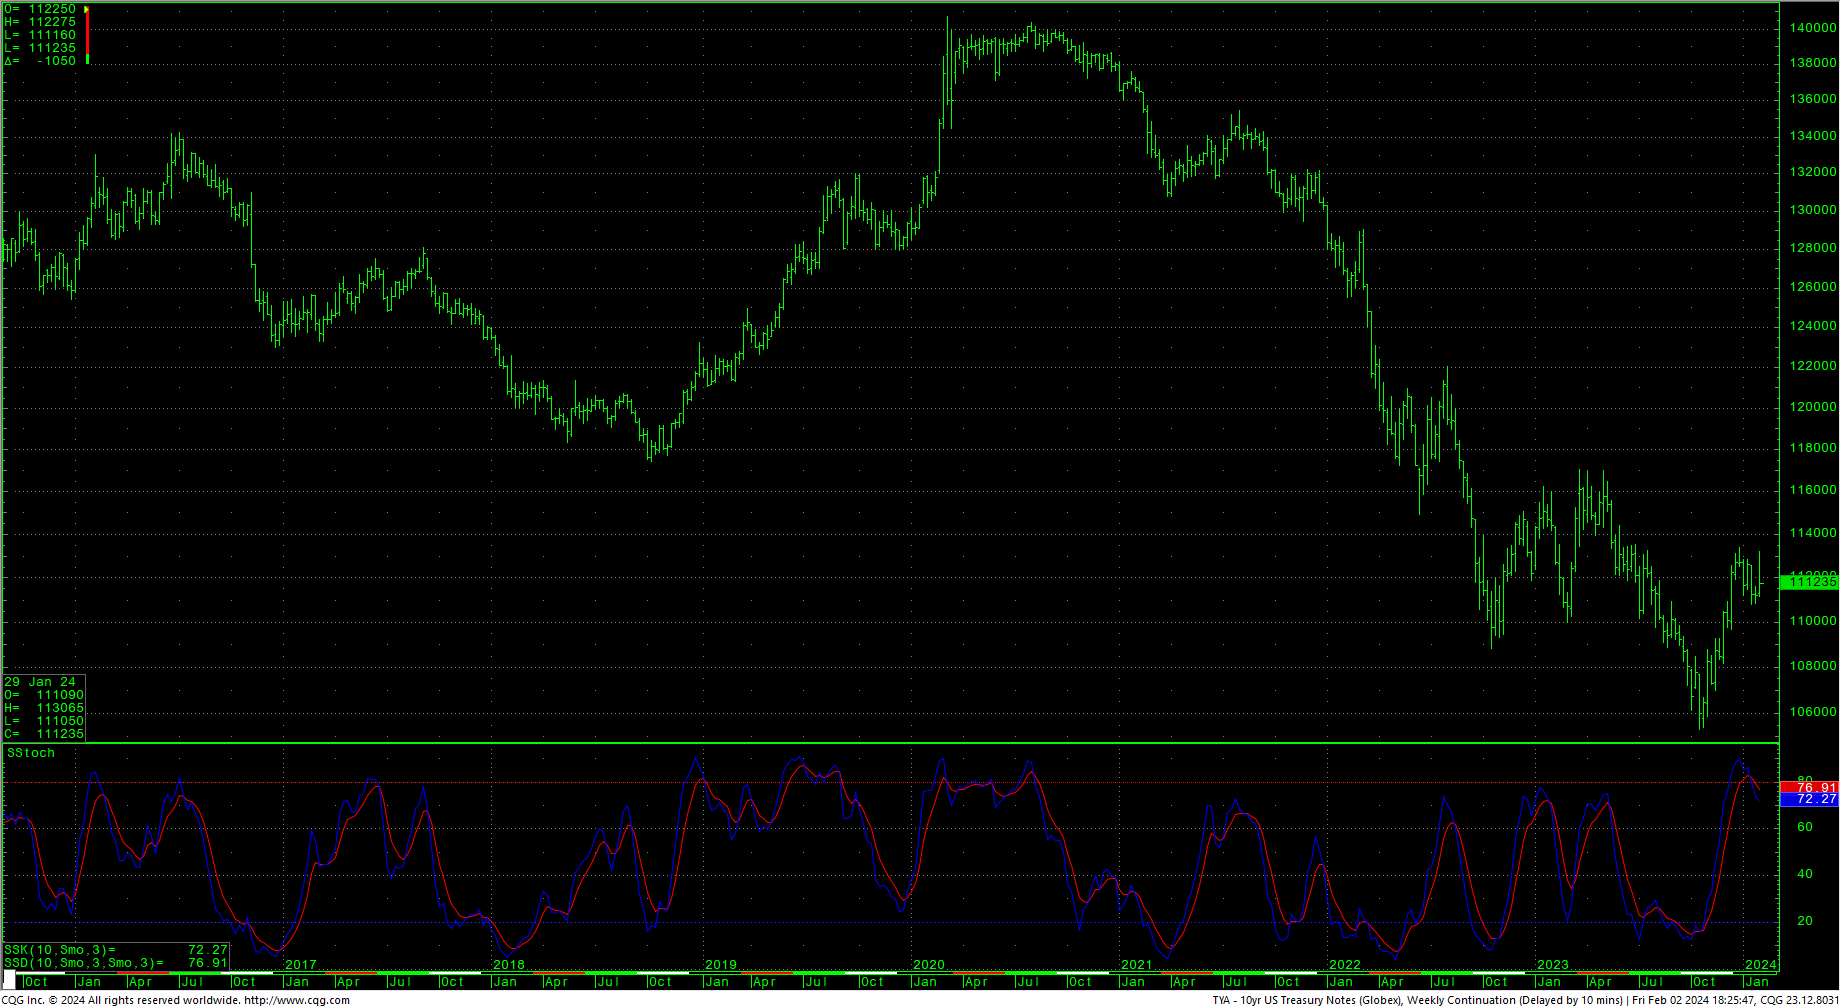
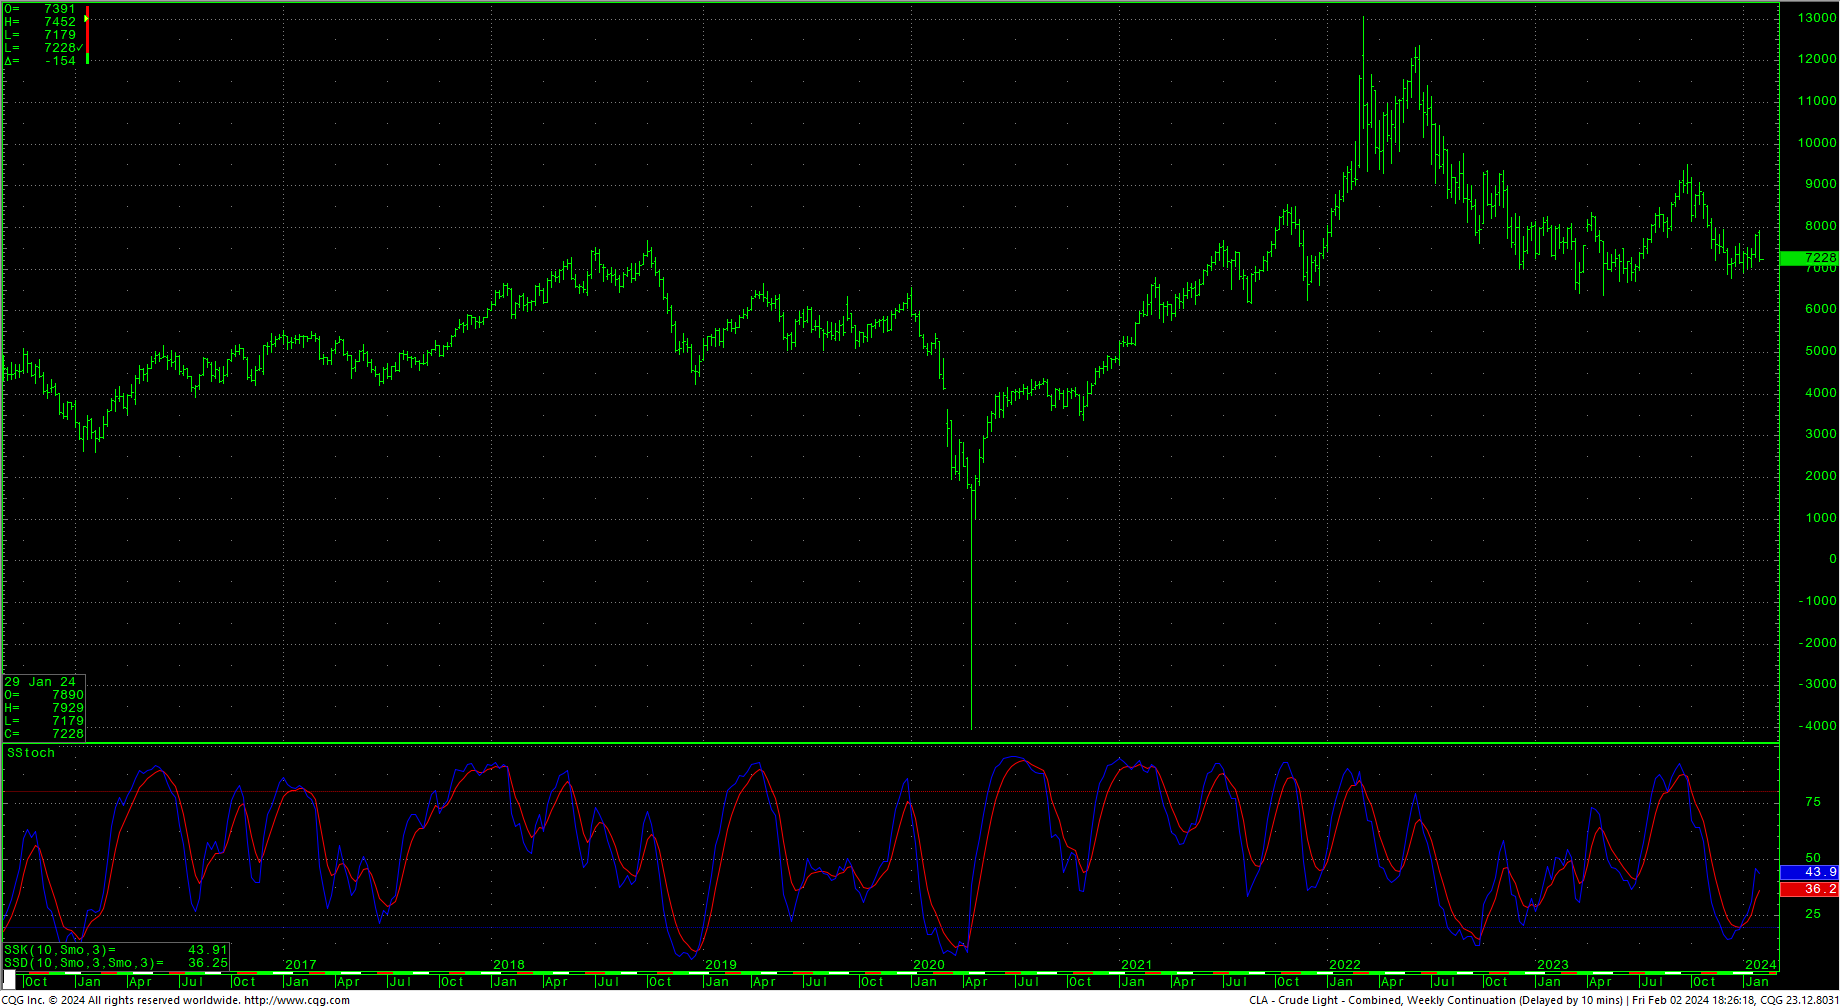
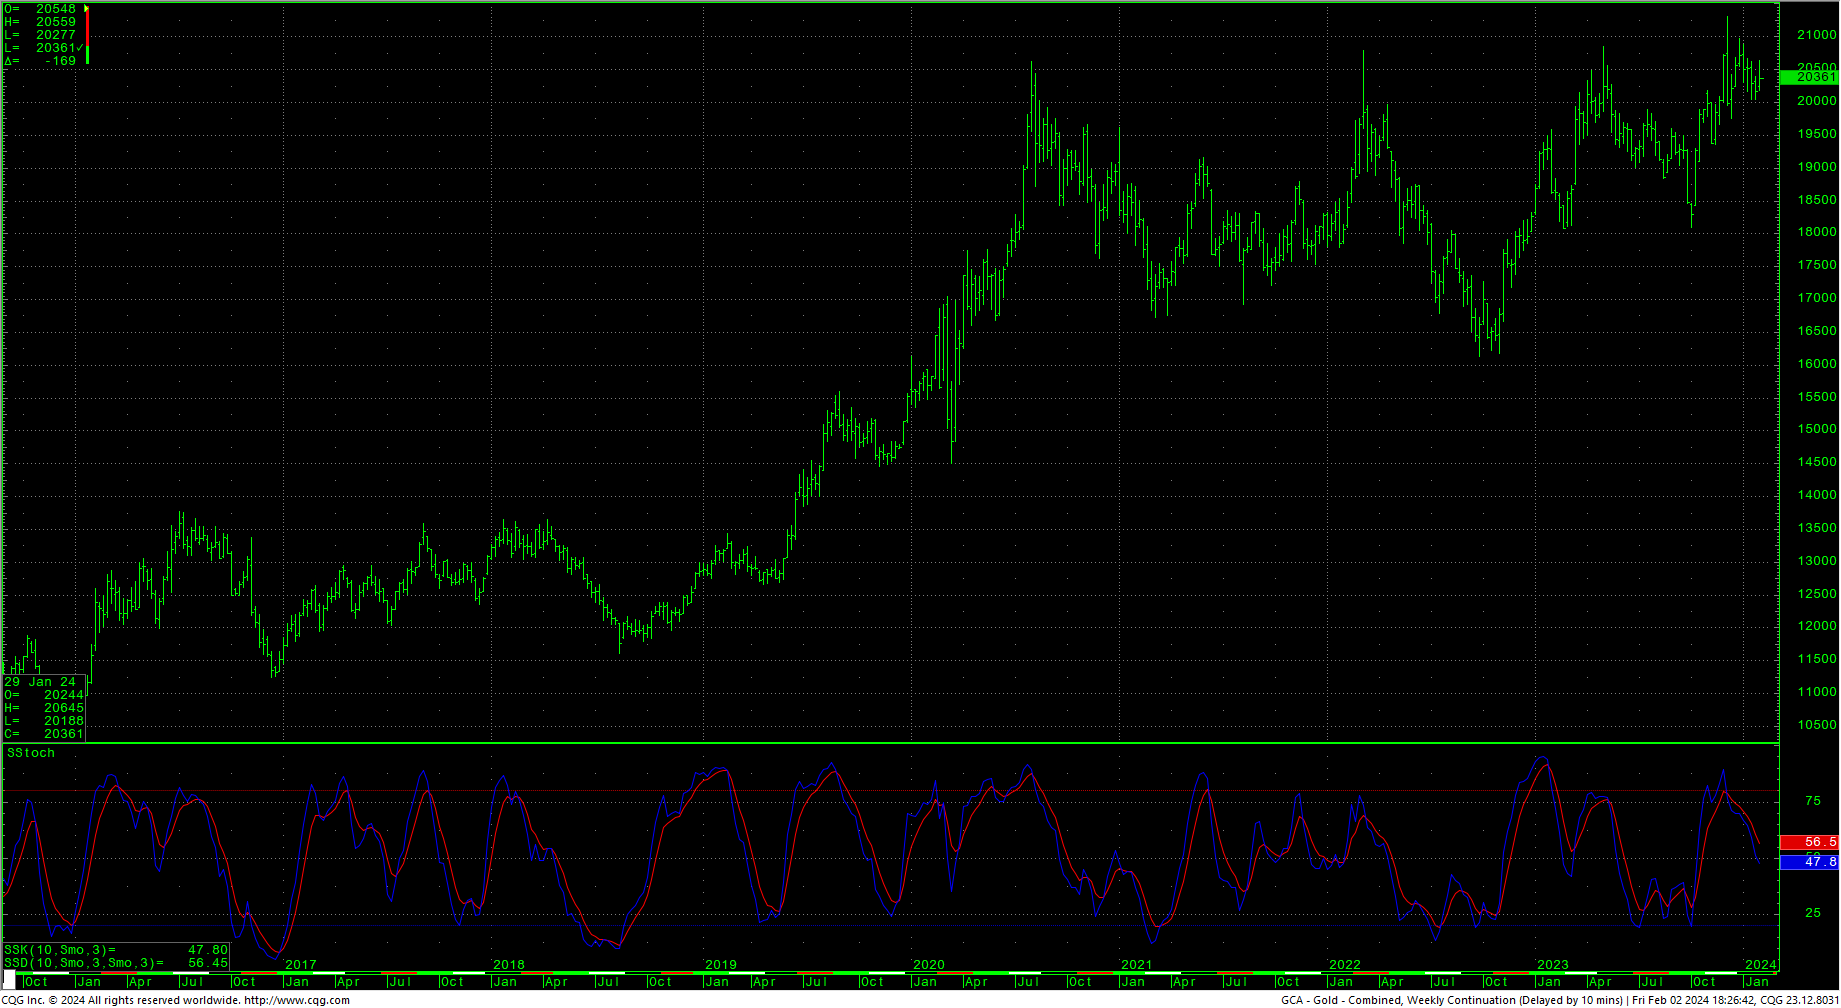
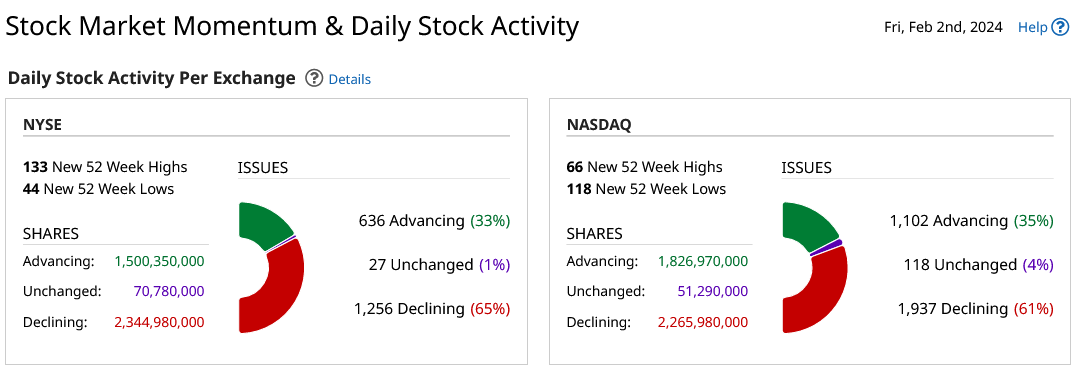 Sentiment indicators remain in greed/extreme greed readings and continued to flatten out last week. Last week in the AAII Sentiment Survey, Optimism Skyrockets While Neutral Sentiment Decreases. The Dow A/D line sits at 5734, a record high. The VIX closed marginally higher, in the bottom half of the weekly range. The Put/Call ratio moved to 0.77, reflecting extreme greed. The 52-week, A/D moved up to +2.92% and still indicates greed. The Dow closed the week up +1.43%. The S&P was up +1.38%. The Nasdaq ended the week up +1.12%, the FANG exploded higher into record highs, up +4.20% and the Russell fell behind everything, registering a loss of -0.79%. The 10-year notes ended the week higher but in the bottom of the weekly range with a sharp selloff on Friday. For S&R numbers, see the most recent Special Report. The CRB was down sharply -2.03%…as crude oil staged an outside week down and closed on the bottom of the week’s range. Gold closed higher but in the bottom half of the weekly range. The CoT moved very little with short-term trends staying the same as buying is coming from asset managers and commercials, dealers liquidation suspended as they also bought the past two weeks. Speculators are neutral.
Timing Points
Critical timing falls Wednesday/Thursday and could see increased volatility. Wednesday sees the US Trade Deficit and a spate of Fed heads speaking.
- 02/07-08 *** X Critical (Bonds/Dollar)
- 02/13 ***
- 02/21-22 *** X possible extreme
- 02/28 **
- 03/04 ** (bonds)
CNN Fear & Greed Index
 AAII Investor Sentiment Survey
 Dow Jones Industrial Average Hourly HLC
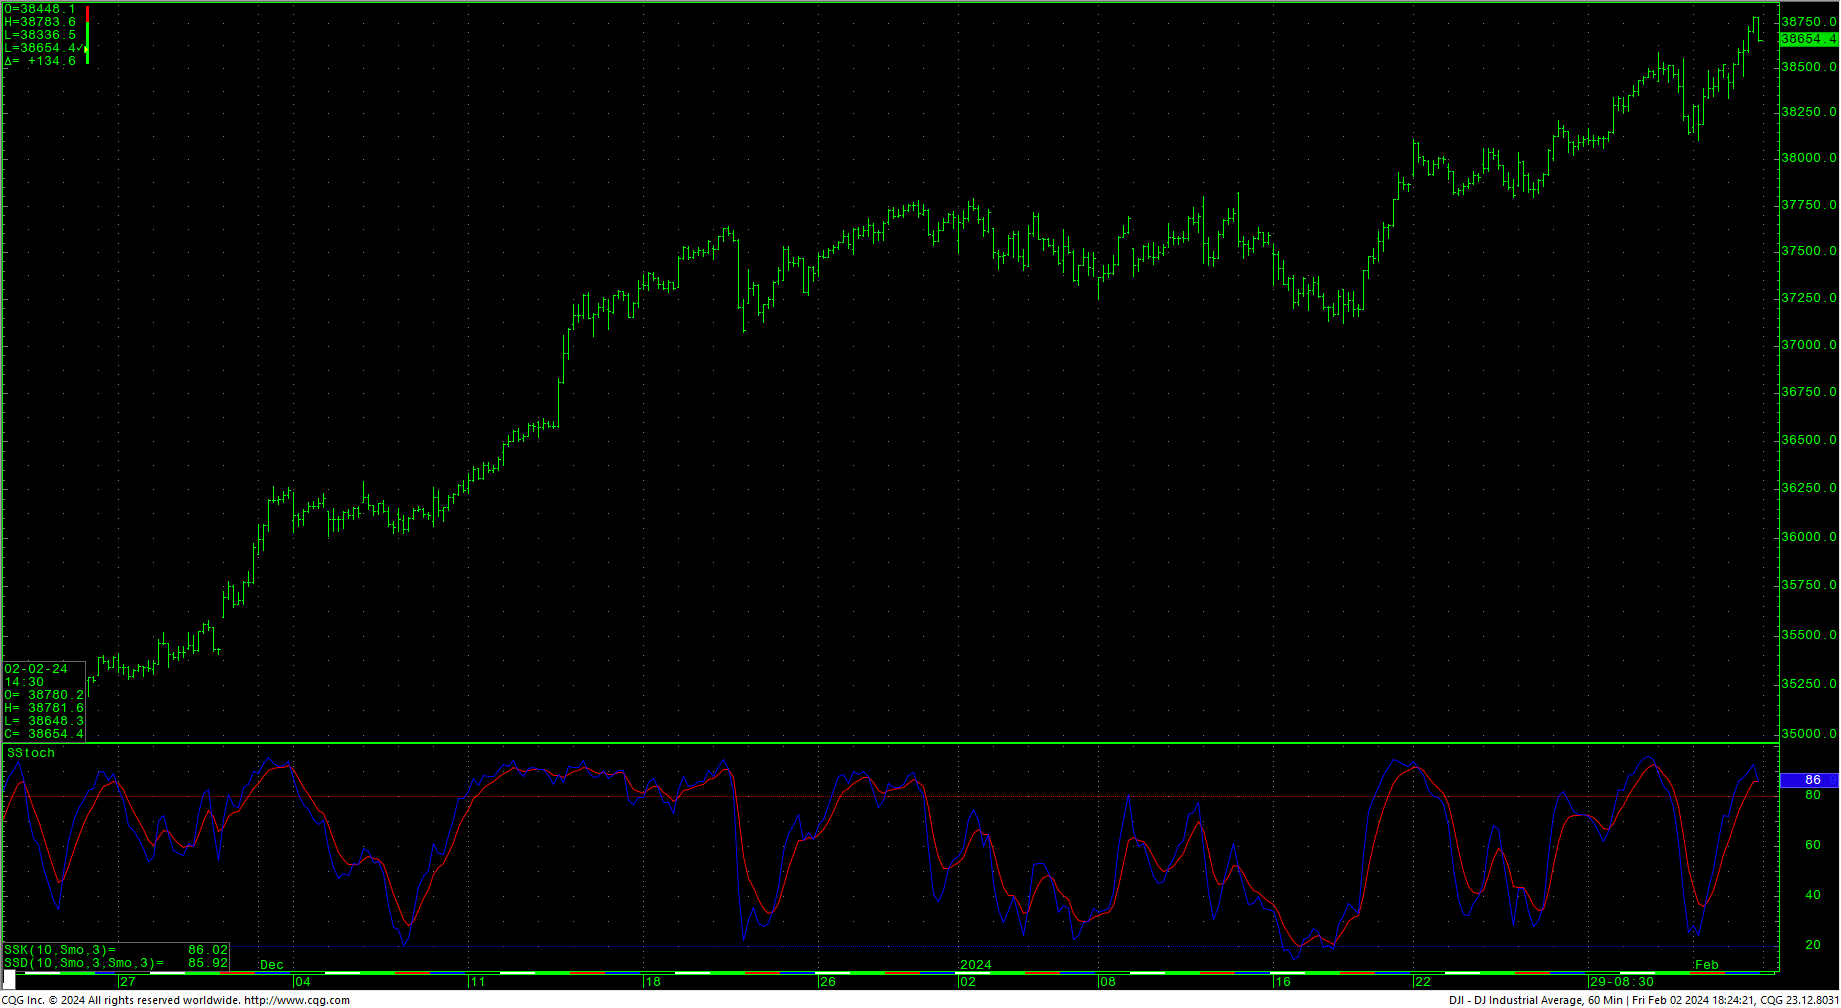 The Dow hourly sold off late Friday as it reached overbought territory. Near-term, the close over the first objectives 38378.5/38454.7 should be considered friendly. Resistance is pivotal at 38731/38734. A rally over 38734 should test the intraday highs at 38783. Closes over 38783 suggest a move to long-term targets at 39075. Closes over 39075 offer counts to targets at 40245.4 with longer-term potential to targets in the 45244 area. Above 45244 gives monthly counts to 47400.
Support is at 38391 and pivotal at 38149. A breakdown under 38149 can carry to 37953 with full counts to critical short-term support of 37757/37750. Closes under 37750 setup a move toward 37259 with counts to 36317/36310. A breakdown under 36310 opens counts to 35555. Closes under 35555 can carry toward critical short-term support of 34793/34785. Closes below 34785 open counts to 33722 with potential to 32527/32520.
Dow Jones Industrial Average Weekly HLC
Resistance
|
Support
|
S&P 500 Cash Index
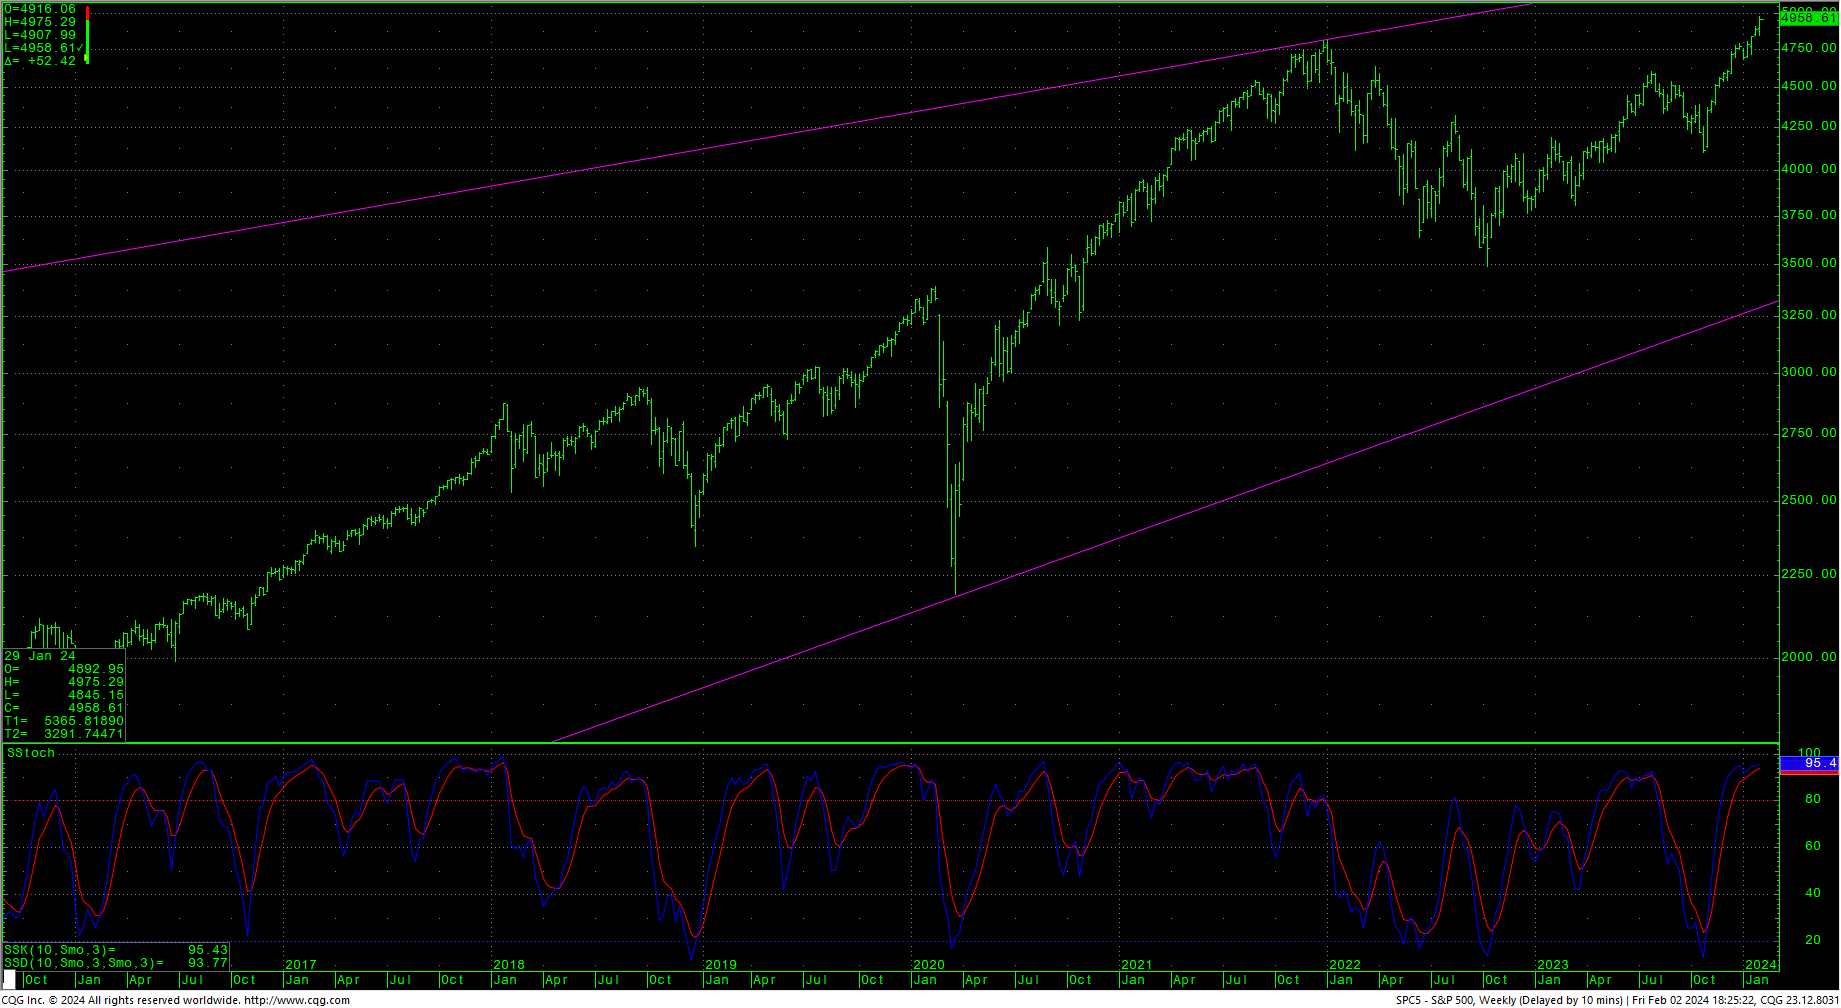
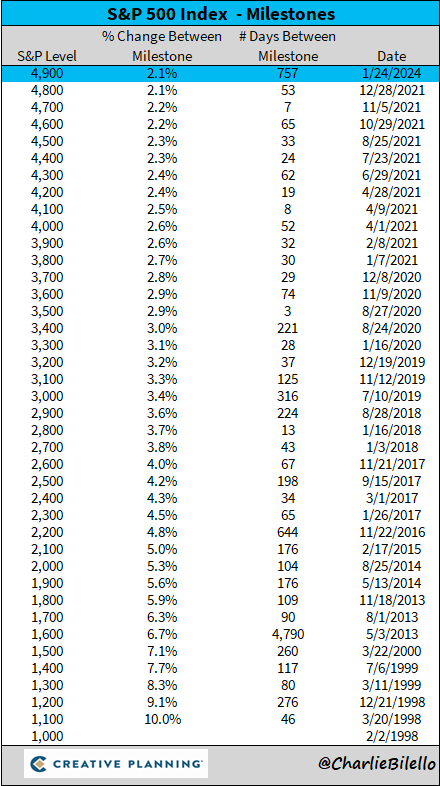
The S&P hourly is reaching overbought conditions and prices sold off late in Friday’s trade. Prices met and closed just over a key area at 4952. Continued rallies with closes over this area set up potential upside targets in the 5144 area. Closes over 5144 set up a drive to 5288 with counts to 5432. A breakout over 5432 will open potential to the 5720 area. Closes over 5720 offer upside targets at 6000/6008. See this chart of S&P Milestones as the index reached key levels and the time in between from analyst Charlie Bilello.
SPY Weekly
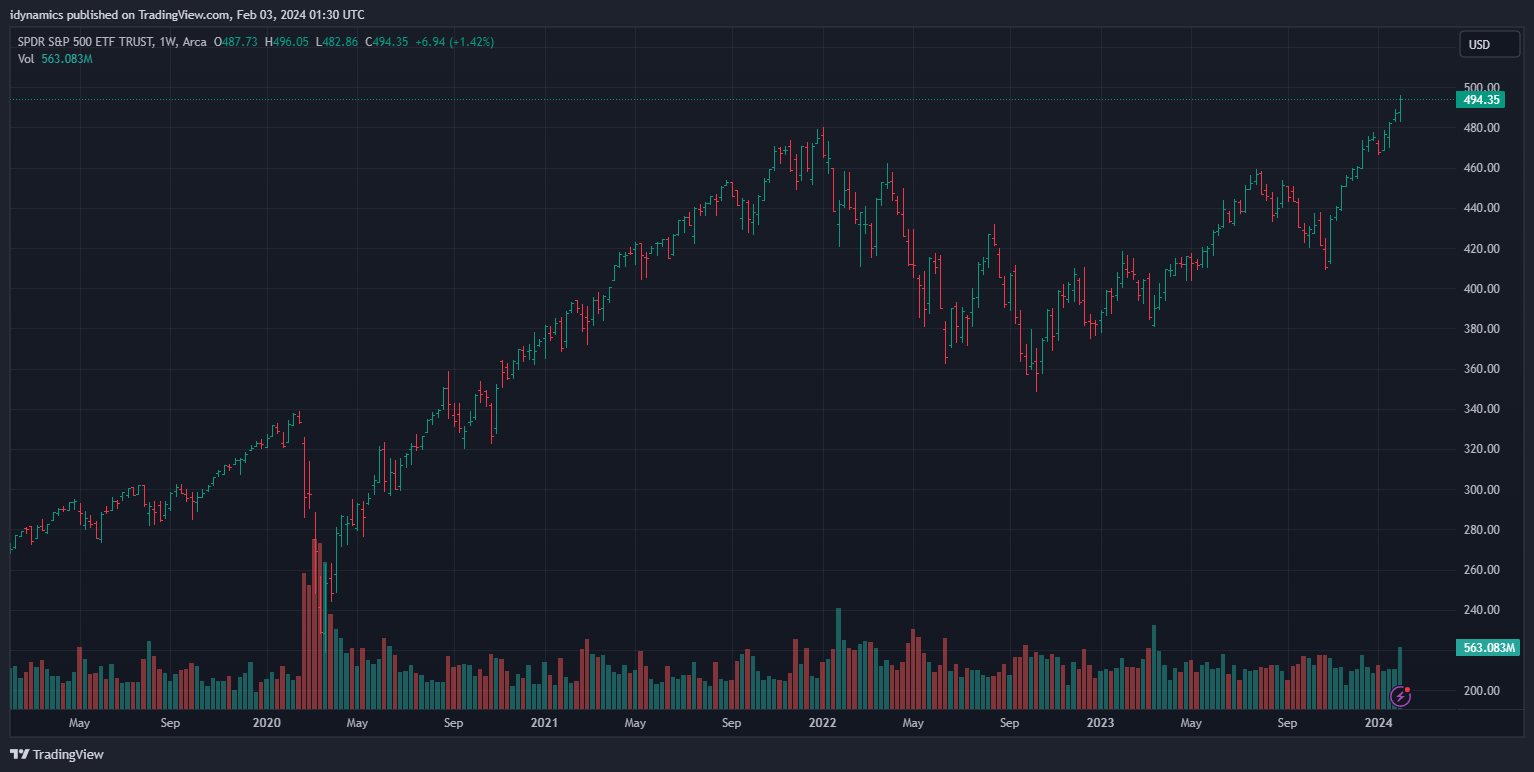 Support is at 4906 and 4863. A breakdown with closes under 4863 sets up a move to 4828 with counts to 4794/4790. Closes under 4790 suggest 4751 and opens potential to 4681. A breakdown under 4681 should test 4625 with support of 4643. Daily closes under 4625 count toward 4539 with potential to critical short-term support of 4436/4430 through 4408. Daily closes under 4408 set up a move to 4103.
S&P 500 Index Weekly HLC
Resistance
|
Support
|


