
TECHNICAL ANALYSIS (by Intraday Dynamics)
Major Indices Week of February 16, 2024
 Nasdaq 100 NDQ Weekly
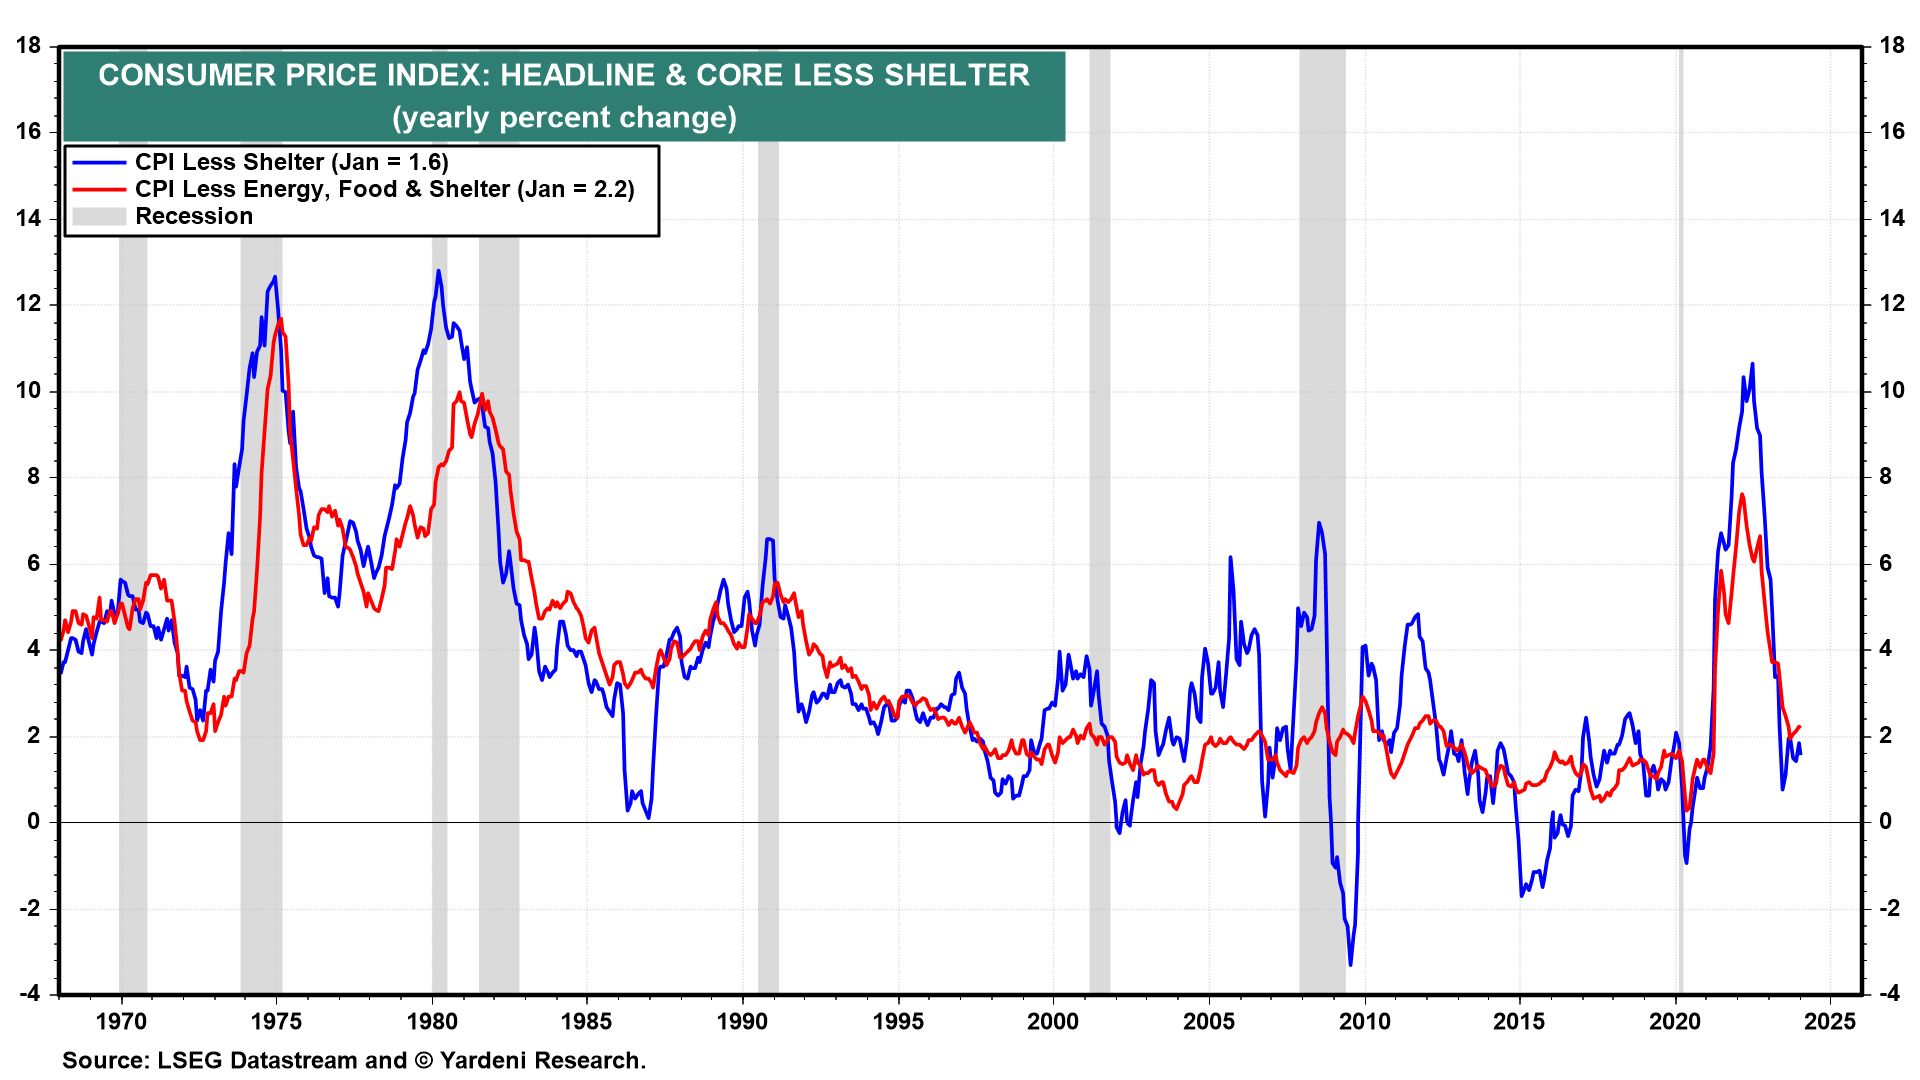
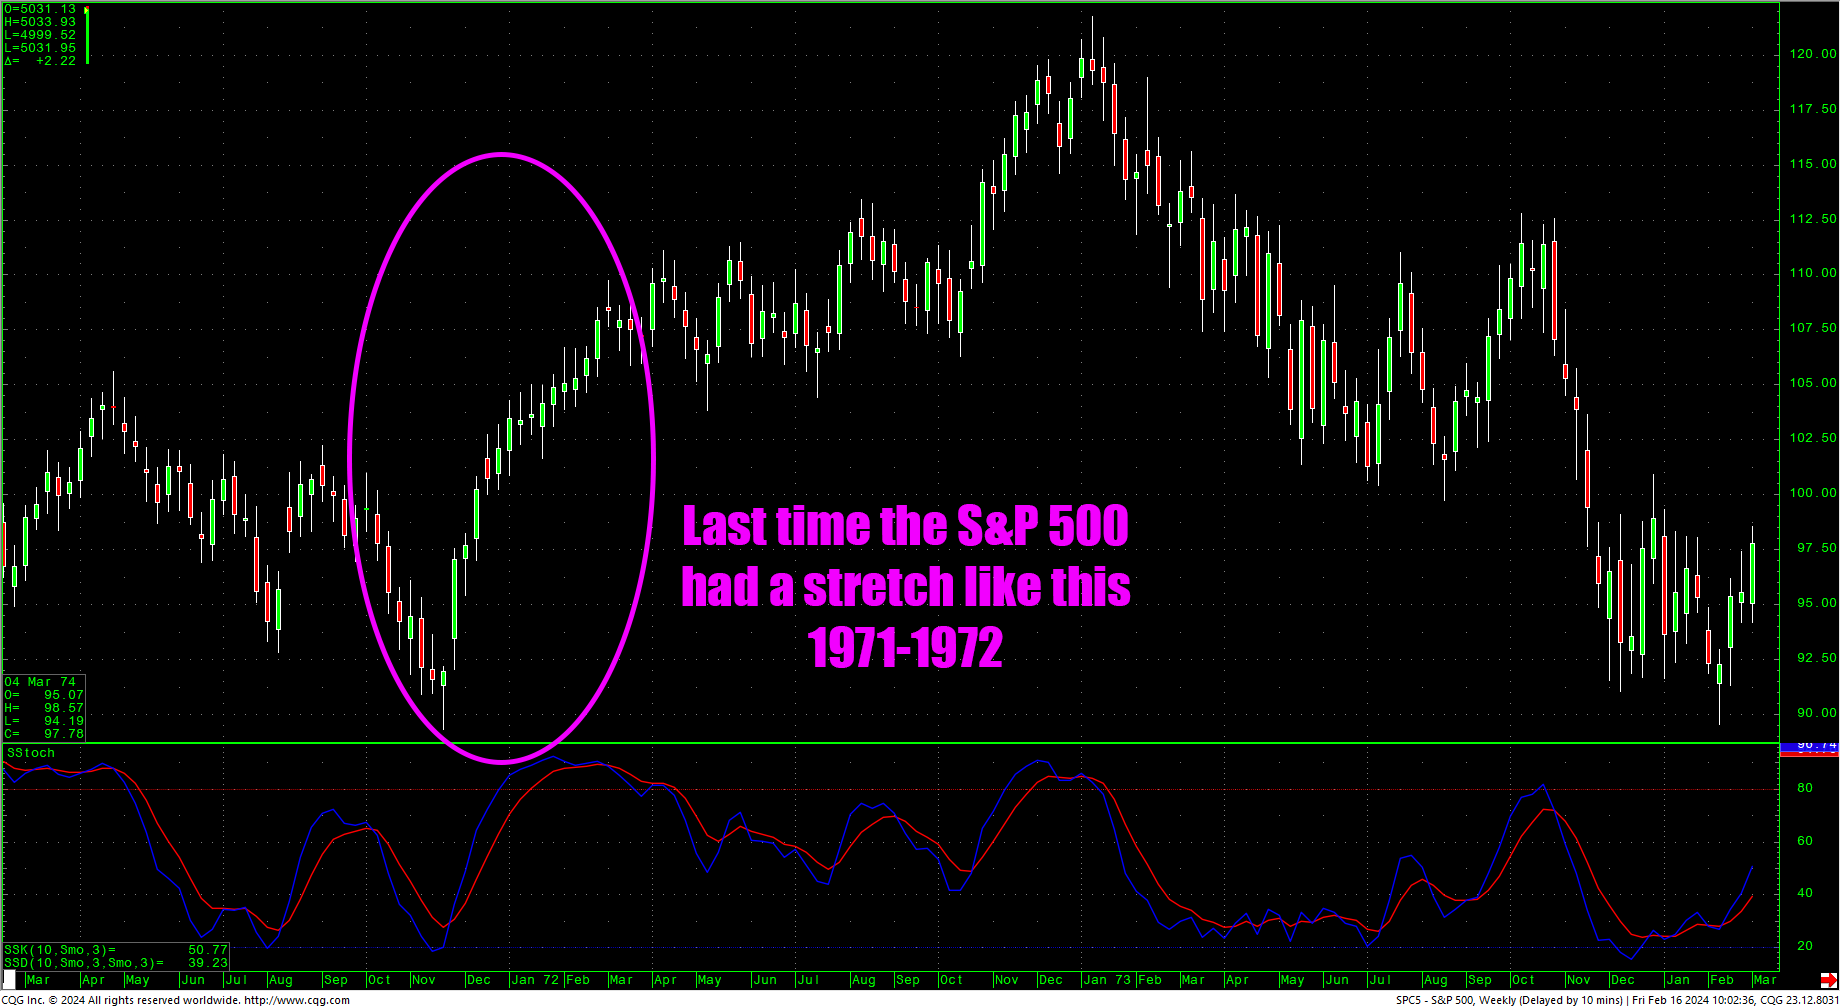
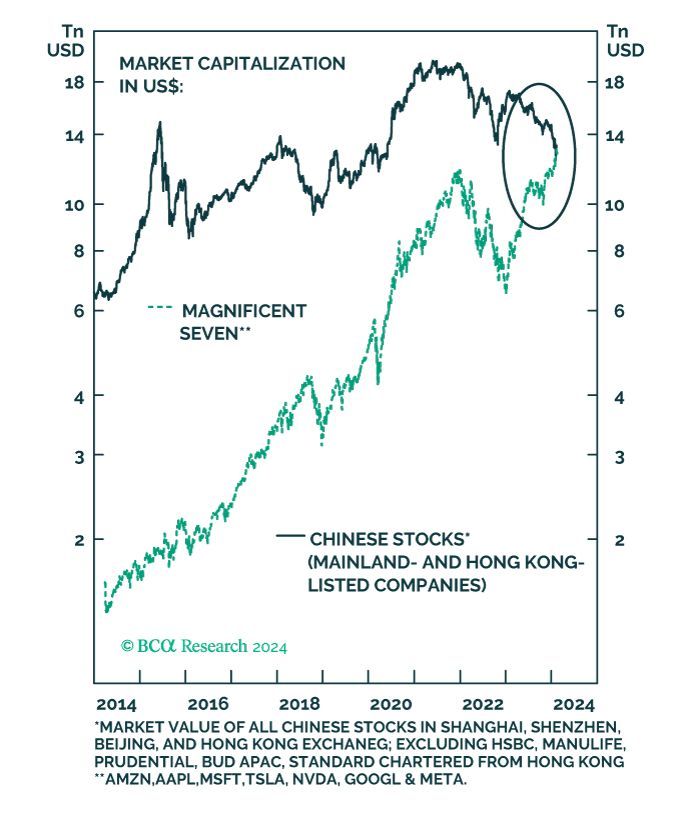
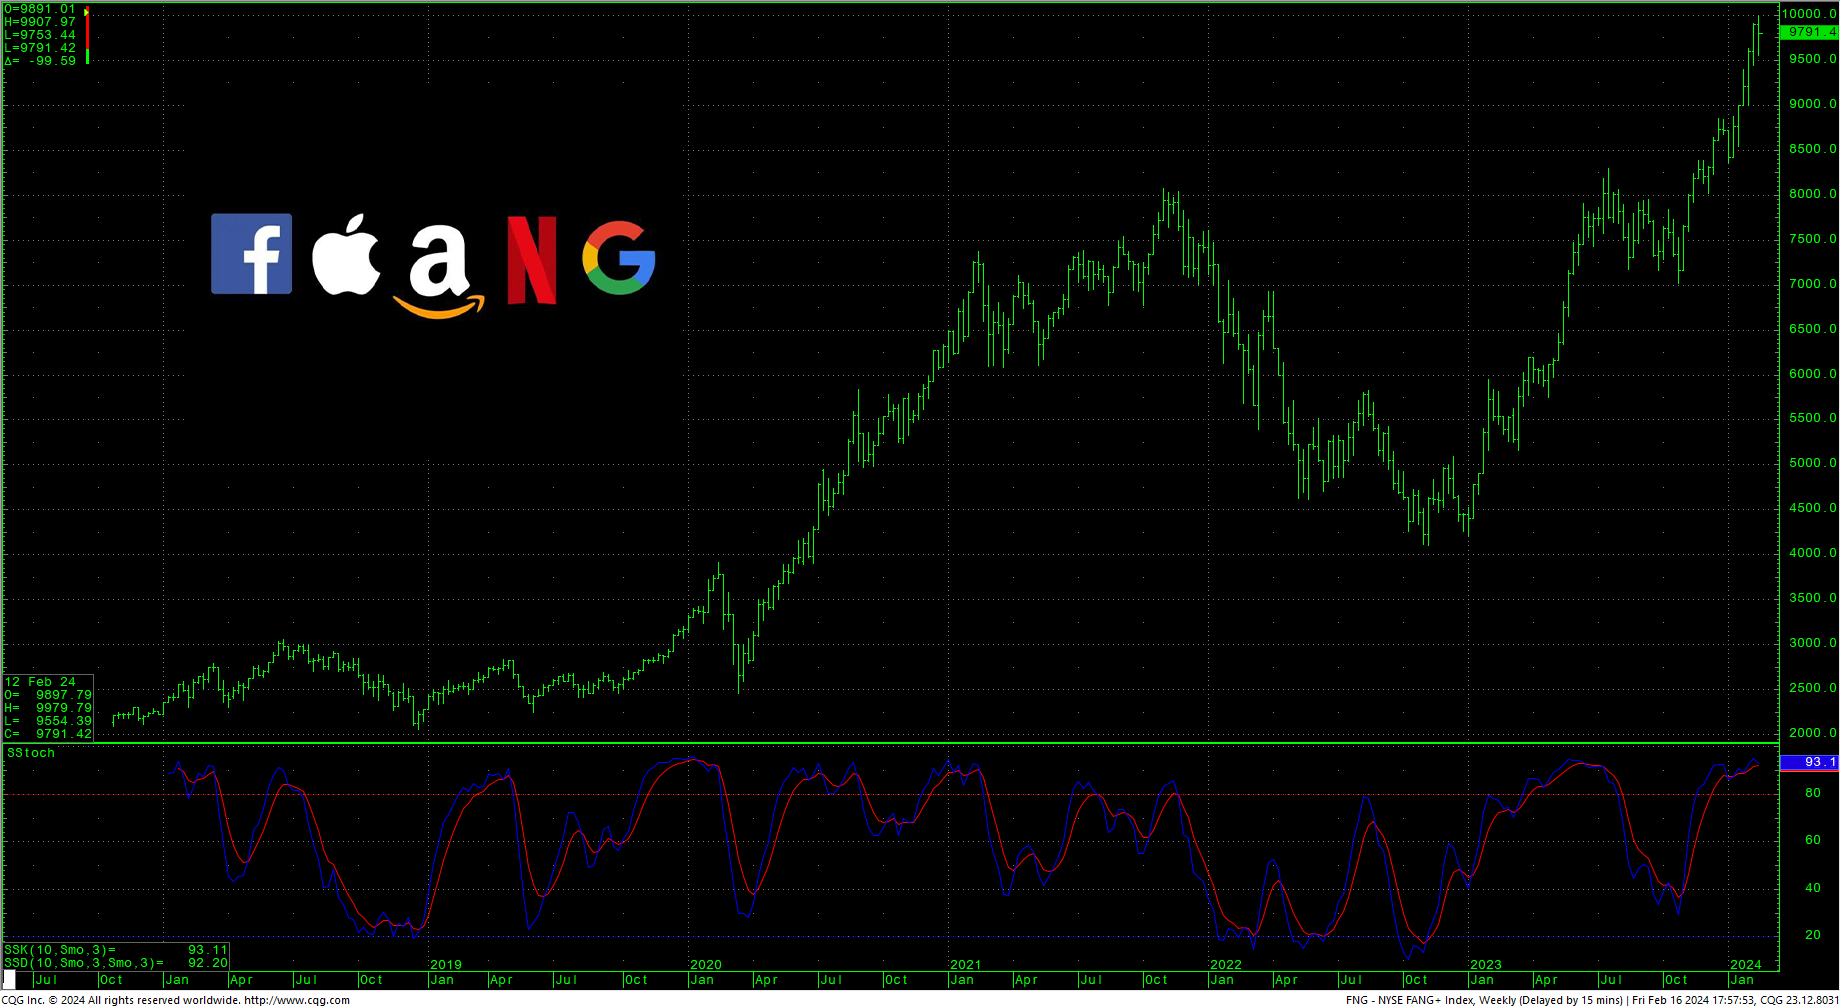
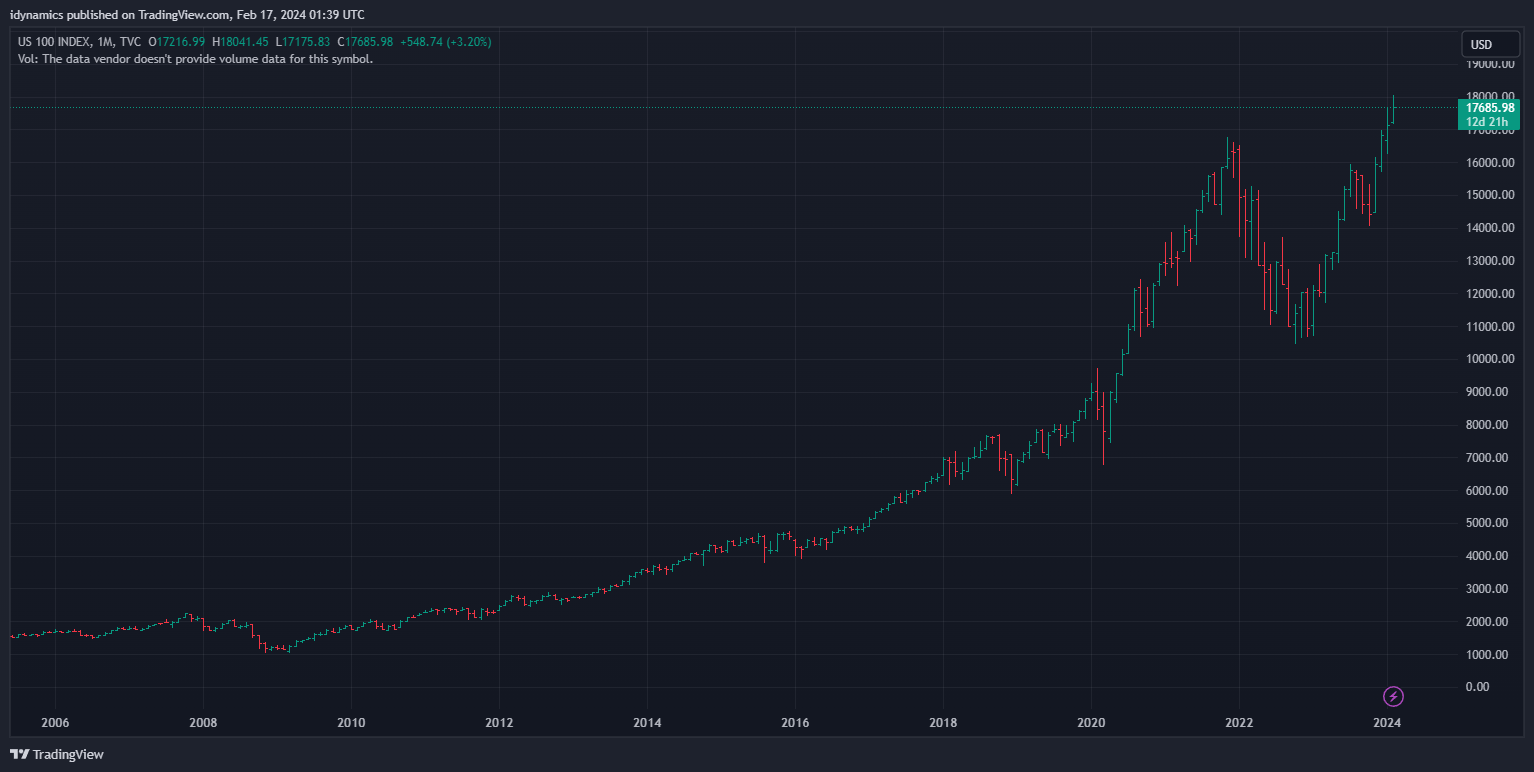 Stocks traded a volatile week with a 1-2 punch of the CPI and PPI readings coming in hotter than expected, even though the CPI minus shelter is under 2%. Only the secondary markets ended higher as the tech-centered and broad markets closed lower, breaking a five week up-streak. With the S&P ending the week lower, it ended the best sustained streak since late 1971 into early 1972…the best continued rally in 52 years. The FANG staged a reversal week after it traded above 10K, closing in the middle of the weekly range. The tech-heavy Magnificent Seven stocks are now valued more than all the markets in Mainland China and Hong Kong COMBINED.
Magnificent Seven
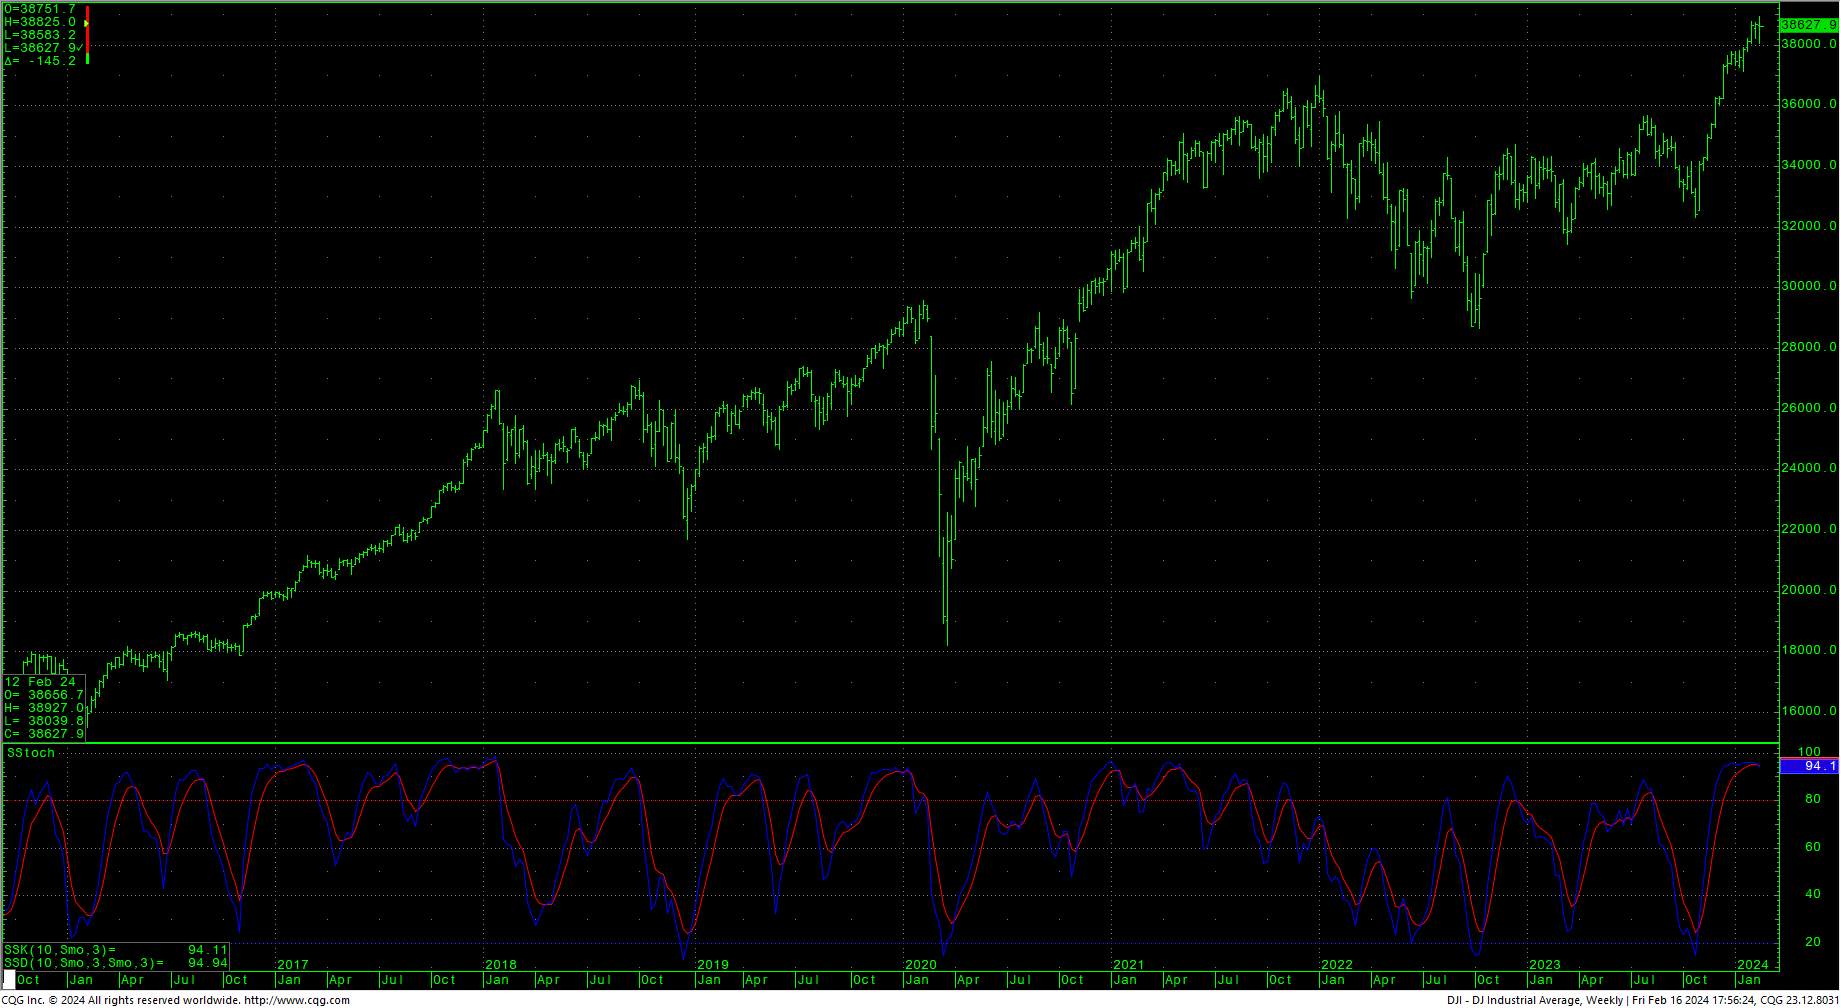
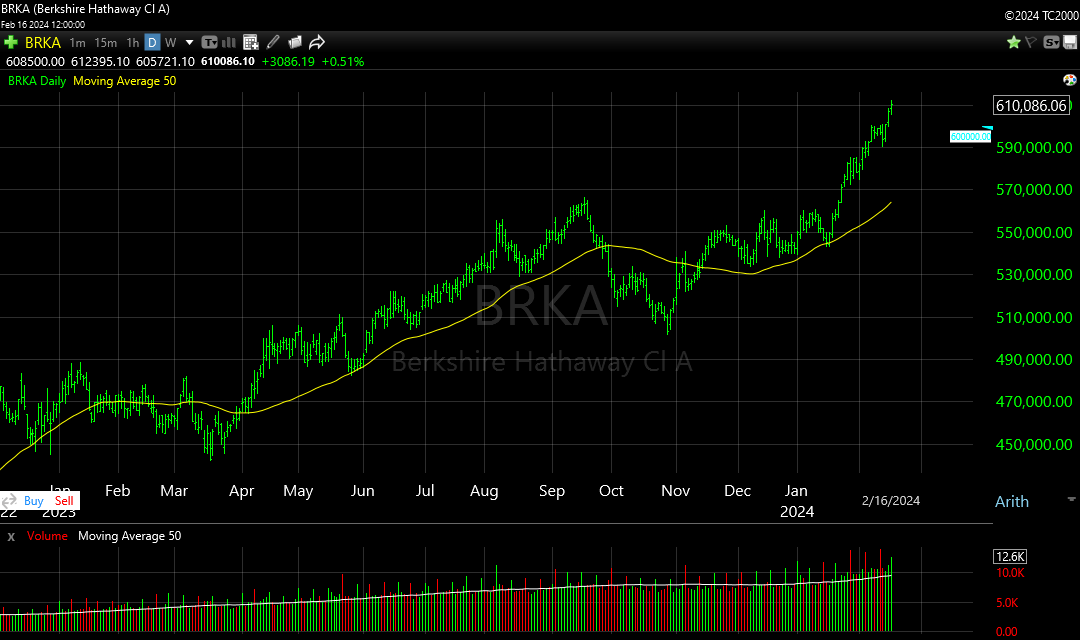
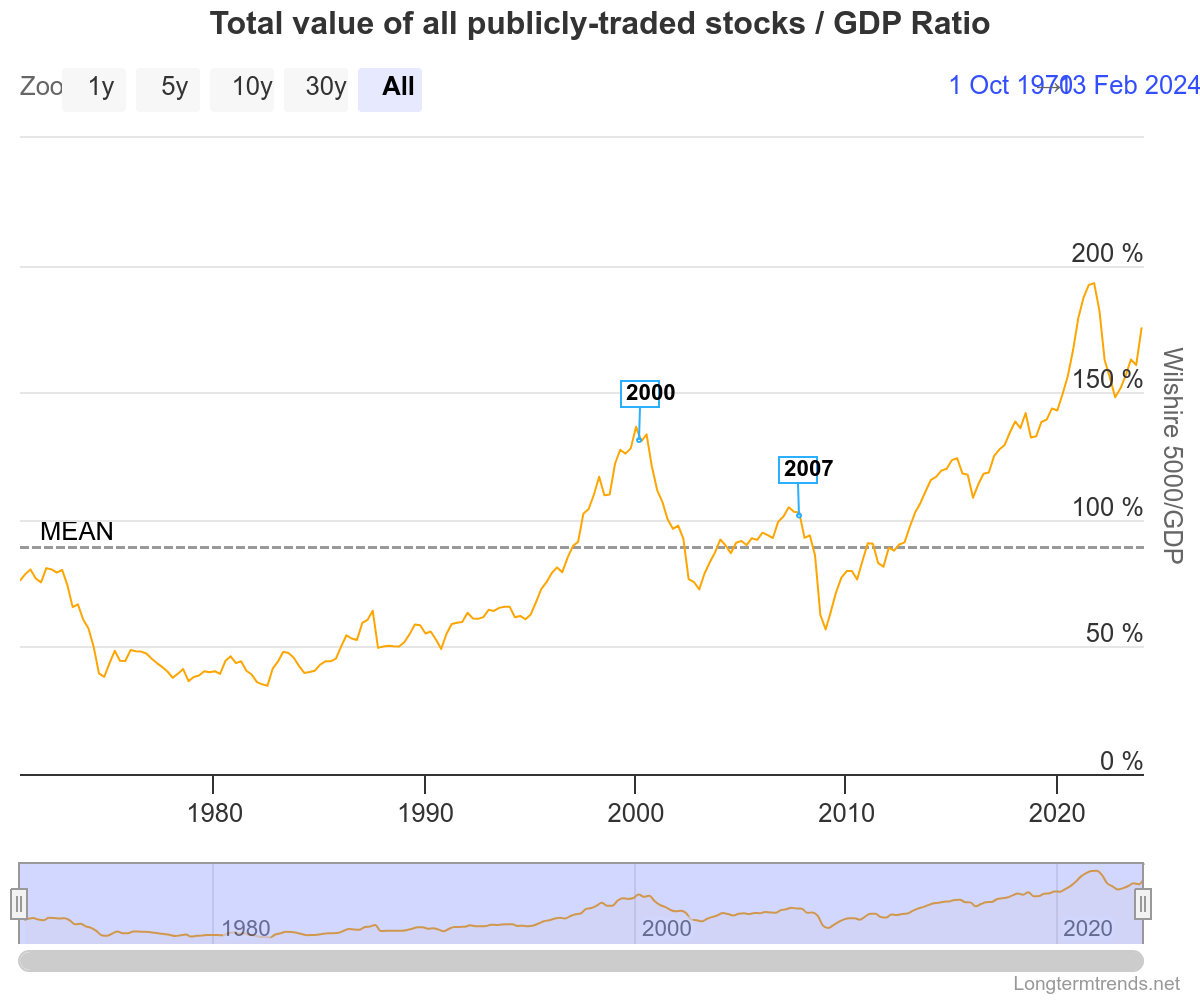
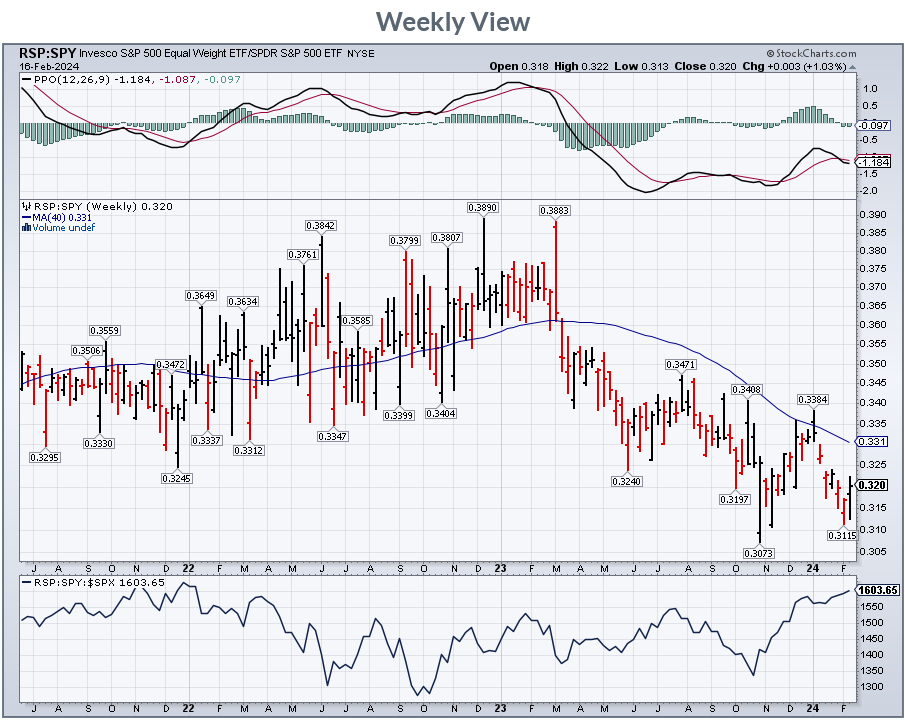
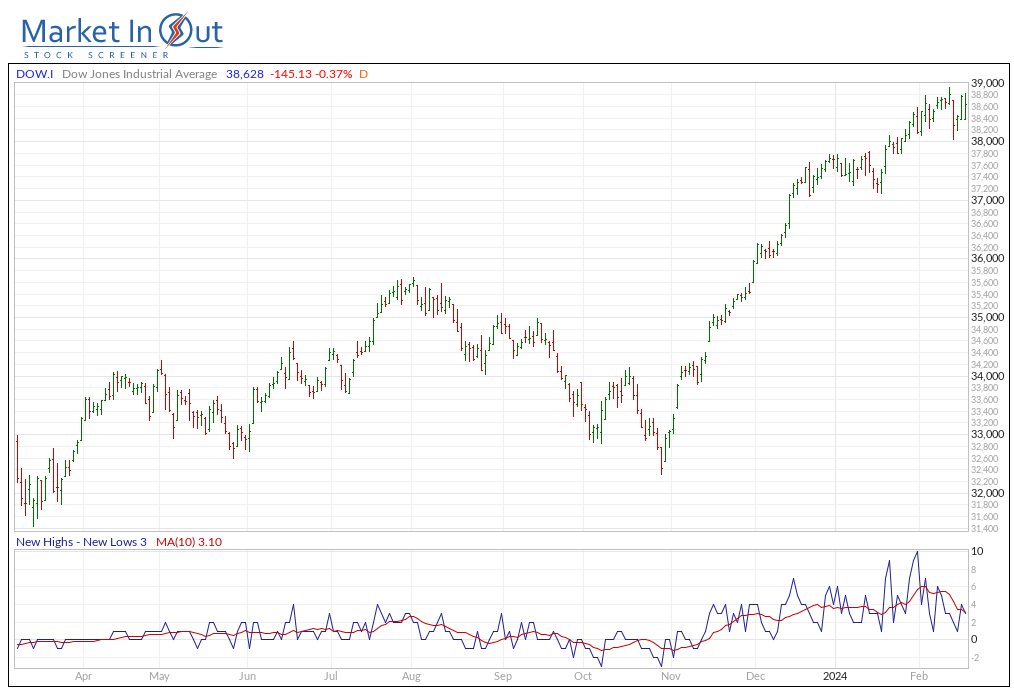
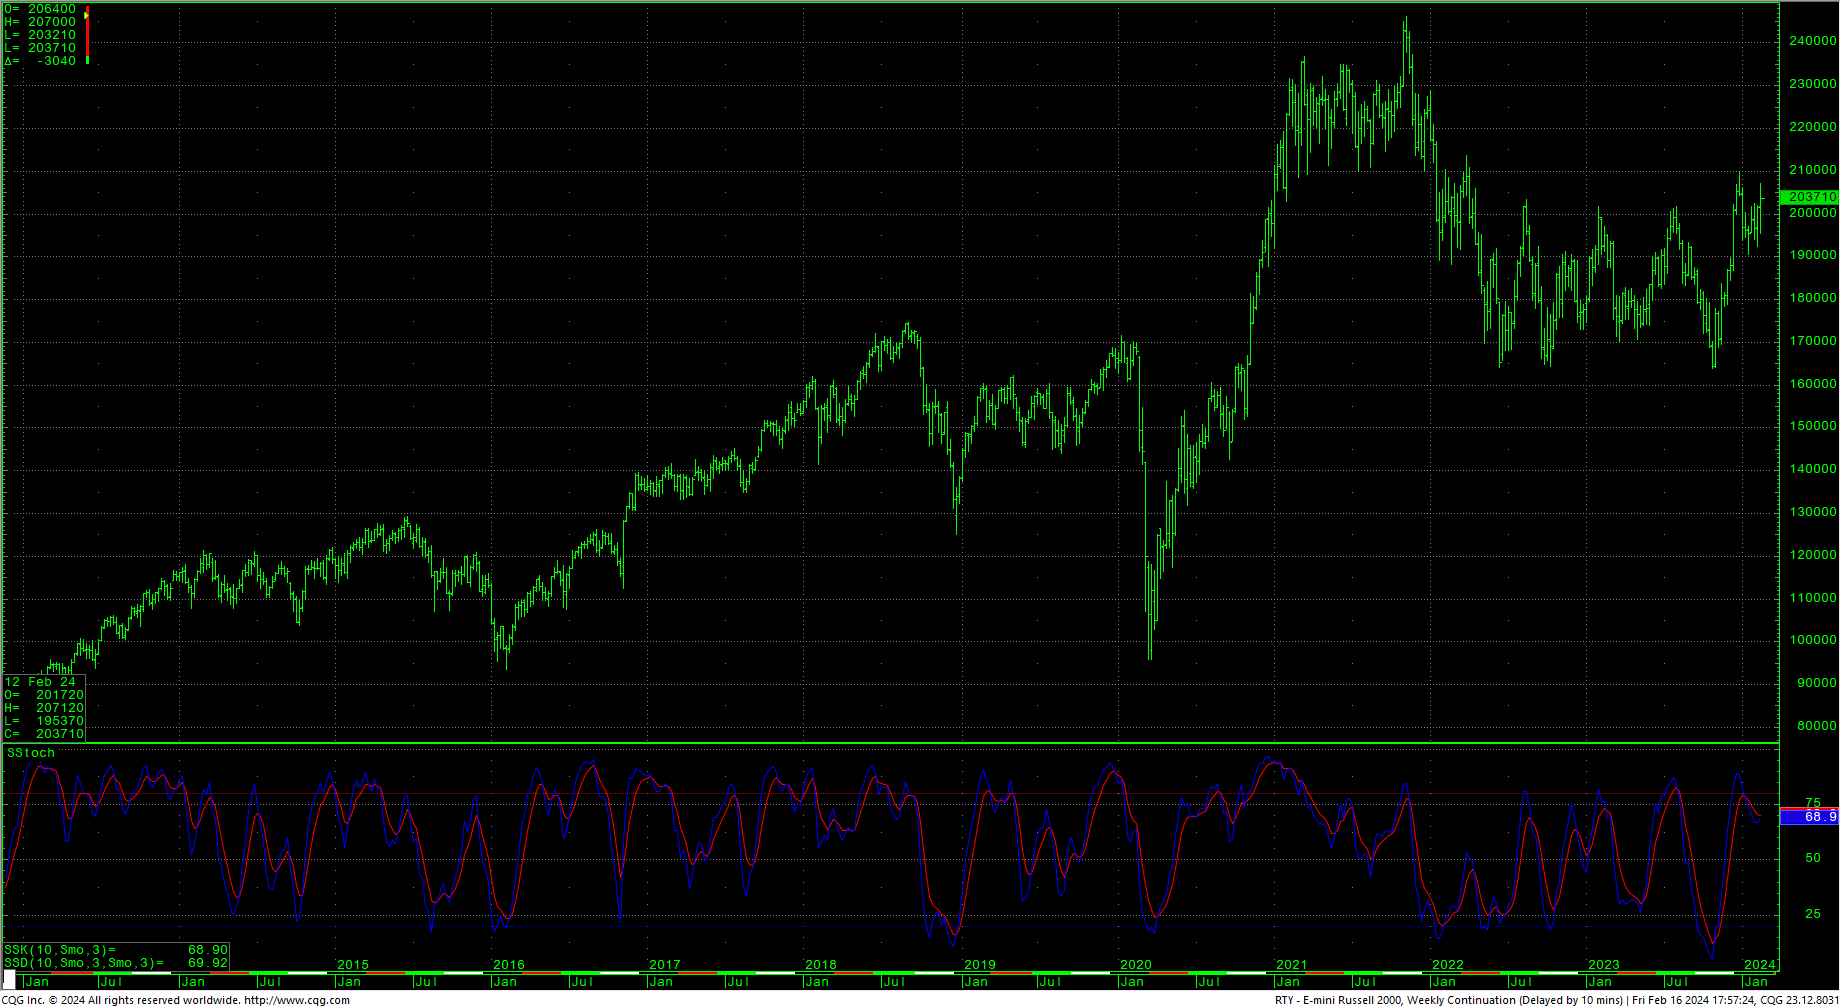
The Dow traded an outside week, ending fractionally lower close, in the upper end of the week’s range. The weekly charts are definitely into overbought conditions now. There remains the potential for stocks to be on the edge of a melt-up in a third-wave move. We are still at the very, very early beginning of the tech revolution and “data is the new oil.“That said, the selloff in bonds and the continued greed/extreme greed readings are cautionary. BRKA hit record highs and closed at a new record. The Buffett Indicator is still below the highs set in late 2021. The rally in the Russell set up a strong up week for the RSP-SPY weekly and that chart needs to be looked at as a potential double bottom forming.
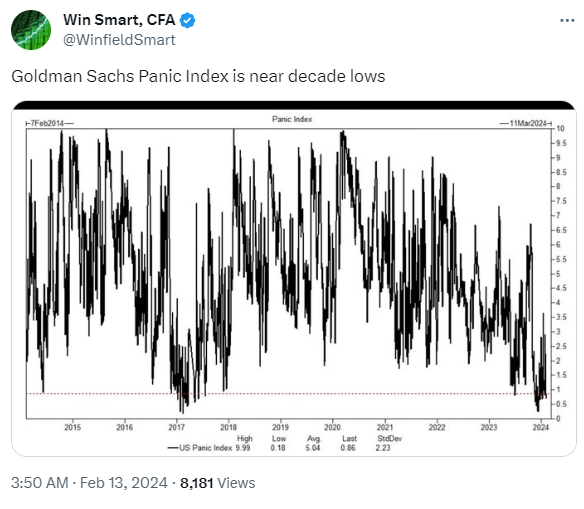
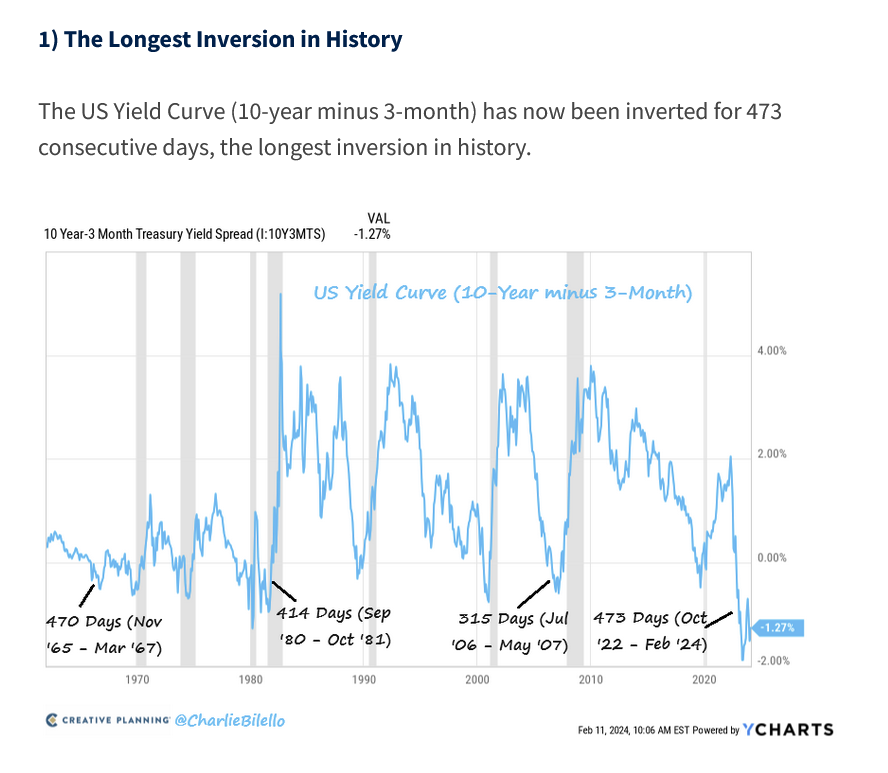
 Prices collapsed in Tuesday’s cycle timing, a selloff that coincided with a spate of headlines announcing that the top was “in,” only to see the S&P wheel around and set a new all-time high two days later. Both the bonds and the dollar moved into two-month extremes. Next critical timing is this Wednesday/Thursday where there is a slate of Fed chair speeches. The Goldman Sachs Panic Index is back toward zero. The “inverted yield curve” has now been inverted for the longest period ever recorded.
52-Week A/D Line
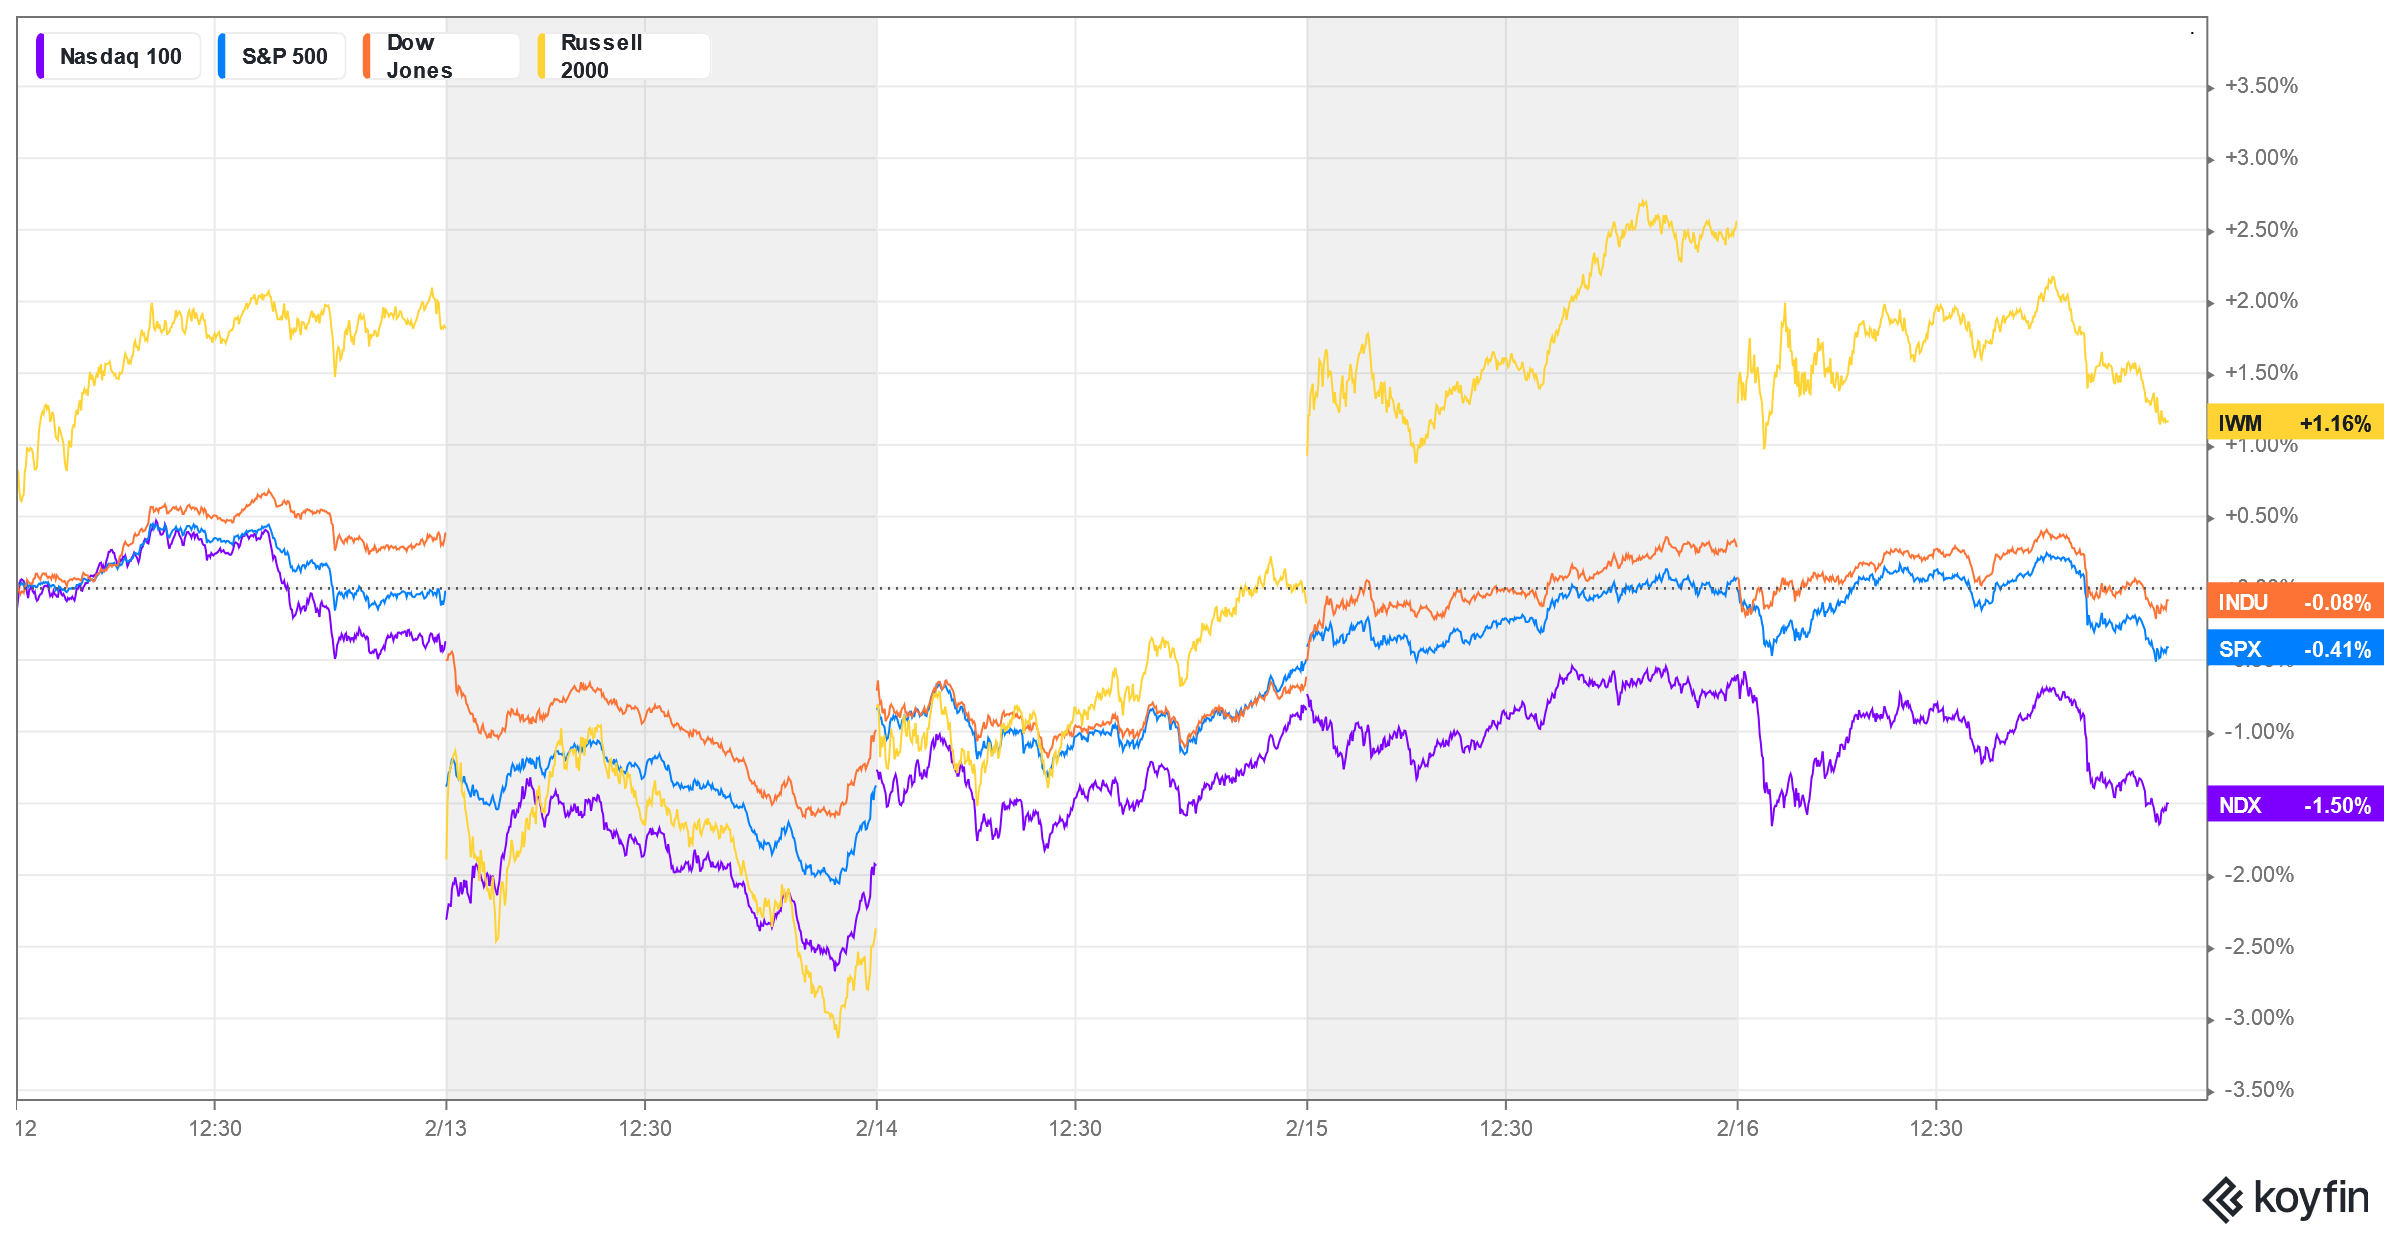
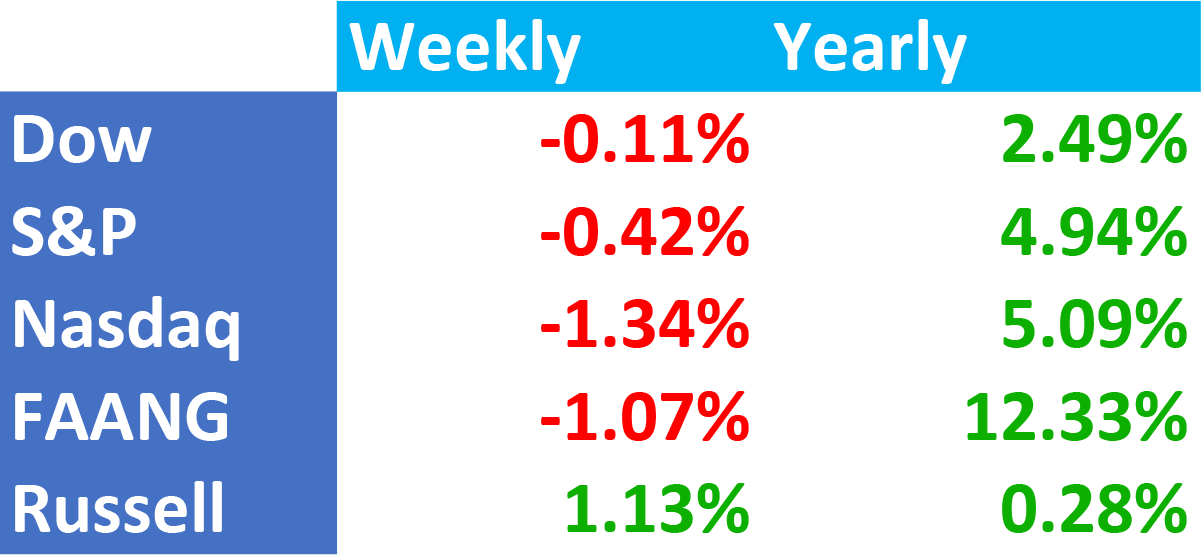
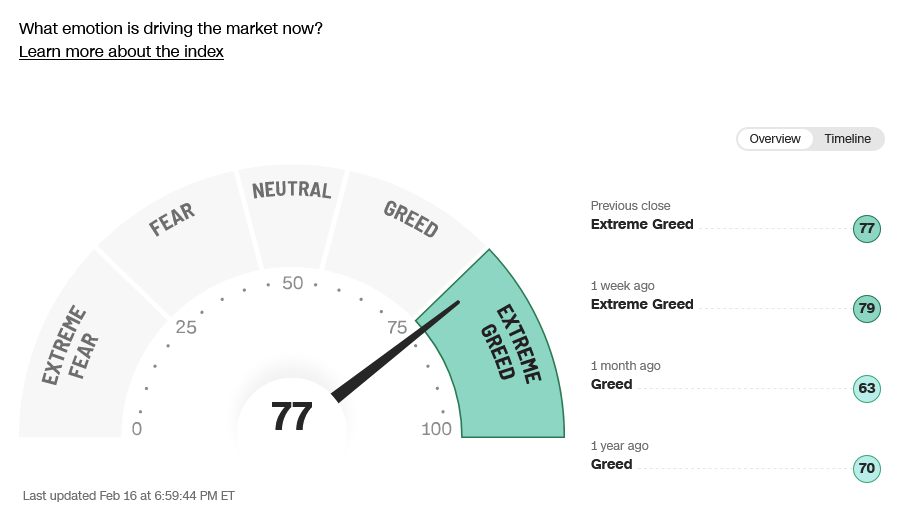
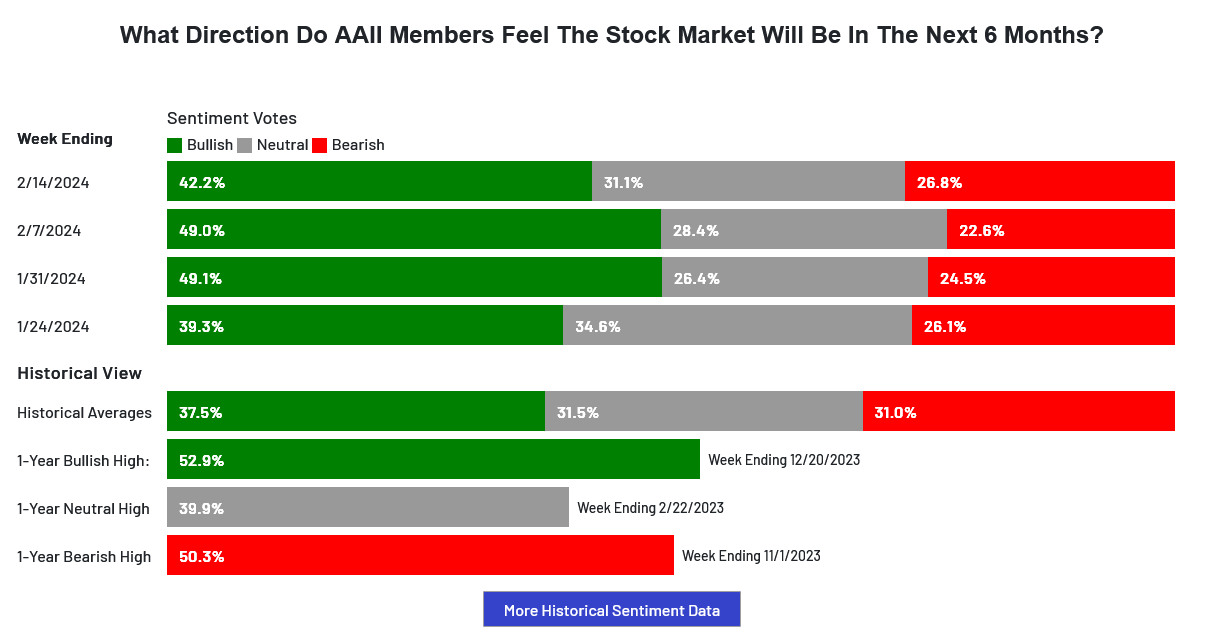
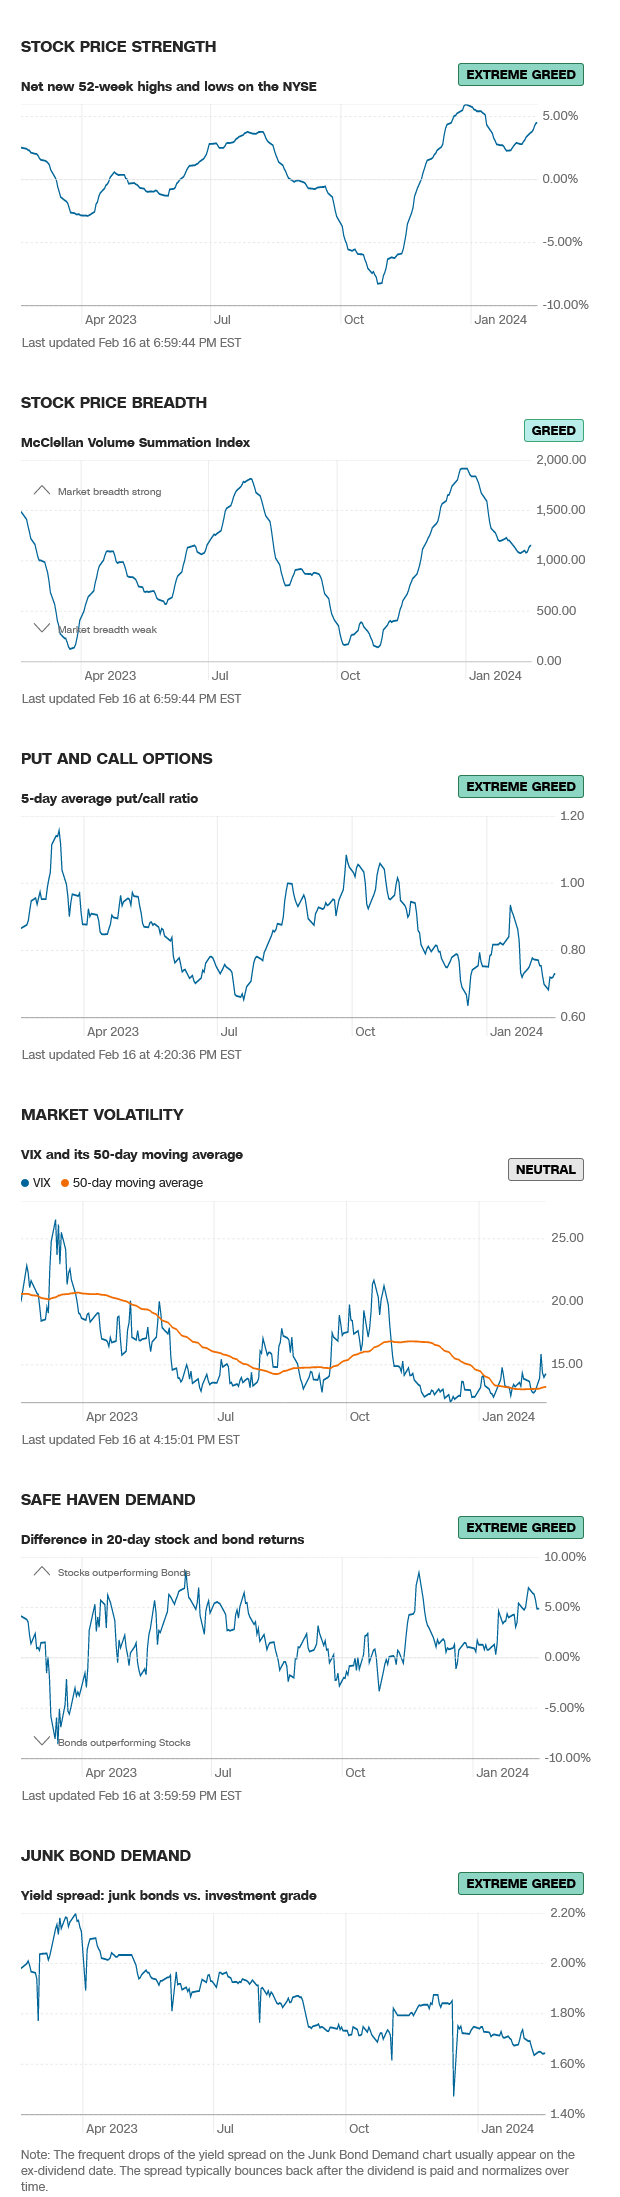
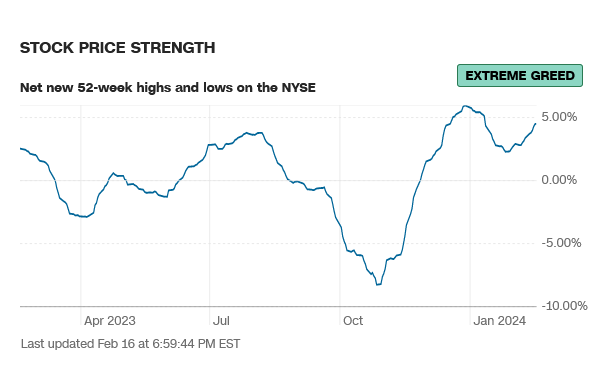
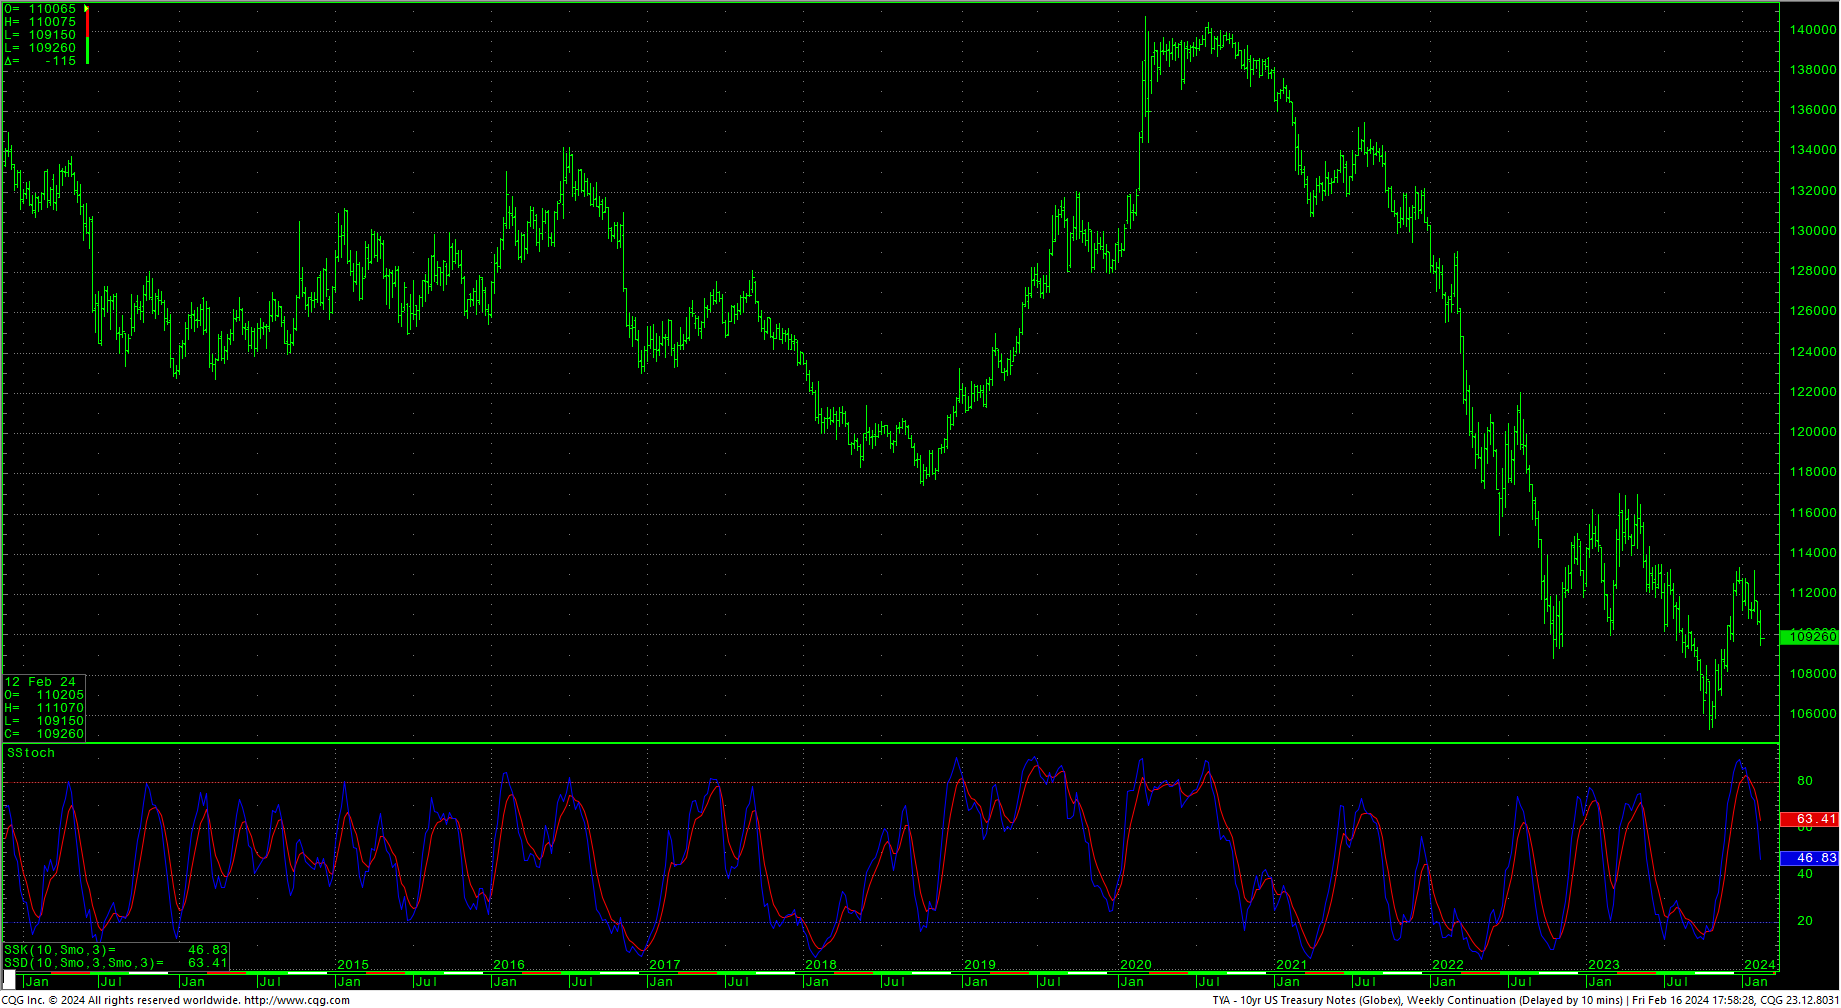
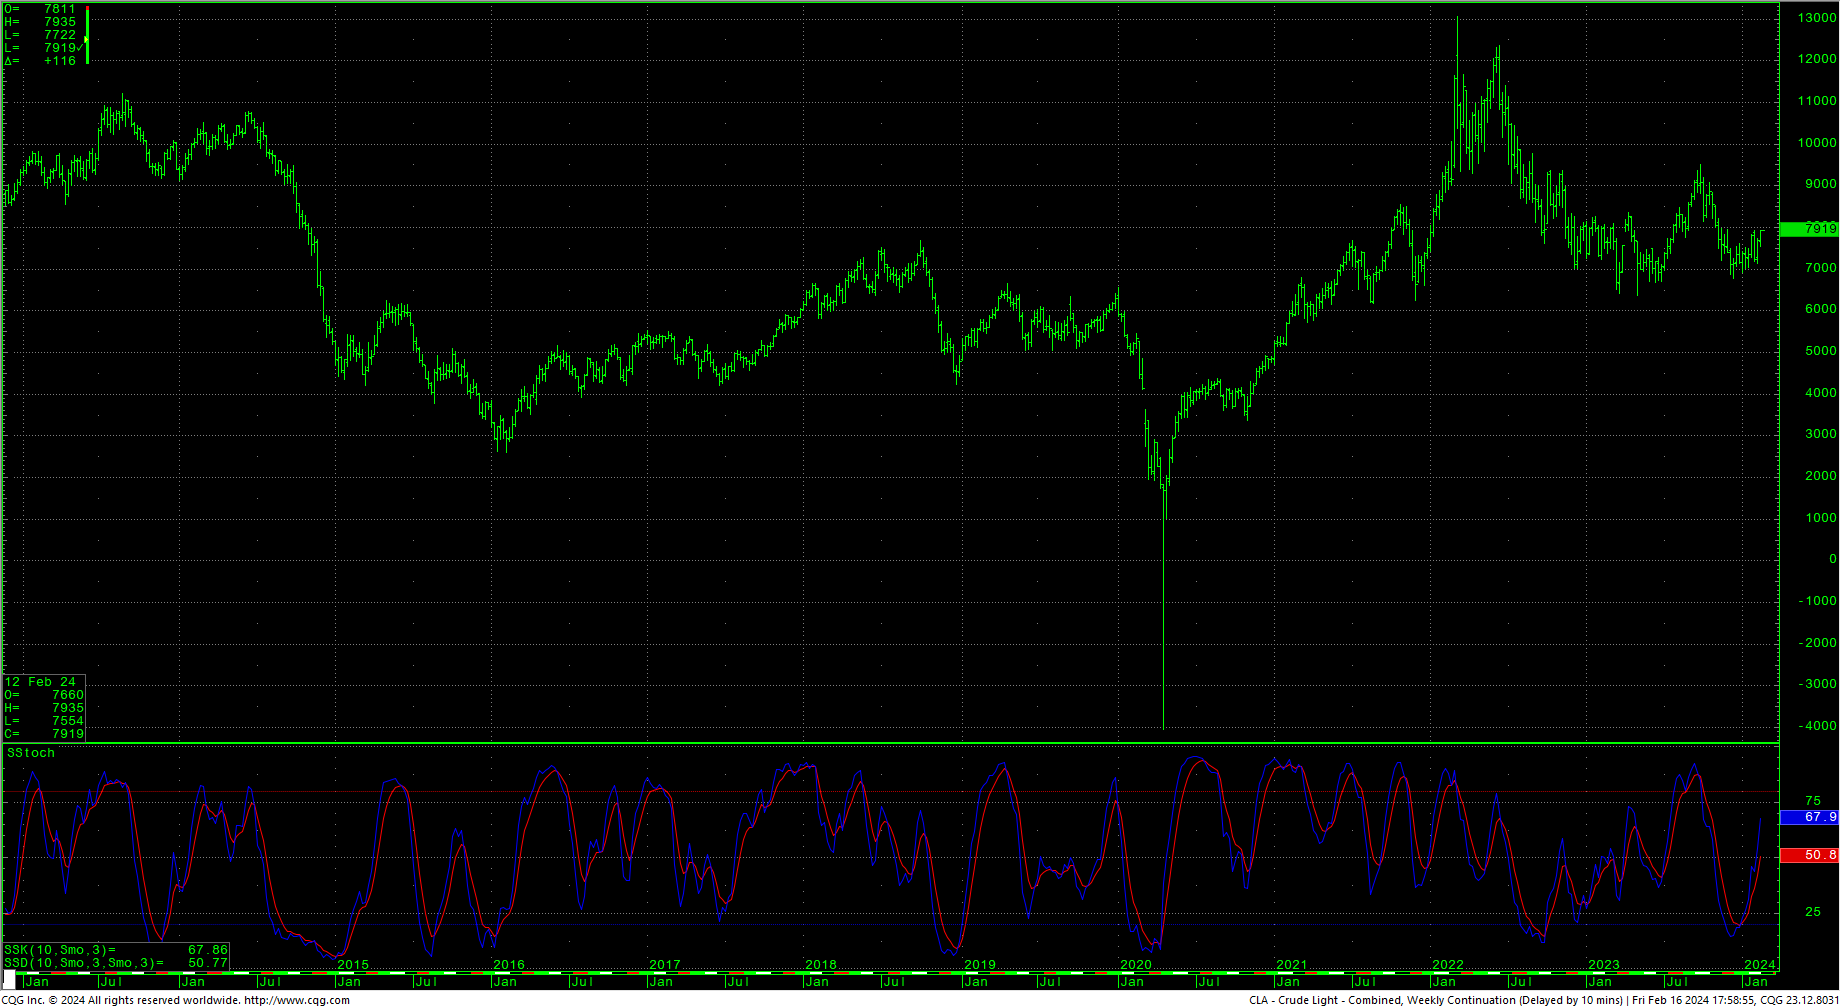
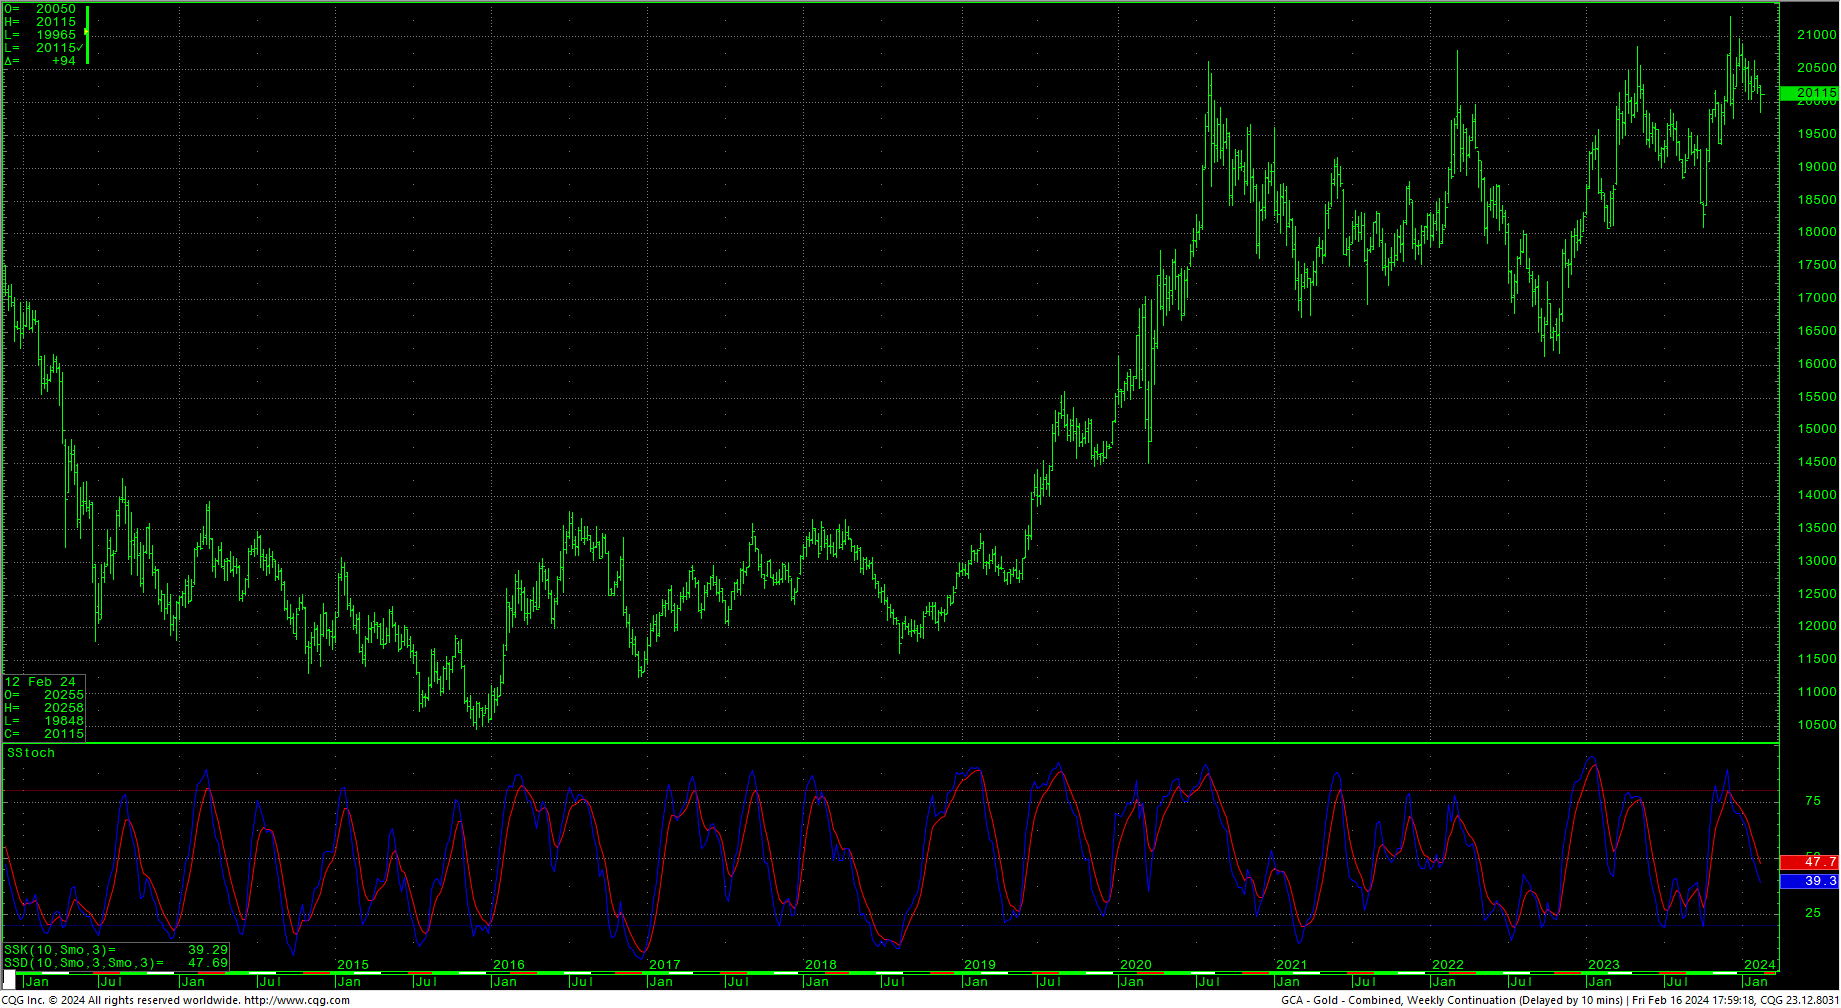
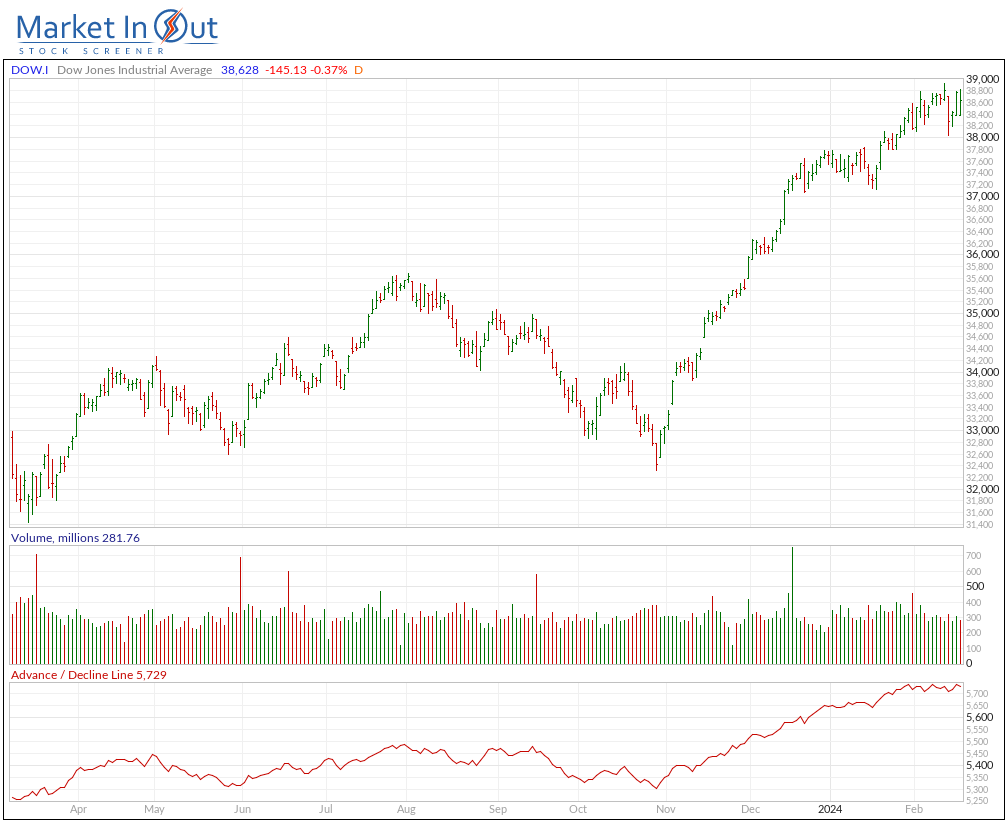 Sentiment indicators remain in greed/extreme greed readings…with breadth still declining. Last week in the AAII Sentiment Survey: Optimism Falls. The Dow A/D line sits at 5729, at record highs. The VIX exploded last week to a four-month high and then closed higher, in the lower end of the range. The Put/Call ratio moved to 0.73, reflecting extreme greed. The 52-week, A/D moved up to +4.51% and indicates extreme greed. The Dow closed the week down -0.11%. The S&P was down -0.42%. The Nasdaq ended the week down -1.34%, the FANG closed lower after setting record highs, down -1.07% with the Russell outperforming every other market, closing up +1.13%. The 10-year notes sold off with prices setting new lows for 2024, closing in the bottom of the weekly range. For S&R numbers, see the most recent Special Report. The CRB was down -0.53%…crude oil rallied to a three-month high, closing on the top of the range. Gold closed lower but toward the upper of the weekly range after trading to a nine-week low. The CoT sees commercials buying and large speculators selling, dealers doing some buying and asset managers leveling positions.
Timing Points
Wednesday/Thursday marks critical timing with potential for high volume and/or an extreme.
- 02/21-22 *** X possible extreme
- 02/28 **
- 03/04 ** (bonds)
CNN Fear & Greed Index
AAII Investor Sentiment Survey
 Dow Jones Industrial Average Hourly HLC
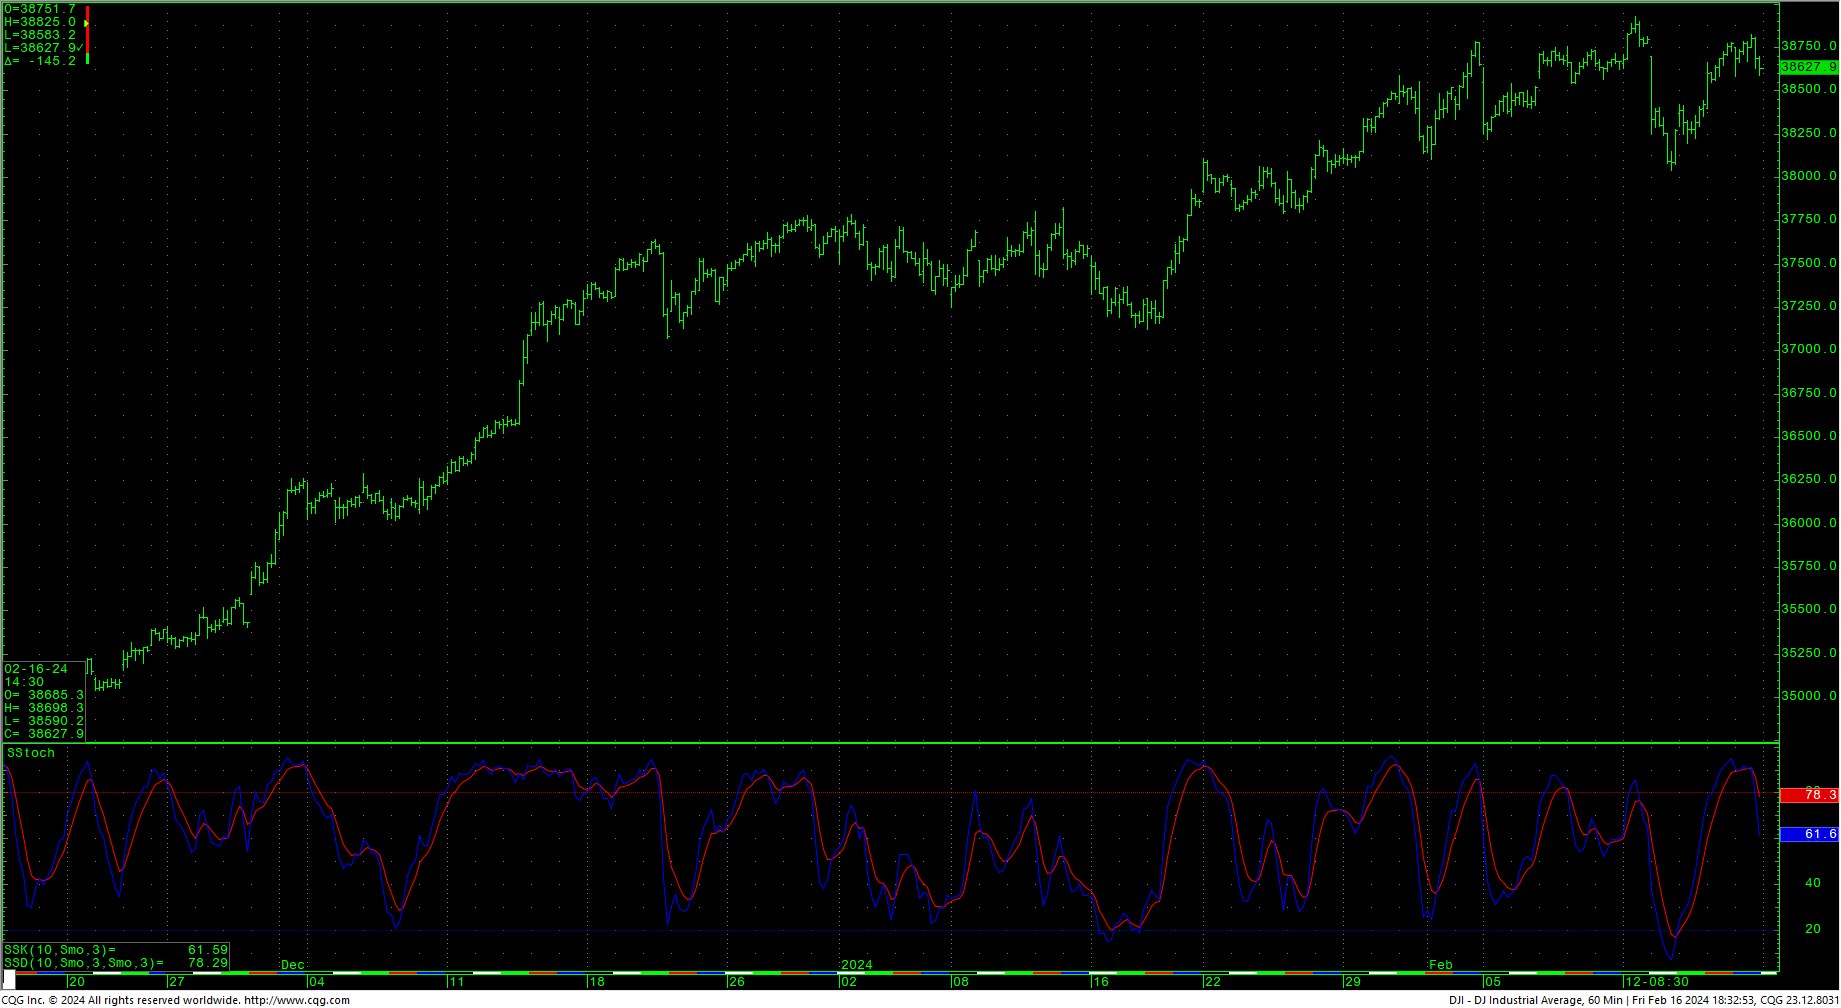 The Dow sold off Friday, reacting to overbought conditions on the hourly. Prices traded a new intraday high in an outside week’s range. Resistance is 38705/38717 and 38825. Rallies over 38825 should test the intraday highs at 38927. Closes over 38927 suggest a move to long-term targets at 39075. Closes over 39075 offer counts to targets at 40245.4 with longer-term potential to targets in the 45244 area. Above 45244 would open monthly counts to 47400.
Support is at 38583 and pivotal at 38501. A breakdown under 38501 can carry to 38237. Closes under 38237 can test 38024 with counts to pivotal short-term support of 37812/37805 through 37795. Closes under 37795 setup a move toward 37369 with counts to 36405/36400. A breakdown under 36400 opens counts to 35005. Closes under 35005 can carry toward critical short-term support of 34848/34840. Closes below 34840 open counts to 33793 with potential to 32582/32575.
Dow Jones Industrial Average Weekly HLC
Resistance
|
Support
|
S&P 500 Cash Index
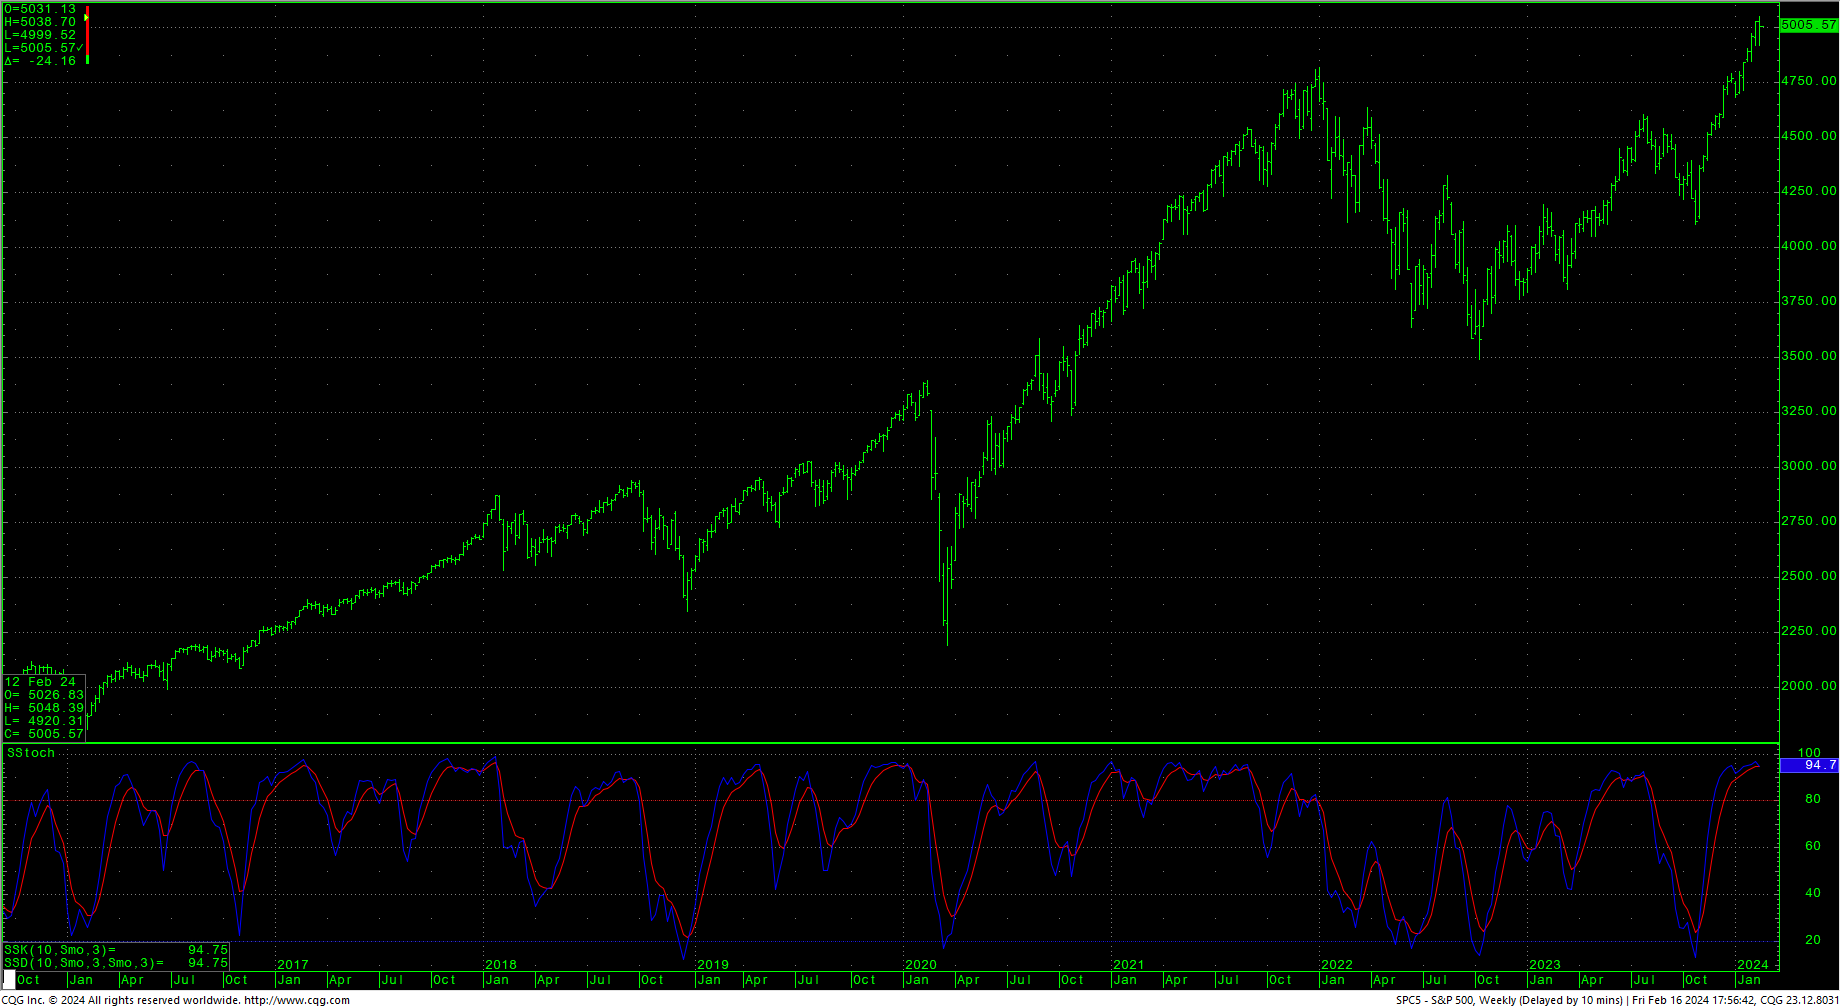
The S&P sold off late Friday as the market responded to overbought hourly conditions. Prices set new record highs, closing lower on the weekly and in the upper 50% of the range. The hourly is overbought. Resistance is at 5018 and 5038/5039. A drive above 5039 should test the intraday high at 5048/5049 and will reopen counts to upside targets in the 5144 area. Closes over 5144 set up a drive to 5288 with counts to 5432. A breakout over 5432 will open potential to the 5720 area. Closes over 5720 offer upside targets at 6000/6008.
S&P 500 Index Hourly HLC
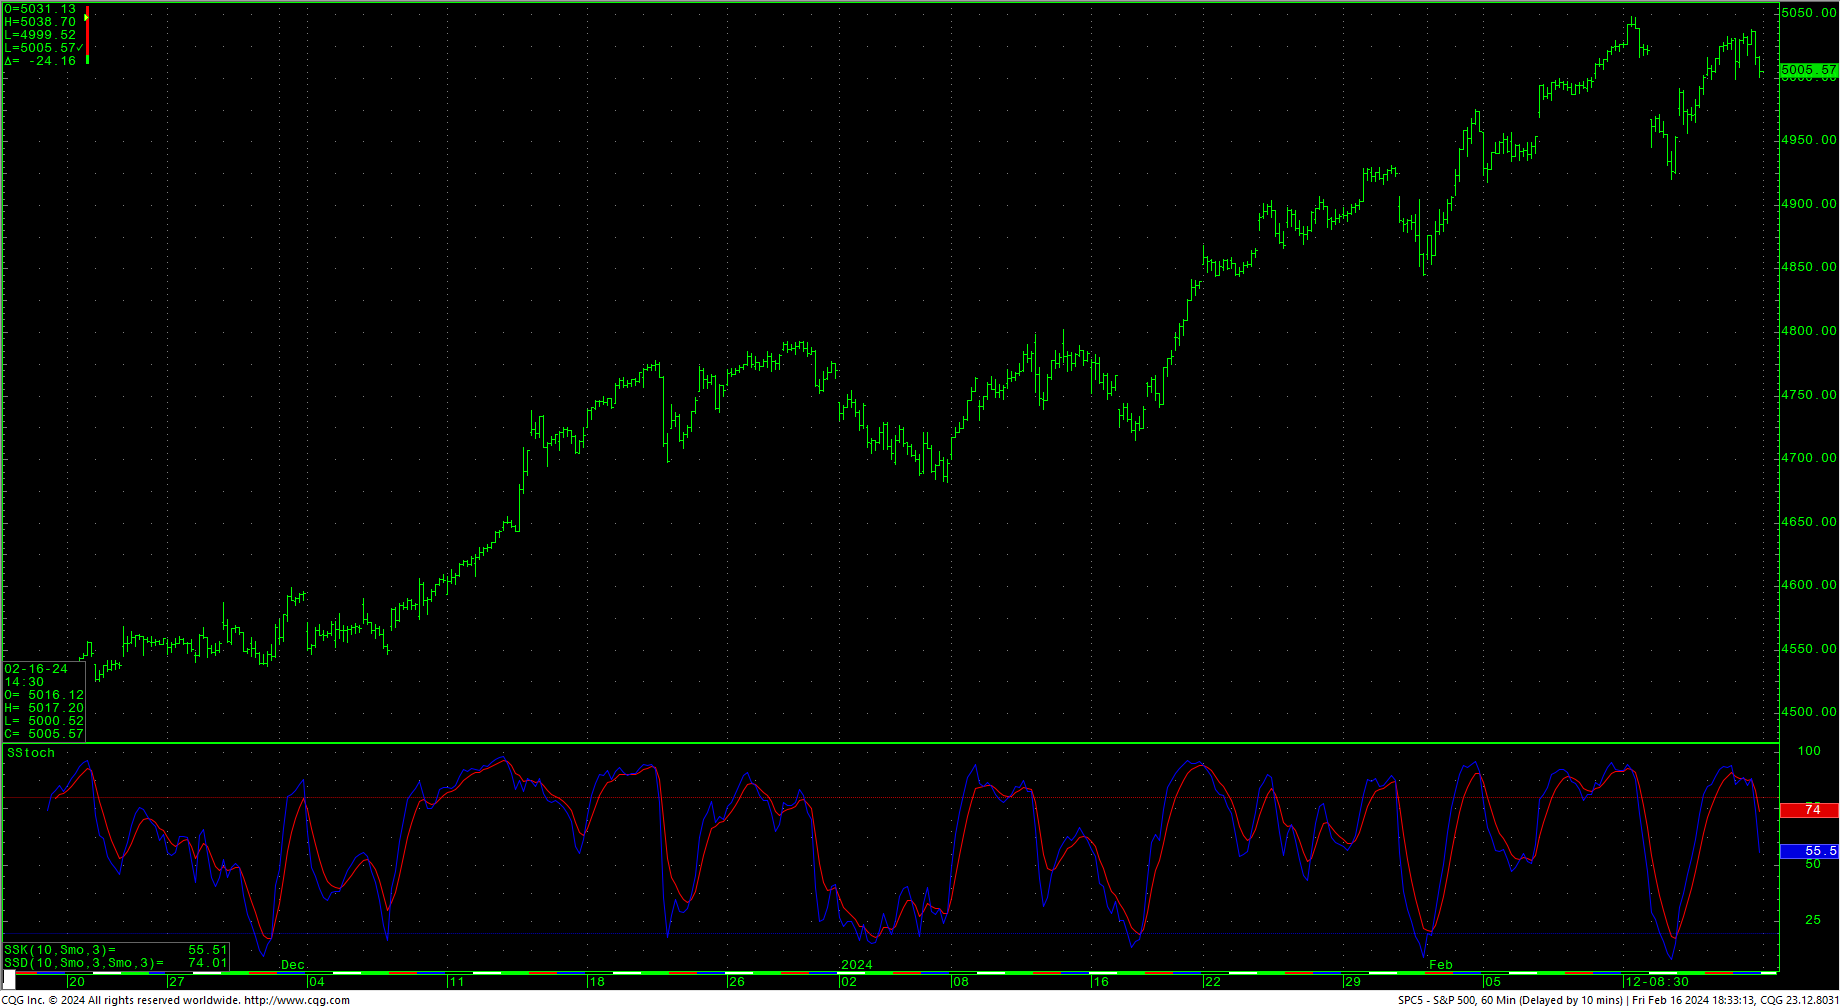 Support is at 5000/4999 and 4970. A breakdown under 4970 sets up a move to 4946 with counts to pivotal short-term support of 4922/4920 through 4908. Closes under 4908 suggest 4865 while opening potential to critical support of 4822/4818. A breakdown under 4818 should test 4768 with counts to 4680. Daily closes under 4680 count toward 4566 with potential to critical short-term support of 4453/4450. Daily closes under 4450 set up a move to 4394.
S&P 500 Index Weekly HLC
Resistance
|
Support
|


