TECHNICAL ANALYSIS
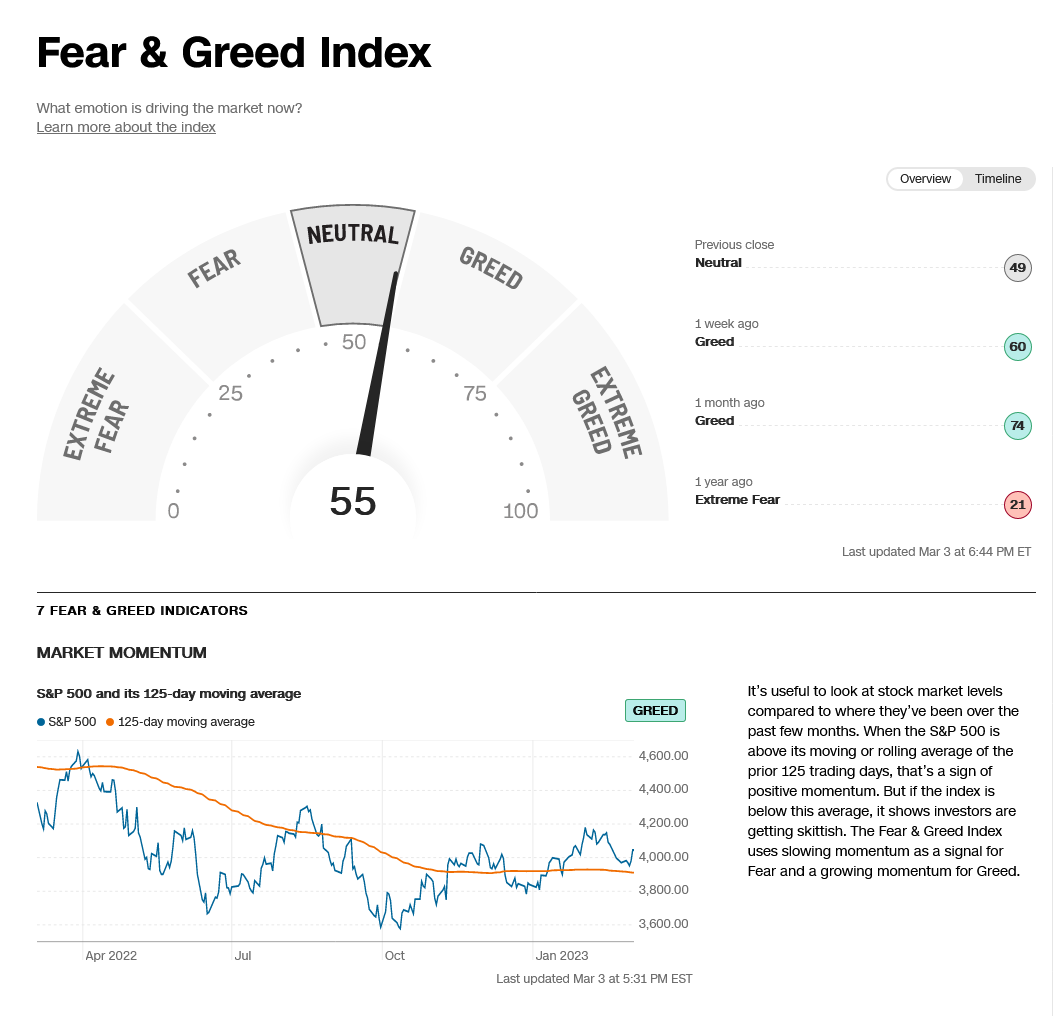
The DJIA staged an upside reversal week and settled in the top of the weekly range, up +1.75% on the week. The market tested the last major wave lows on the daily, set back in December, before reversing with a strong performance to finish out the week on Friday. The hourly has reached severe overbought conditions while the daily stochastics are just hooking up from oversold conditions. Overall, the market remains contained within the range that is established by the December 13th high of 34712 and the past week’s low at 32500. Sentiment remains neutral to bullish. The Put/Call ratio is slightly more friendly than it was at the December lows and the 52-week highs/lows remains frothy at +1.39%. The S&P also staged a reversal and nearly measured an outside week up, performing slightly better as it closed up +1.91% on the week. The S&P hourly is also showing severe overbought conditions with Friday’s rally while the daily is only just turning up from deeply oversold conditions on the slow stochastics.
Dow Jones Industrial Average Hourly HLC
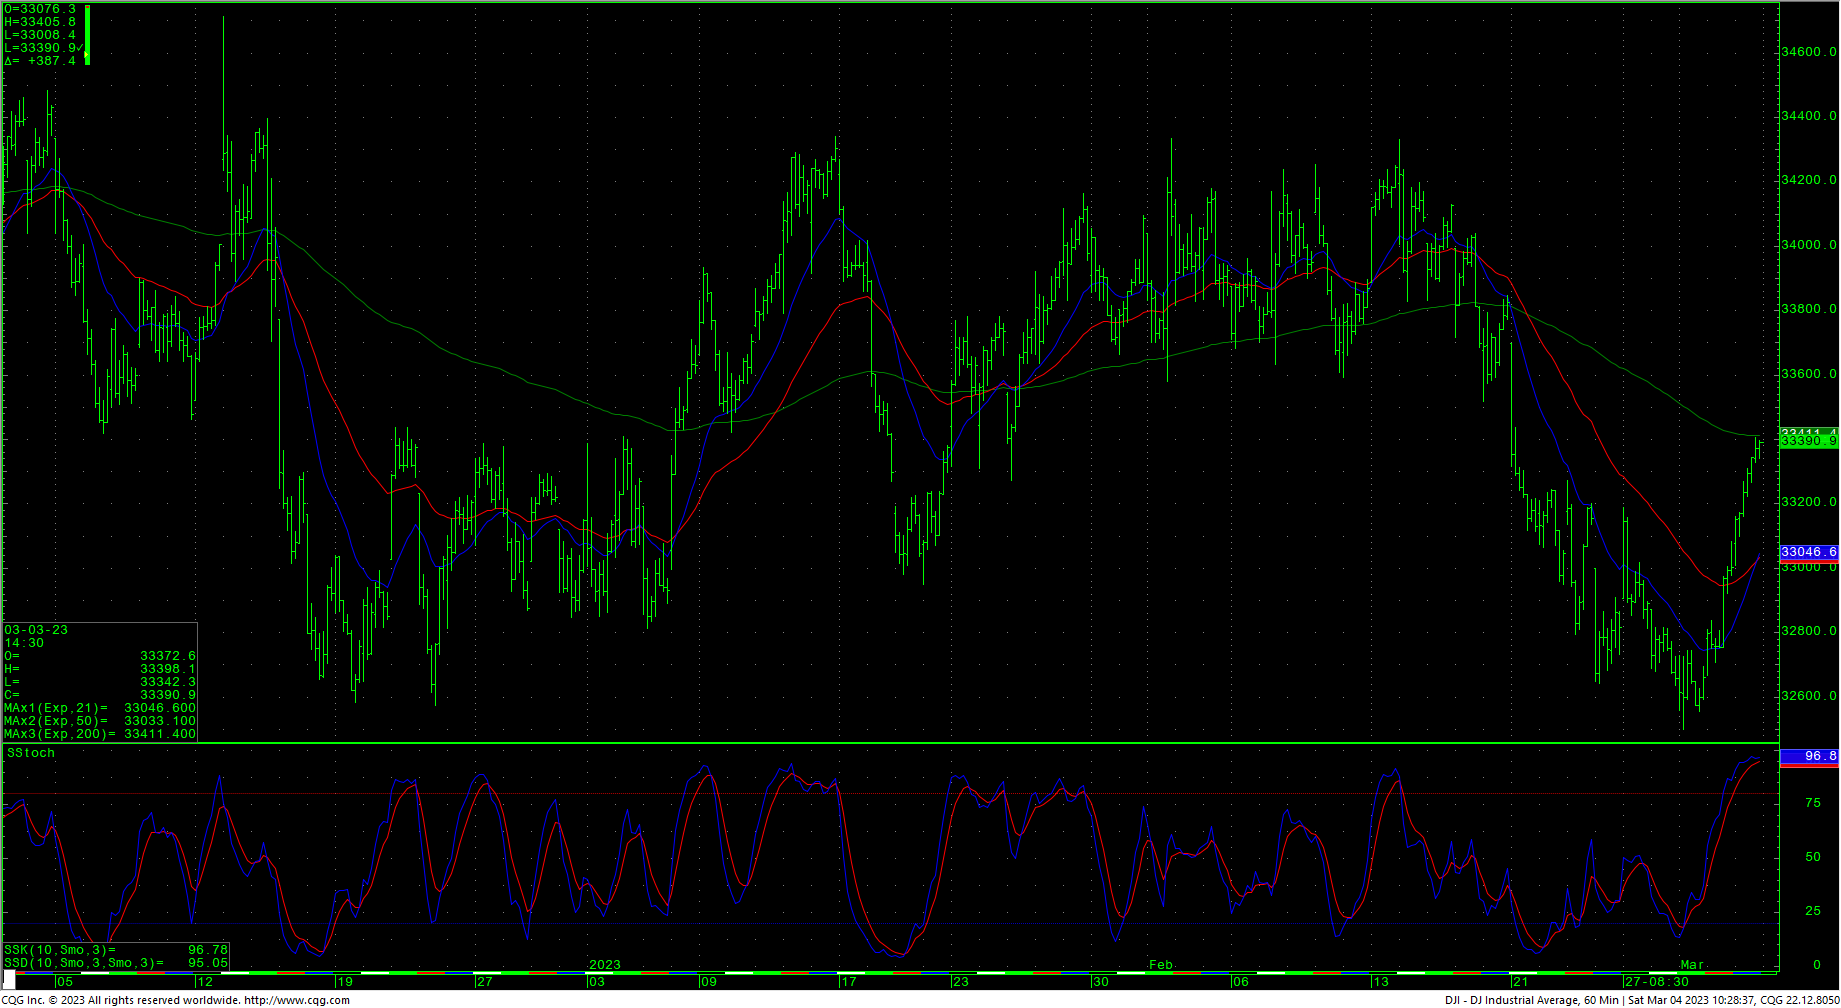
As mentioned above, the market rebounded from a critical wave point on the daily chart at the December lows. Short-term, support is 33060, 32953 and 32846/32840. A breakdown under 32840 sets up 32726/32714 while opening counts back to the 32500 lows and a possible shot at 32400. A breakdown under 32400 opens counts to key short-term support of 32192/32170. A breakdown with closes under 32170 sets up 32099 with longer-term potential toward 31727/31686. Closes under 31686 will open counts into the 30972/30960 level with support of 31423 and 31160.
Dow Jones Industrial Average Weekly HLC
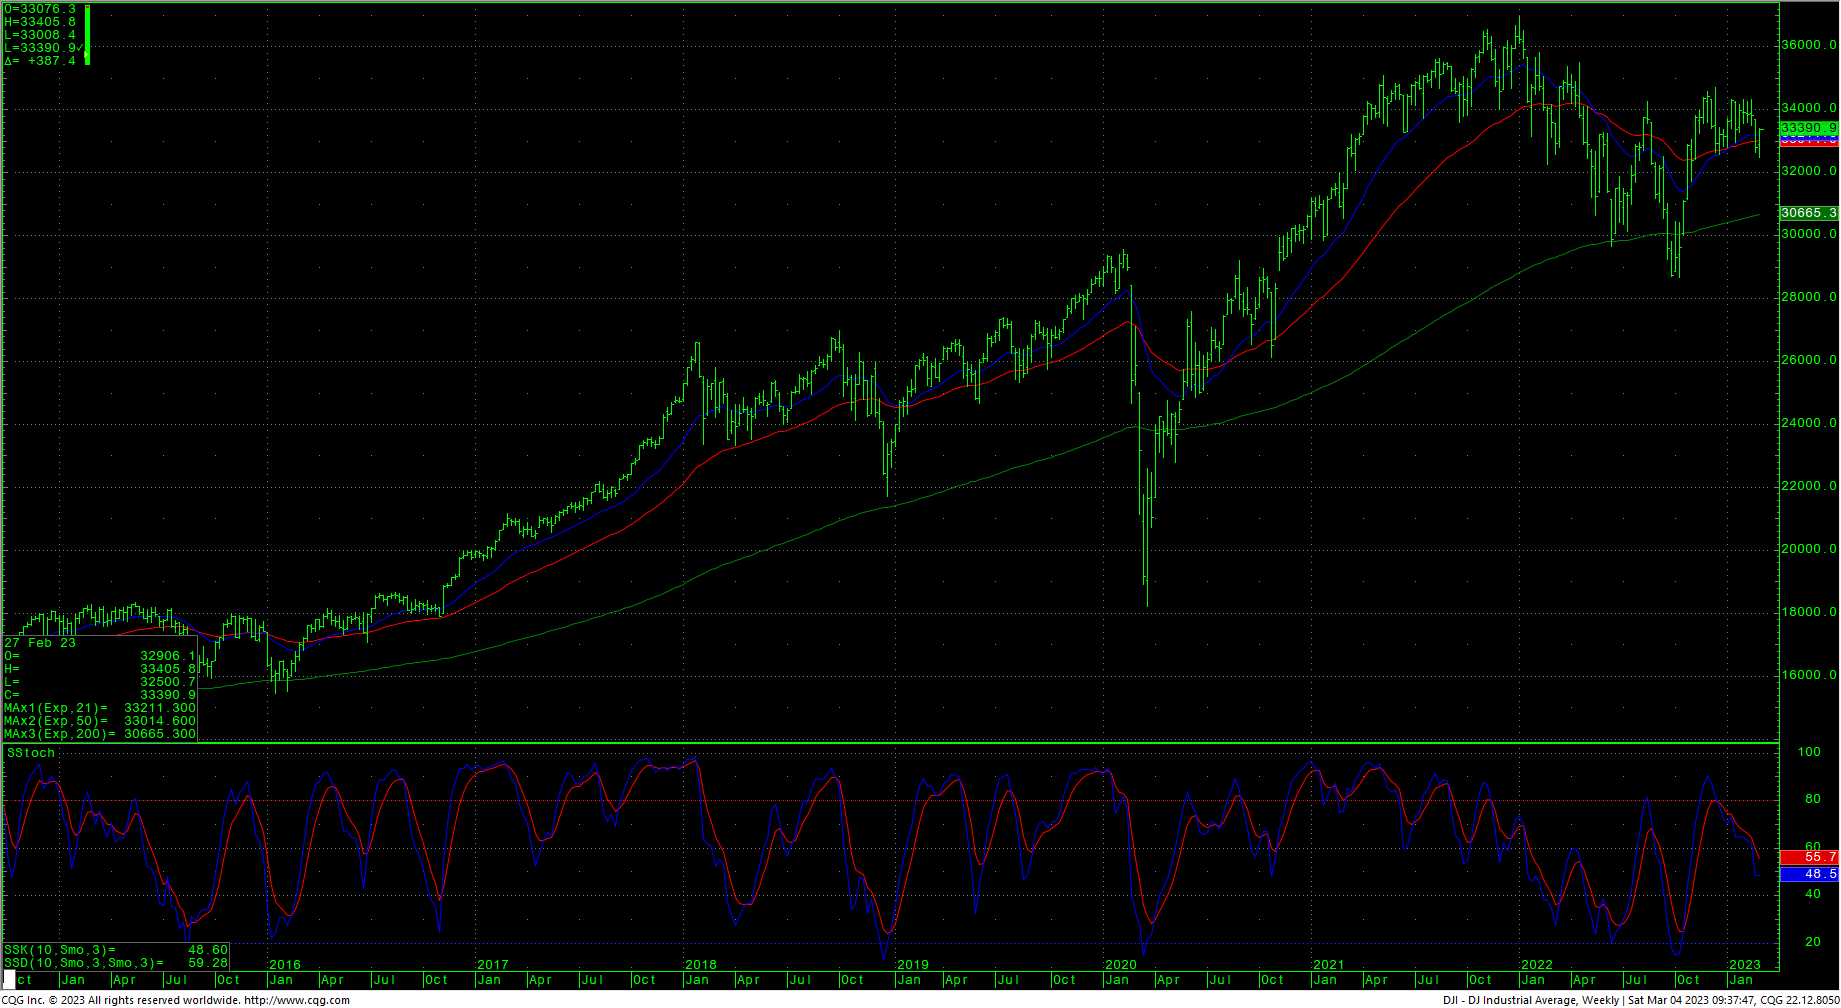
Prices ended just above short-term resistance of 33350 and is positioned for a test of 33606. Resistance for the DJIA is 33606 and 33867/33875. Rallies with closes over 33875 can test 34160/34190. A drive above 34190 should retest 34334/34342 with potential to pivotal resistance at 34395/34400. A drive above 34400 opens counts to 34589 and the December swing highs at 34712 and will open potential to a band of long-term resistance at 34879 through 34995/35000.
CNN Fear & Greed Index
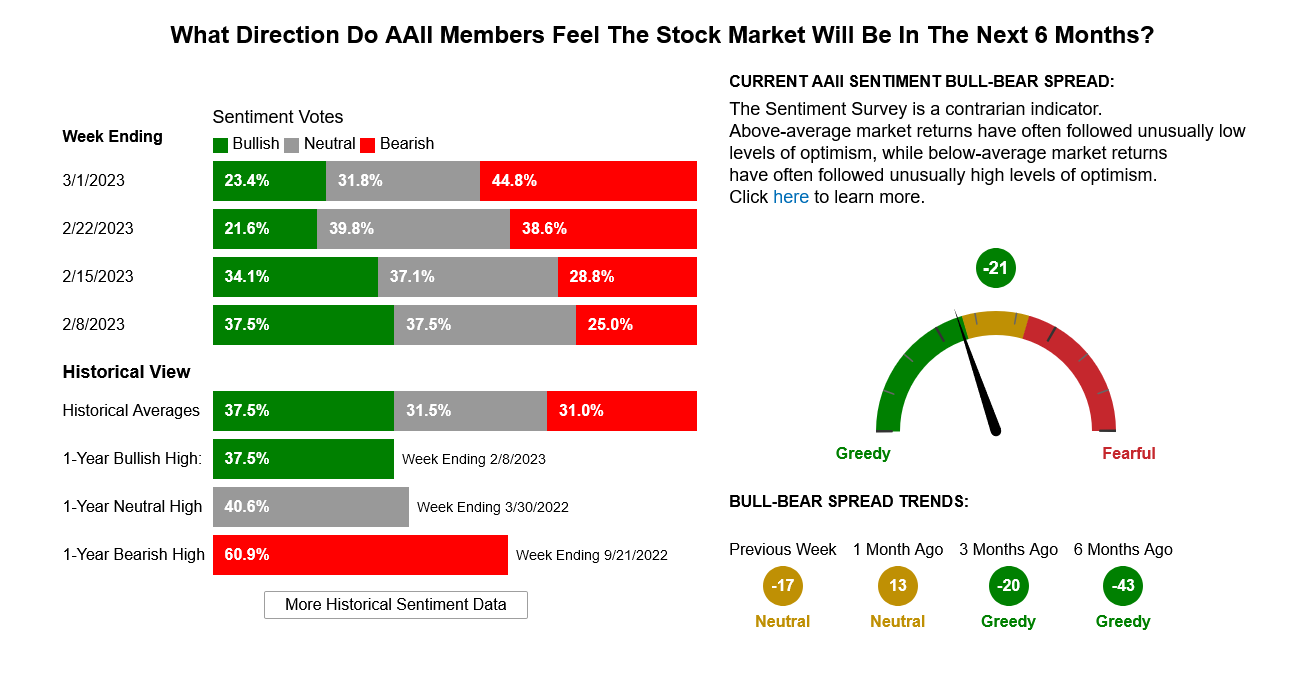
AAII Investor Sentiment Survey
Support
- 33060 **
- 32953 ***
- 32846/32840 *** ↓
- 32726/32714 ***
- 32600/32573 *** ↓
- 32473 **
- 32400 *** ↓
- 32192/32170 *** ↓
- 32147 **
- 32099 ***
- 32033 **
- 31876 **
- 31727 *** ↓
- 31686 *** ↓
- 31575
- 31423 ***
Resistance
- 33487 ***
- 33606 *** ↑
- 33699 **
- 33770
- 33867/33875 *** ↑
- 33960 **
- 34060 **
- 34160/34190 *** ↑
- 34334/34342 *** ↑
- 34395/34400 ** ↑
- 34490 **
- 34579 ***
S&P 500 Cash Index
S&P 500 Index Daily HLC
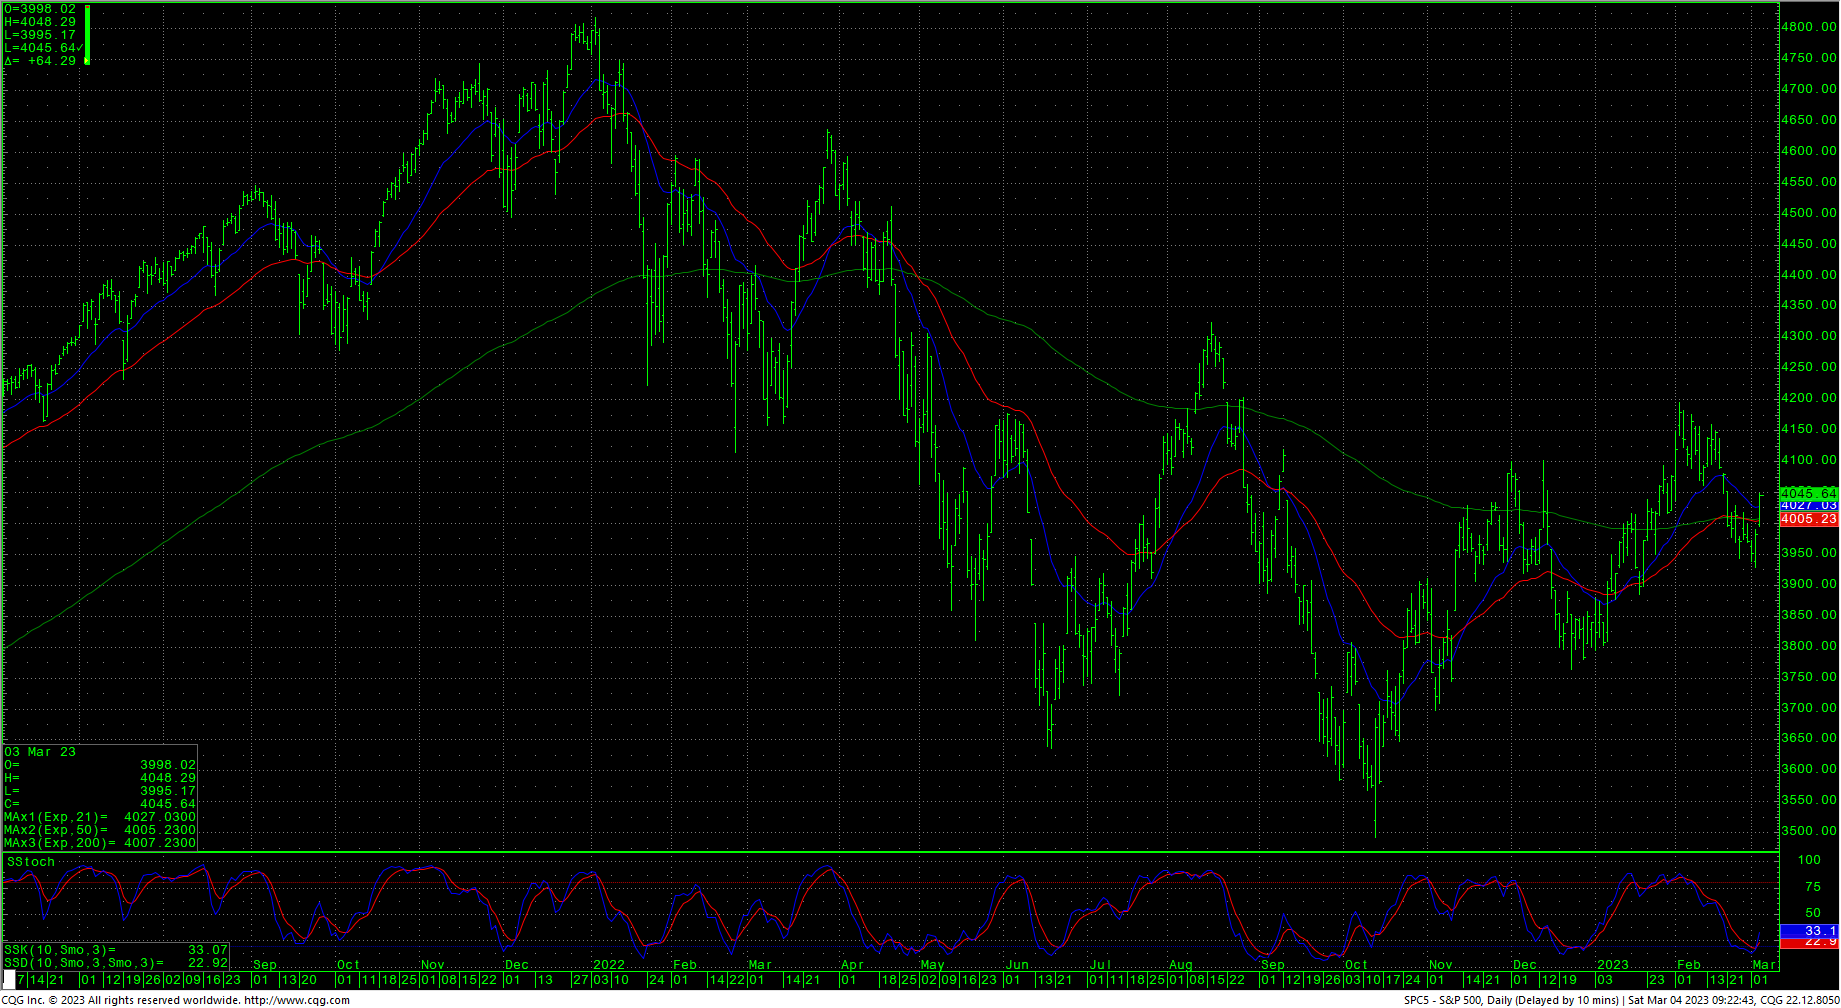
Support is 4019, 4002. Key at 3988 and near-term pivotal at 3974/3970. A breakdown with closes under 3970 open counts to 3929/3920. A move under 3920 can carry to support at 3843 with potential toward 3799/3797. Under 3750 sets up a move to 3657 and full potential back to critical support of 3500/3491.
S&P 500 Index Weekly HLC
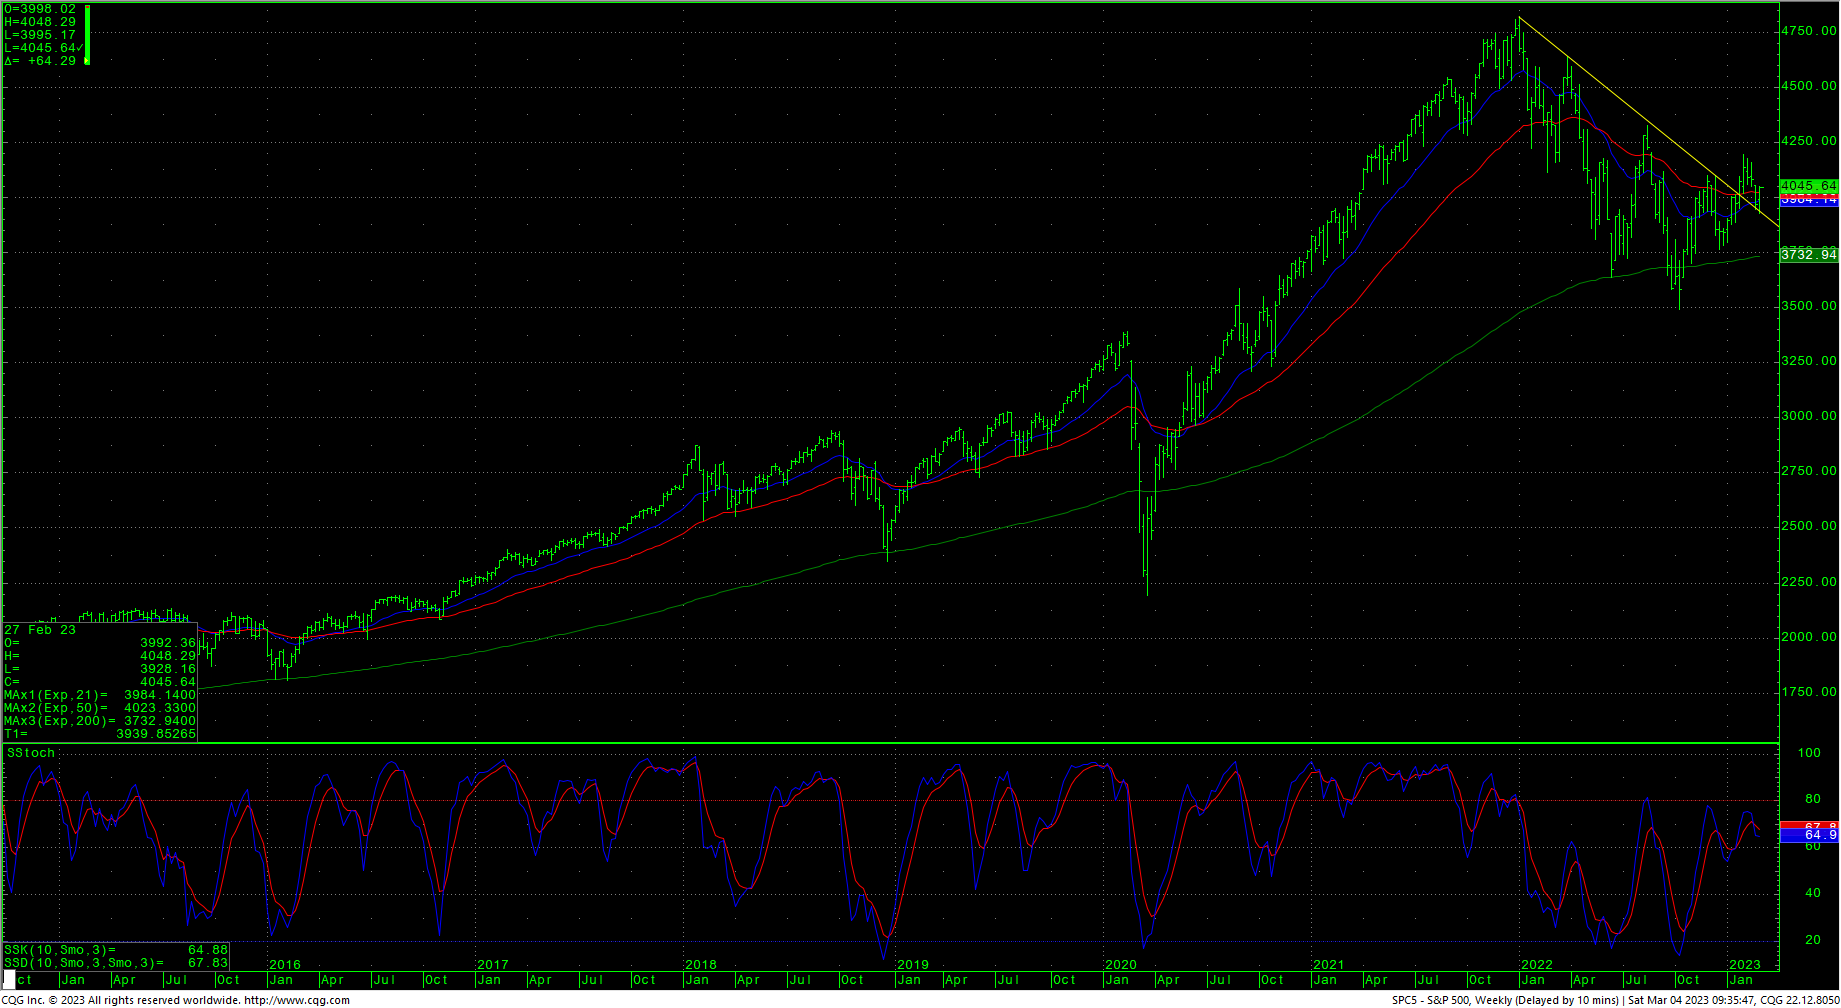
Resistance is 4060/4061. A drive above 4060 can test pivotal resistance at 4093/4097. A breakout over the 4097 level gives counts to 4128/4132 with full potential to the gap area at 4203 to 4218 and longer-term counts to critical resistance of 4311/4315. Daily closes over 4315 open counts to 4385 with full potential to long-term critical resistance of 4486/4505. Closes over 4505 can carry to 4593 with full potential toward 4637.
Support
- 4019 **
- 4002 ***
- 3988 *** ↓
- 3974/3970 *** ↓
- 3929/3920 *** ↓
- 3843/3840 **
- 3810 **
- 3799/3797 *** ↓
- 3760/3750 *** ↓
- 3667/3657 *** ↓
- 3584 **
- 3500/3491 *** ↓
Resistance
- 4060/4061 *** ↑
- 4075 **
- 4093/4097 *** ↑
- 4128/4132 *** ↑
- 4203/4218 ***
- 4311/4315 *** ↑
- 4350 **
- 4385 *** ↑
- 4430 **