
TECHNICAL ANALYSIS (by Intraday Dynamics)
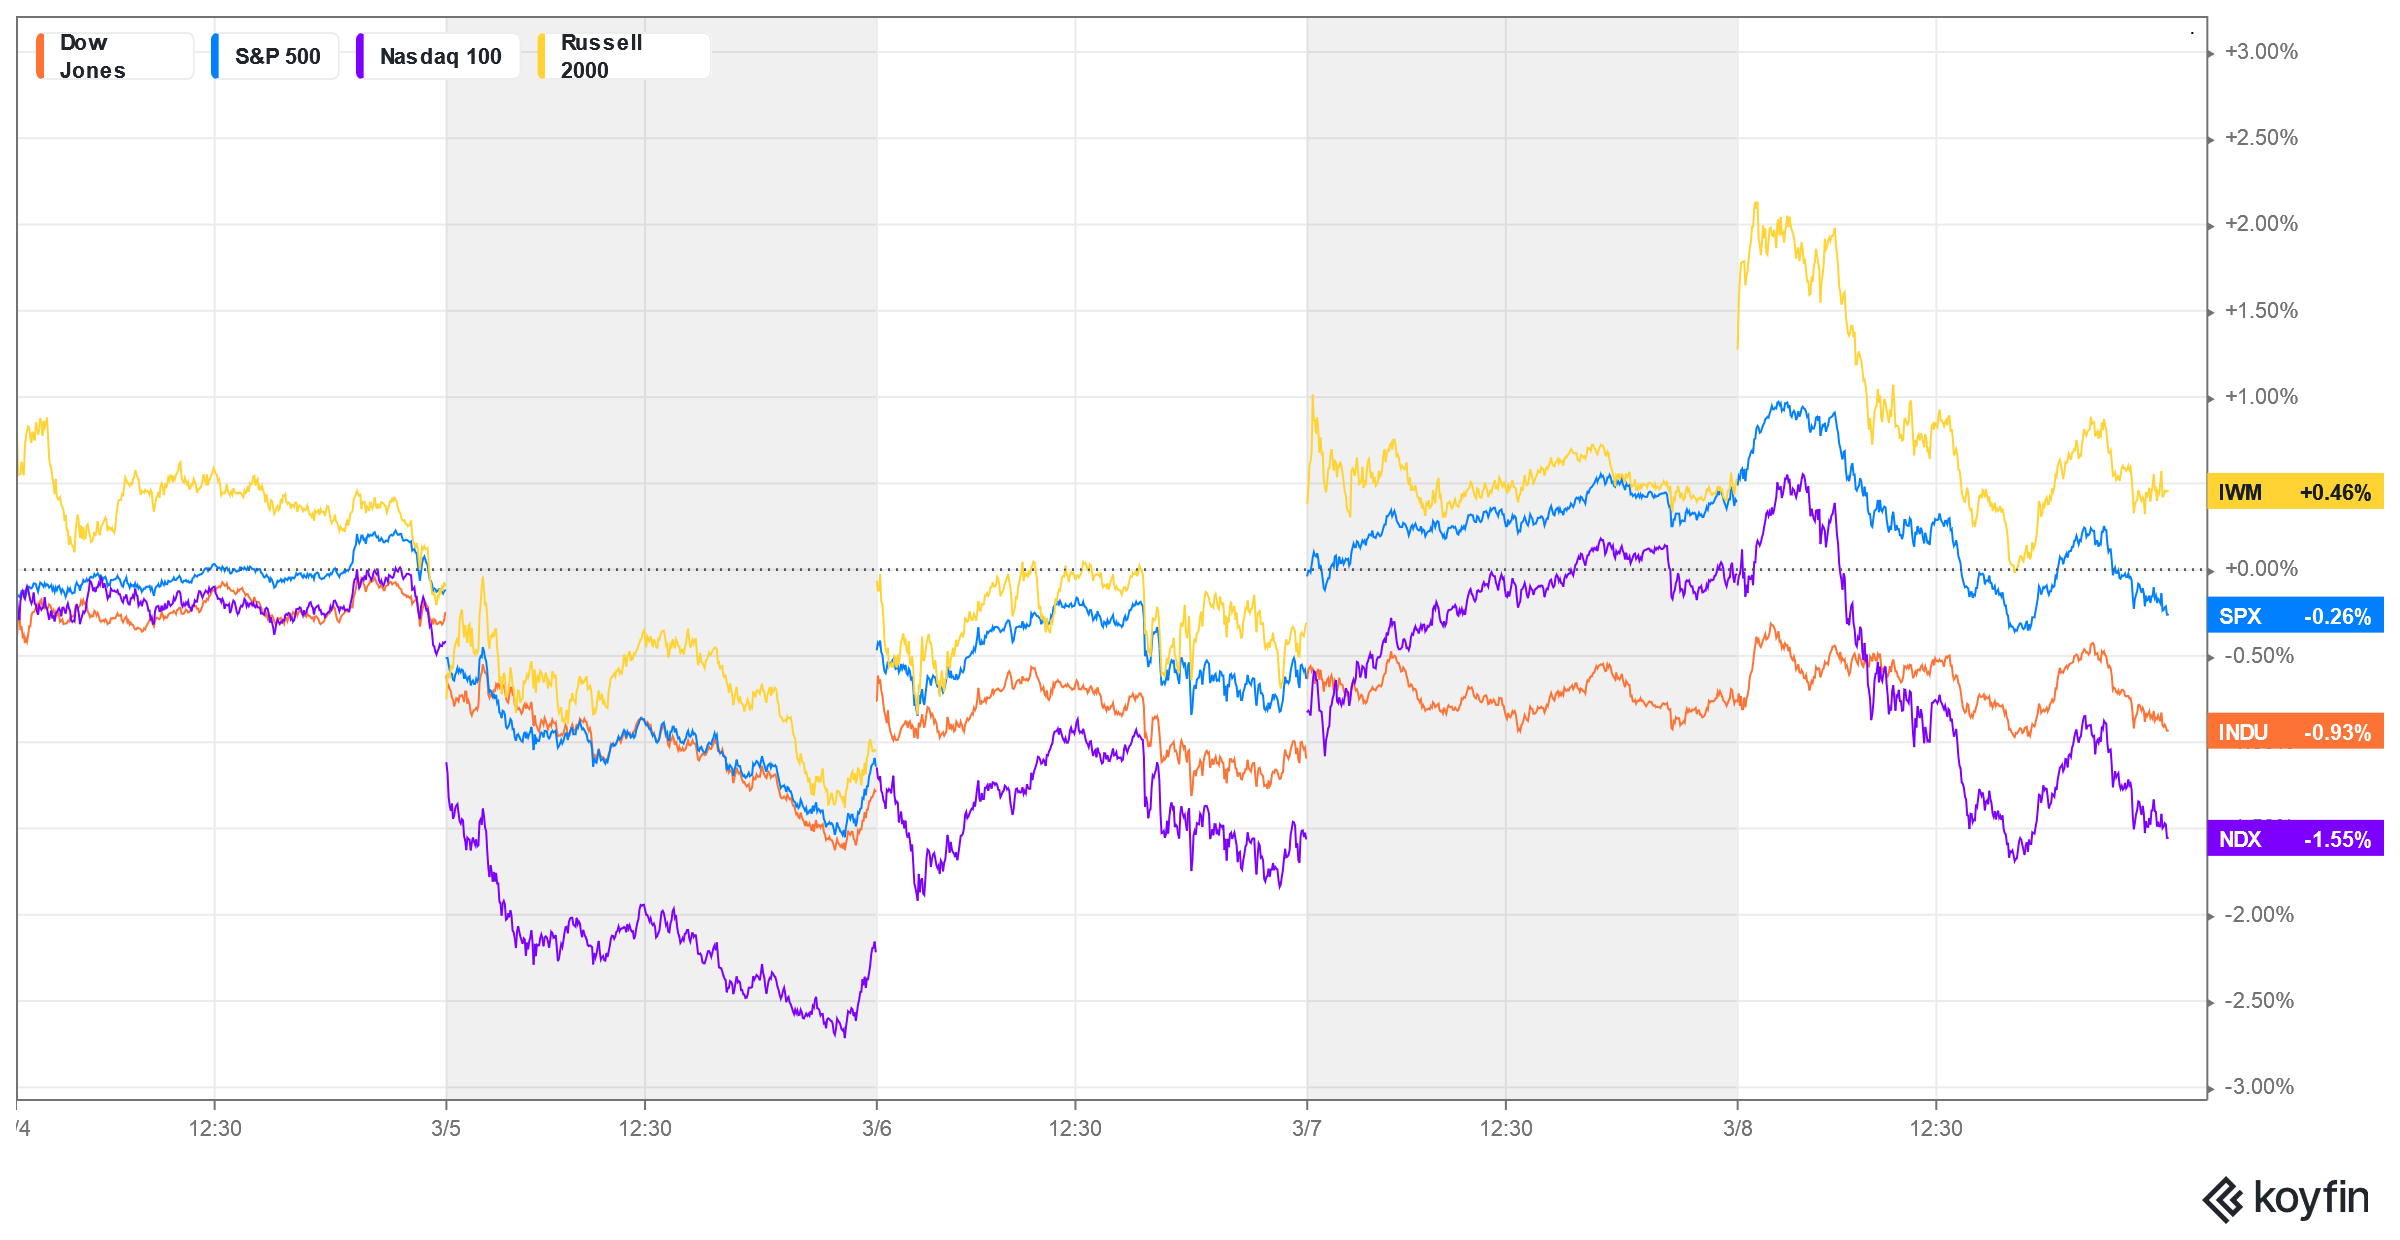
Major Indices Week of March 8, 2024
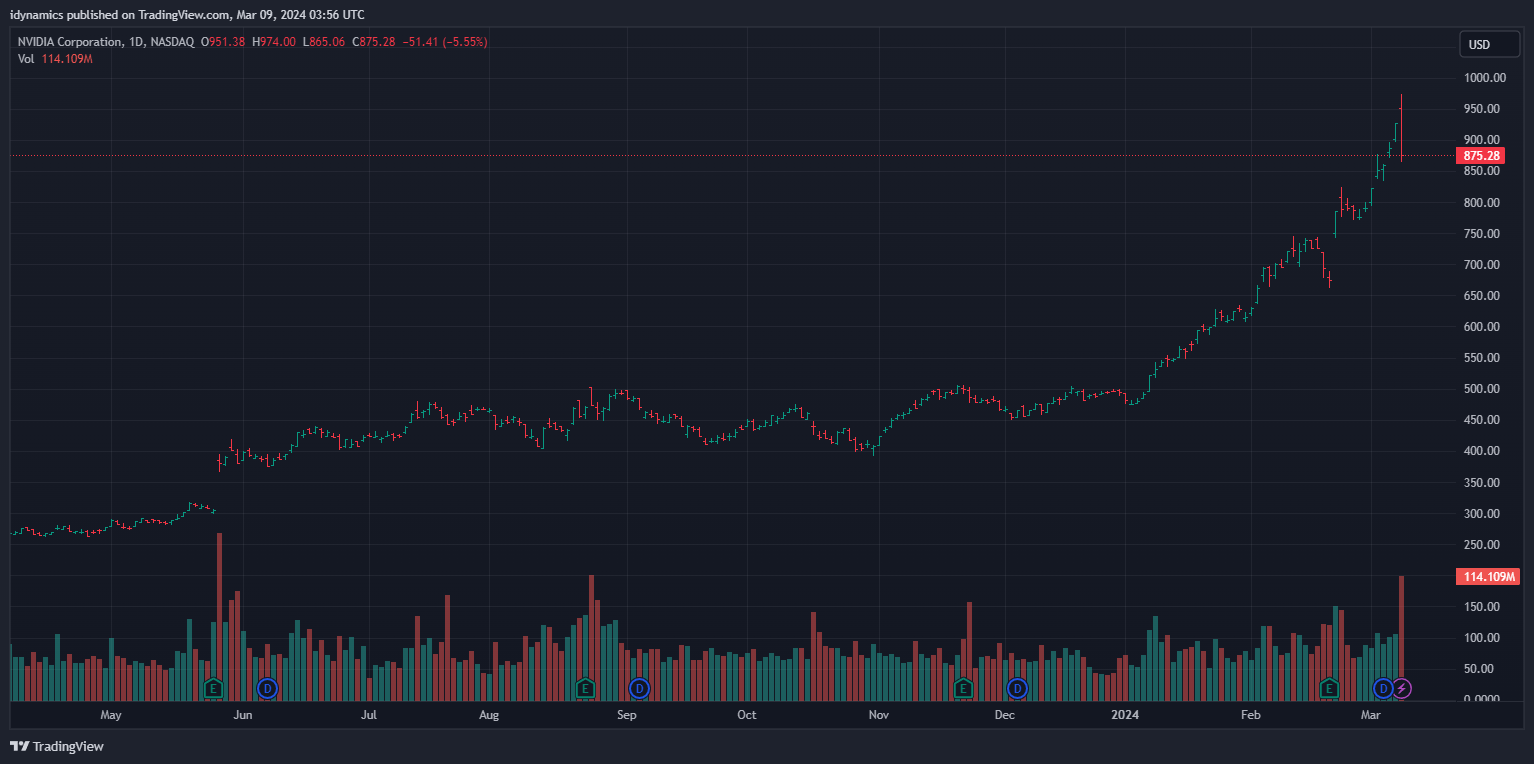
 NVDA Hourly
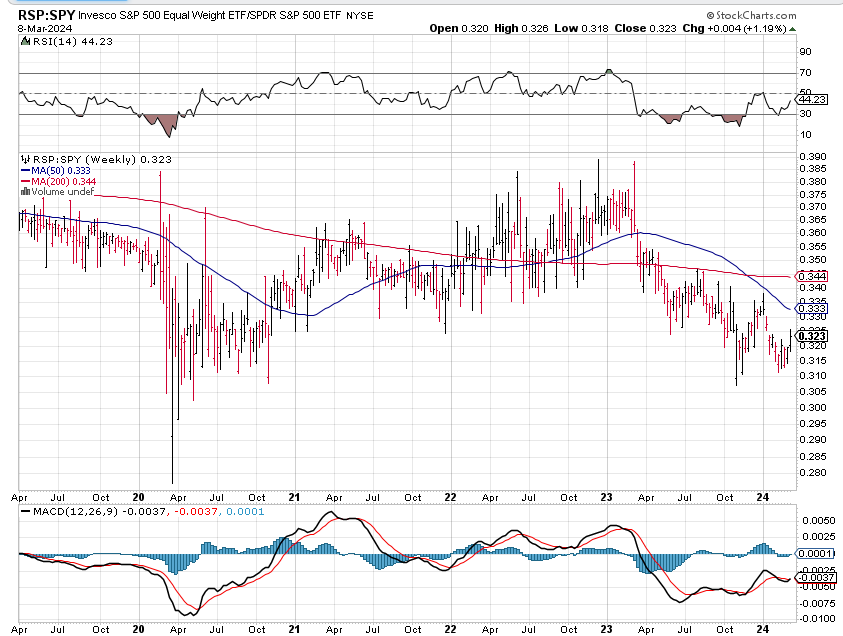
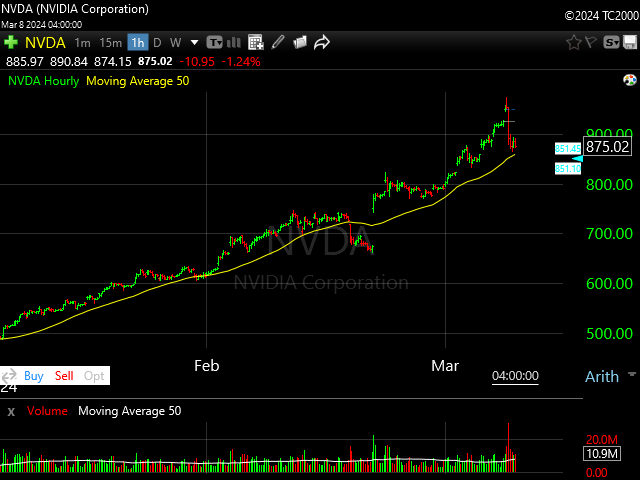 Stocks closed mostly lower with Friday marking new record highs for some indexes, NVDA, and then a massive loop-the-loop, outside day down as prices swooned from the highs. All the major indices ended the week lower with the exception of the Russell which eked out a small gain, keeping the potential double bottom in the RSP:SPY alive.
 Three very critical things must be acknowledged now.
- Sellers have gotten a foothold and have found an area for battle, notching a few wins the past two weeks.
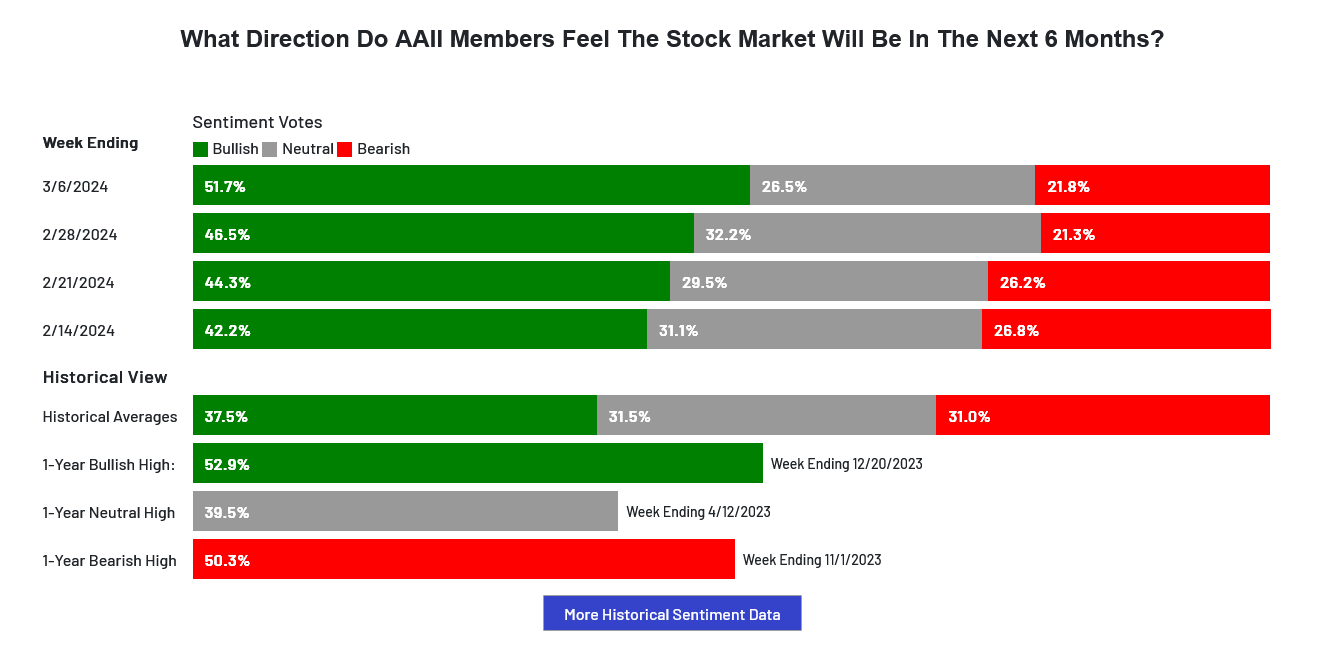
- Sentiment remains greedy/frothy with the AAII setting one of the highest levels of optimism in quite awhile.
- The weeklies are overbought and the dailies, while they may be in a running correction, are dealing with bearish divergences on the oscillators.
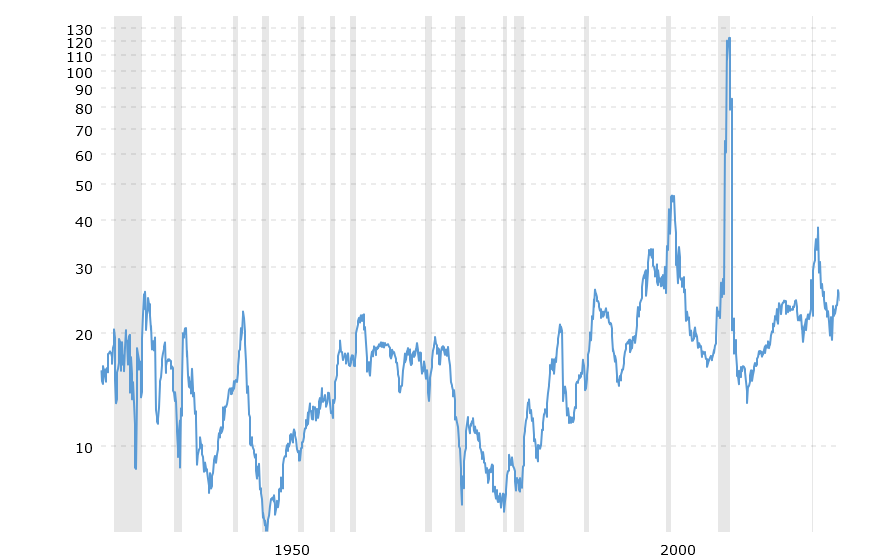
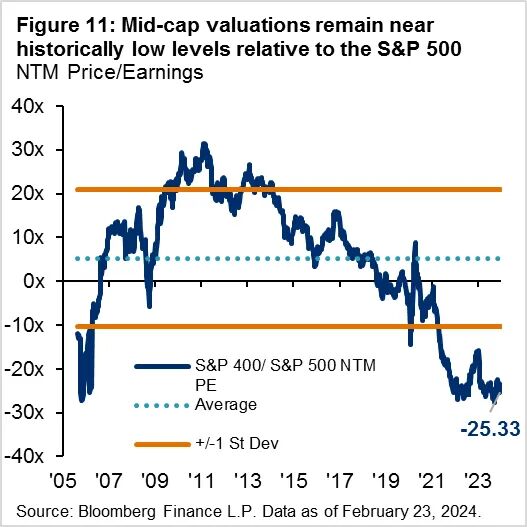
S&P Price to Earnings Ratio
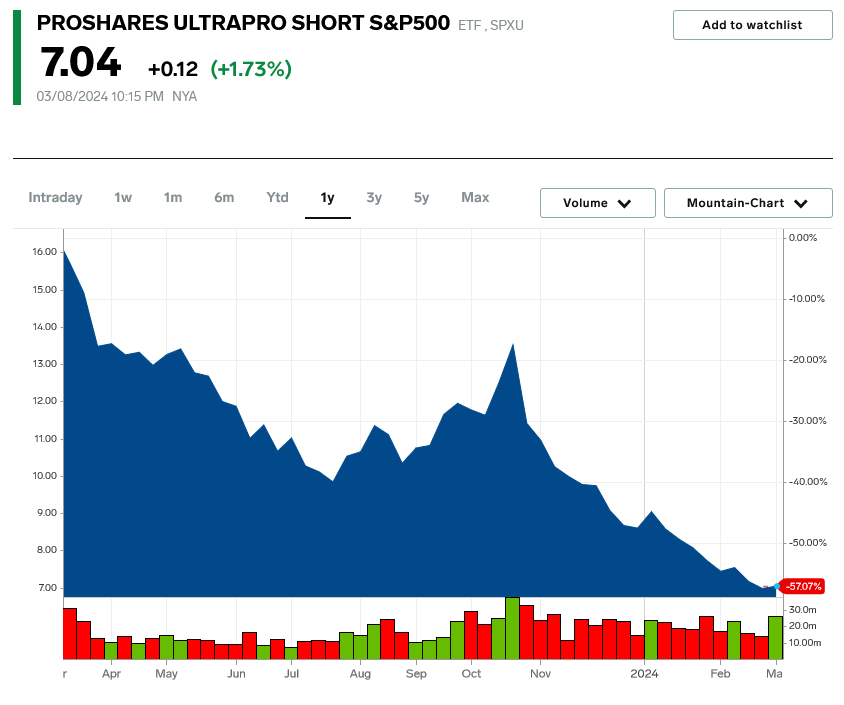
 UltraPro Short S&P500
 Dow Jones Momentum
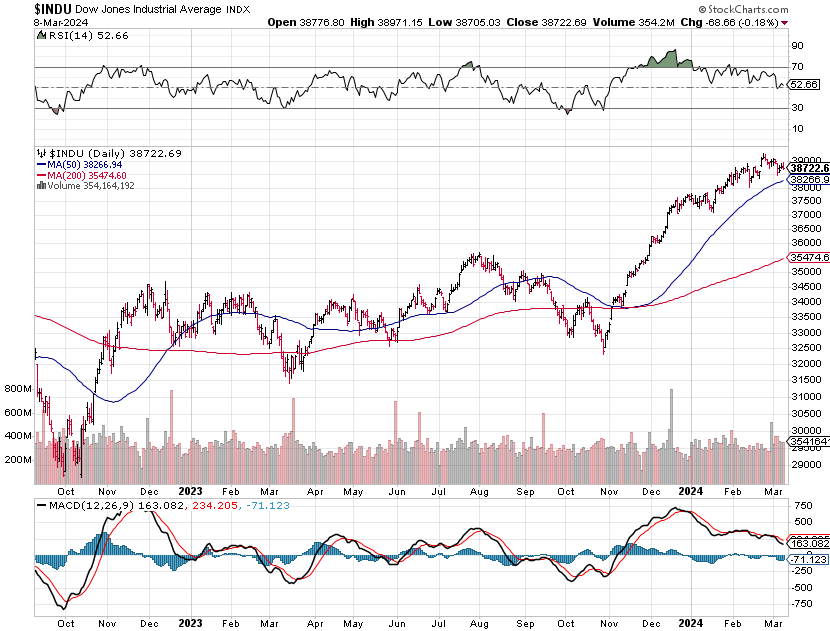 This means, short-term, some extreme caution needs to take place. Indeed, between now and the end of April there is some of the most critical cycle timing in more than a few years and price swings could potentially get quite manic as we move toward the end of March. While some technical indicators are flashing caution, there still is no sign of massive volume ‘blowoff’ or manic type activity. That said, Friday was a high volume blow off and plunge in the current ‘darling’ ($2T stock), NVDA (see hourly above). The Dow momentum continues to look more like mid-trend than any type of significant extreme. In addition to the P/E being historically low, mid-cap valuations remain near historically low levels.
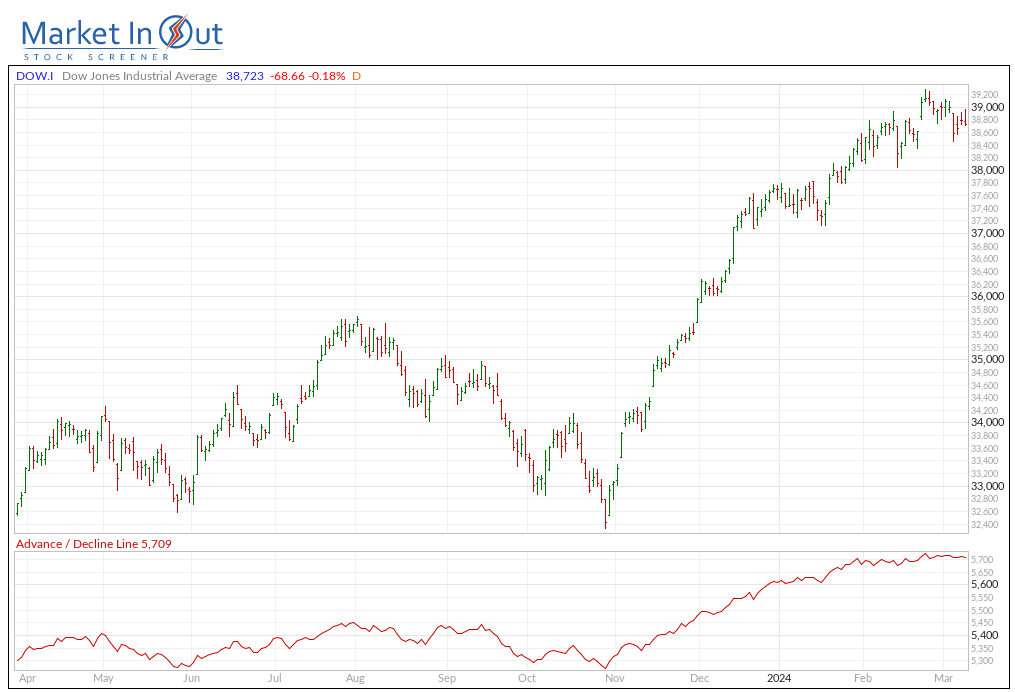
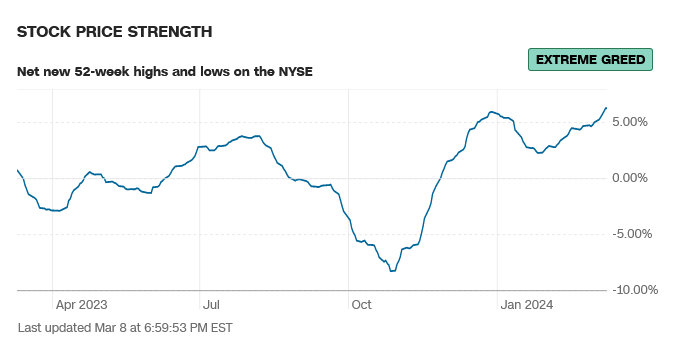
 52-Week A/D Line
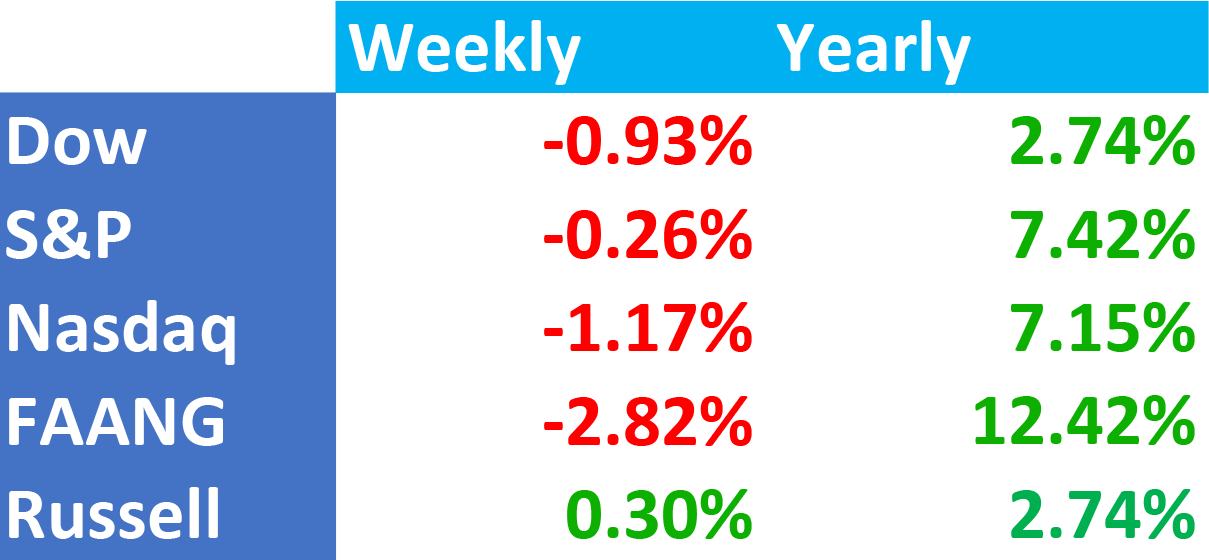
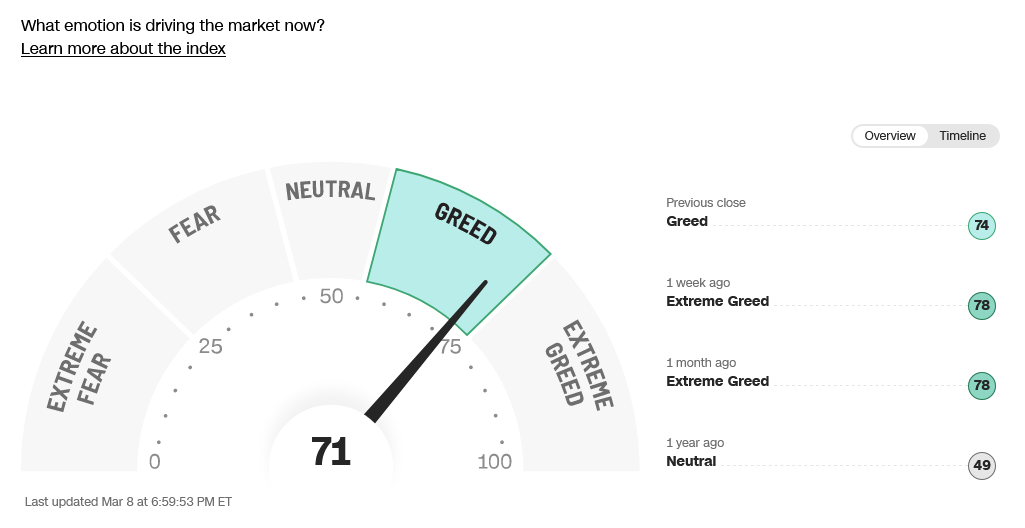
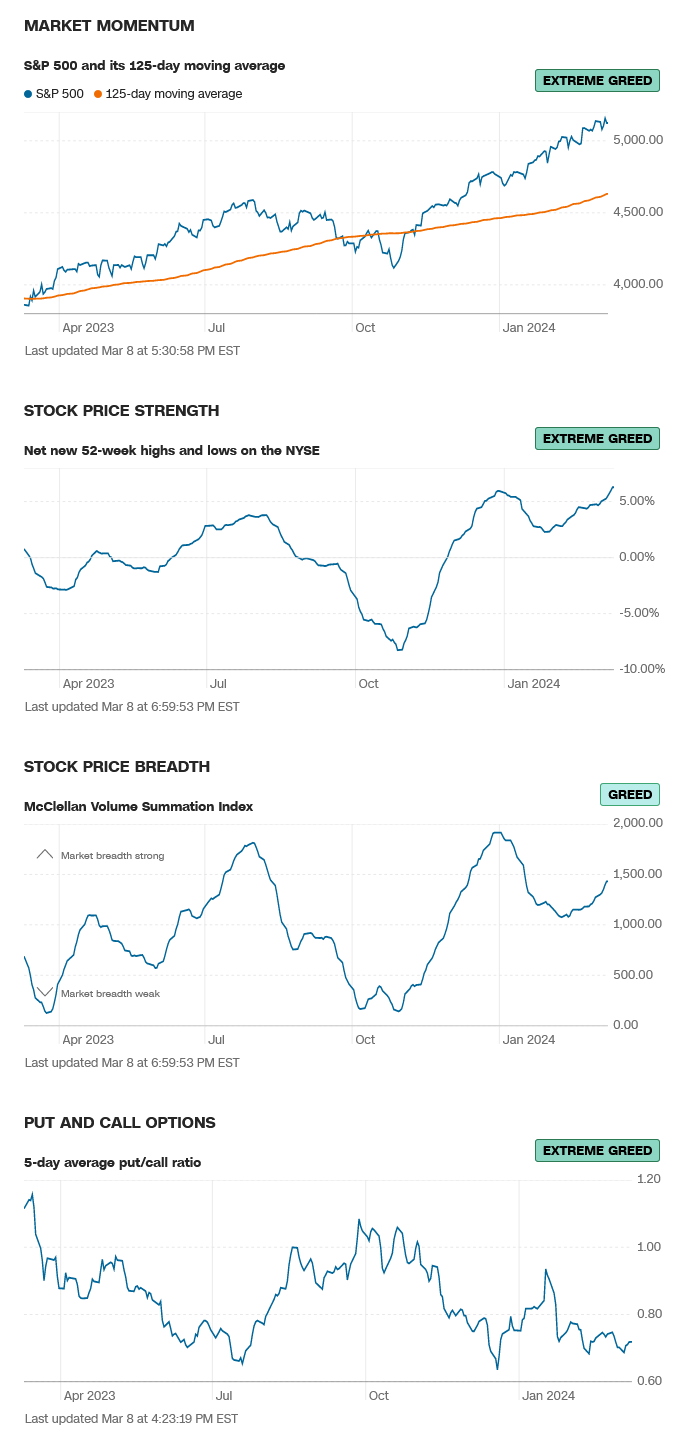
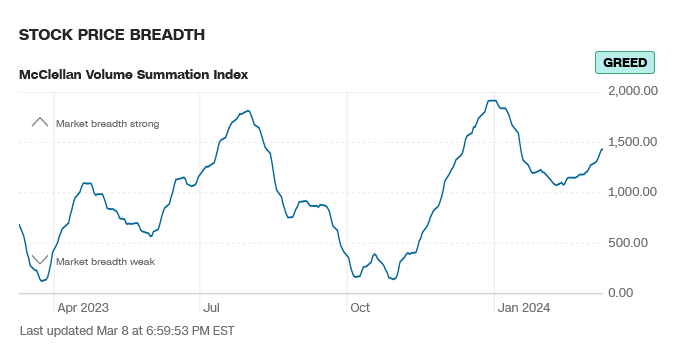
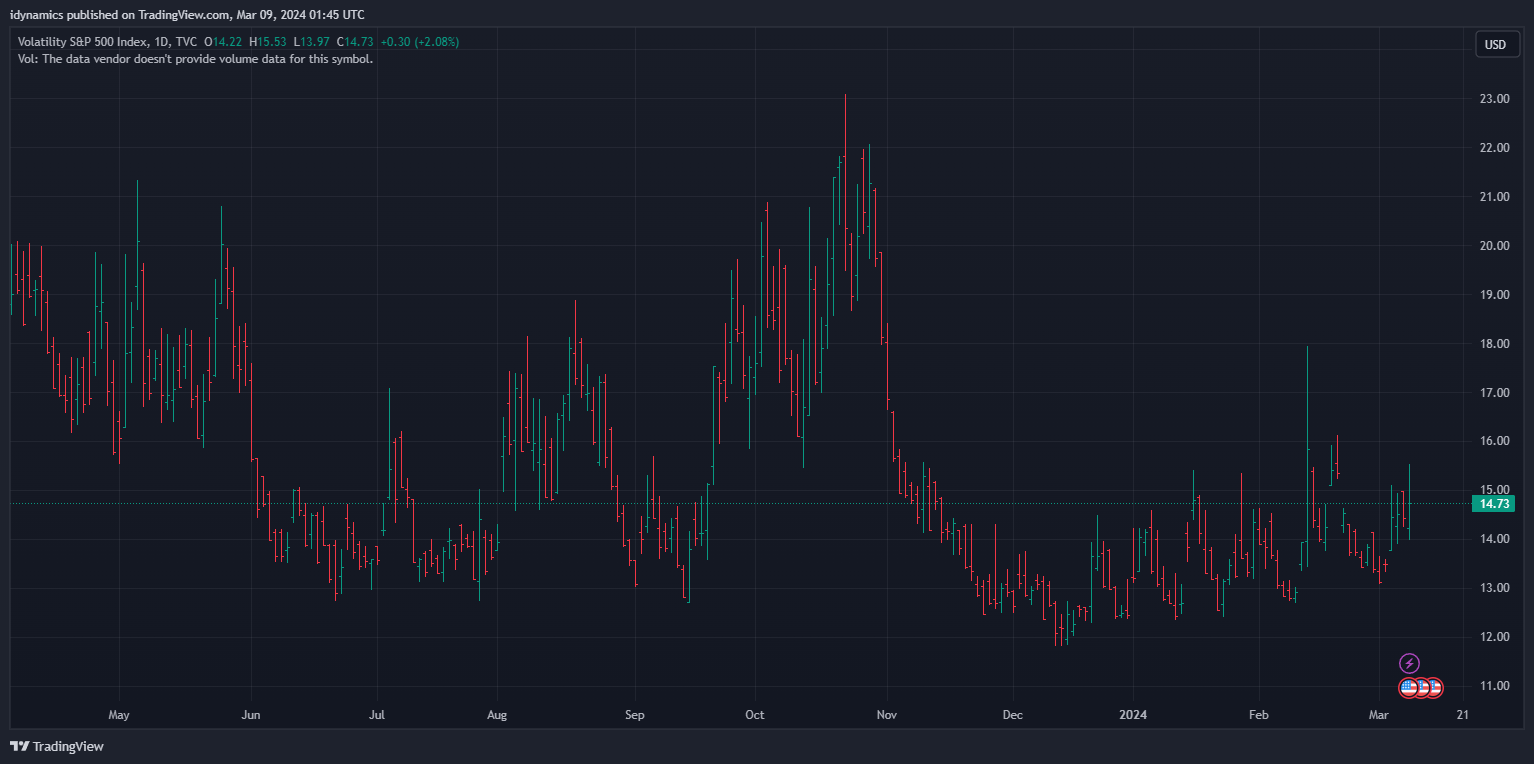
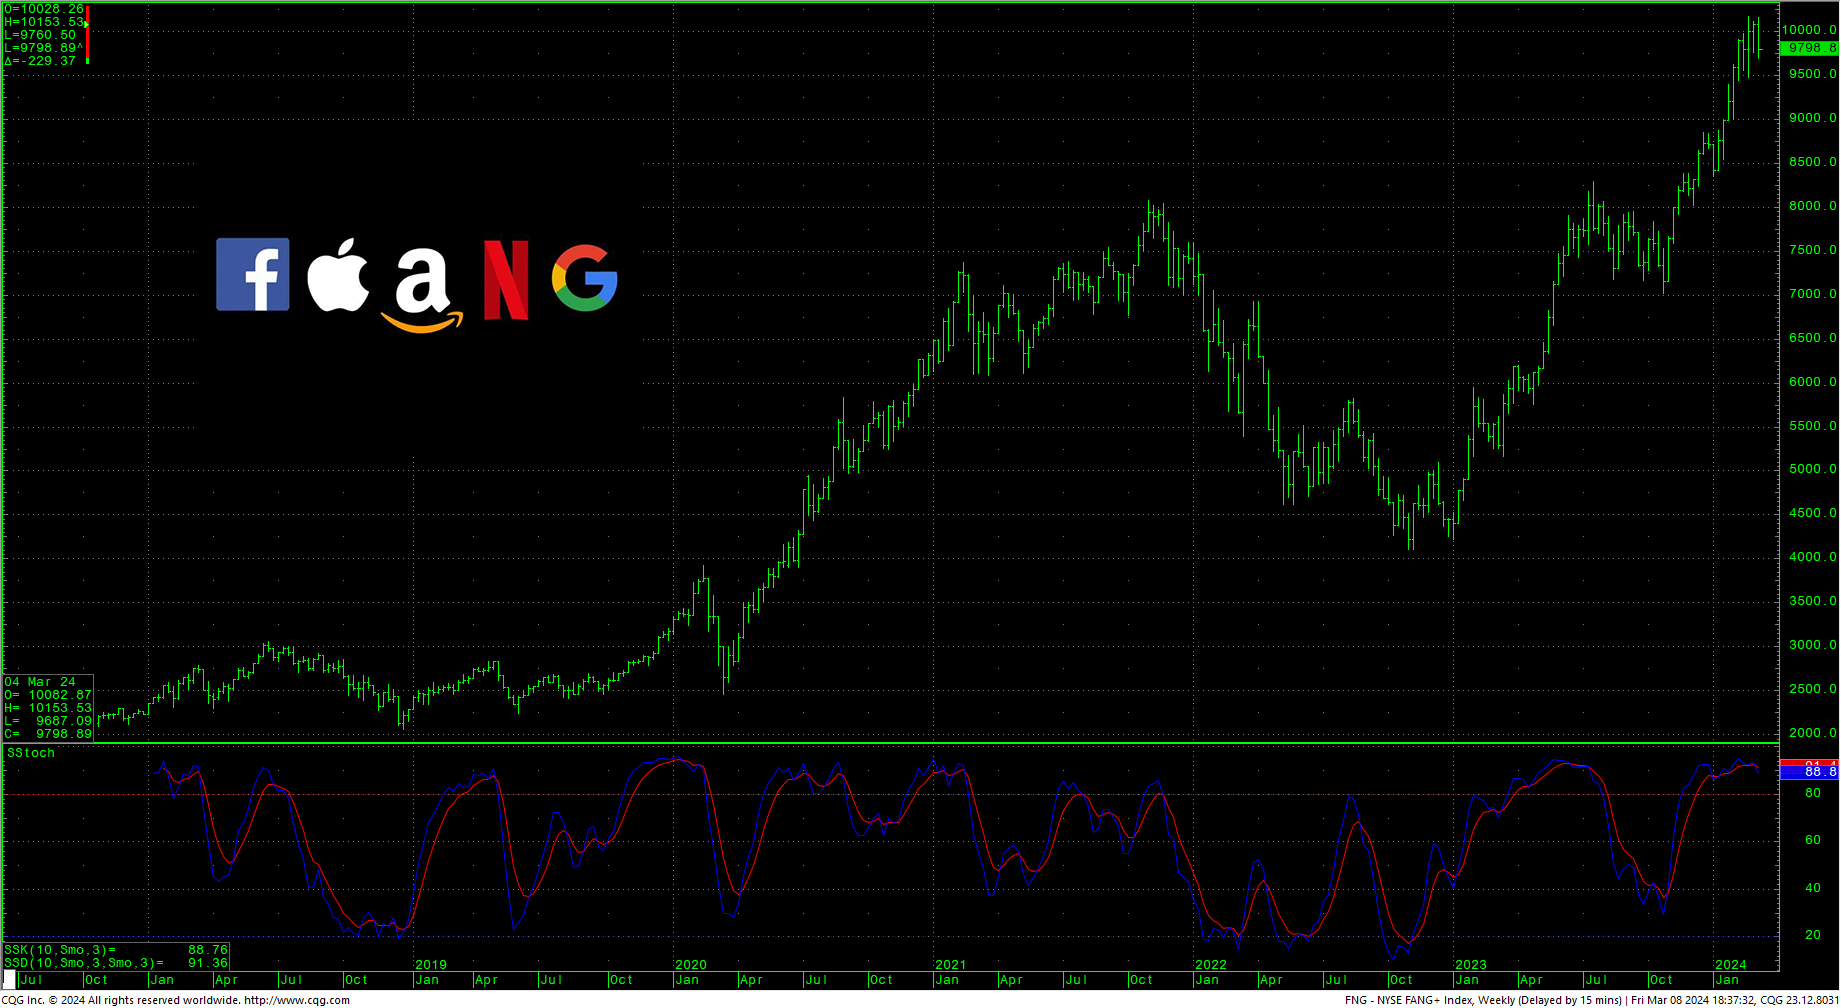
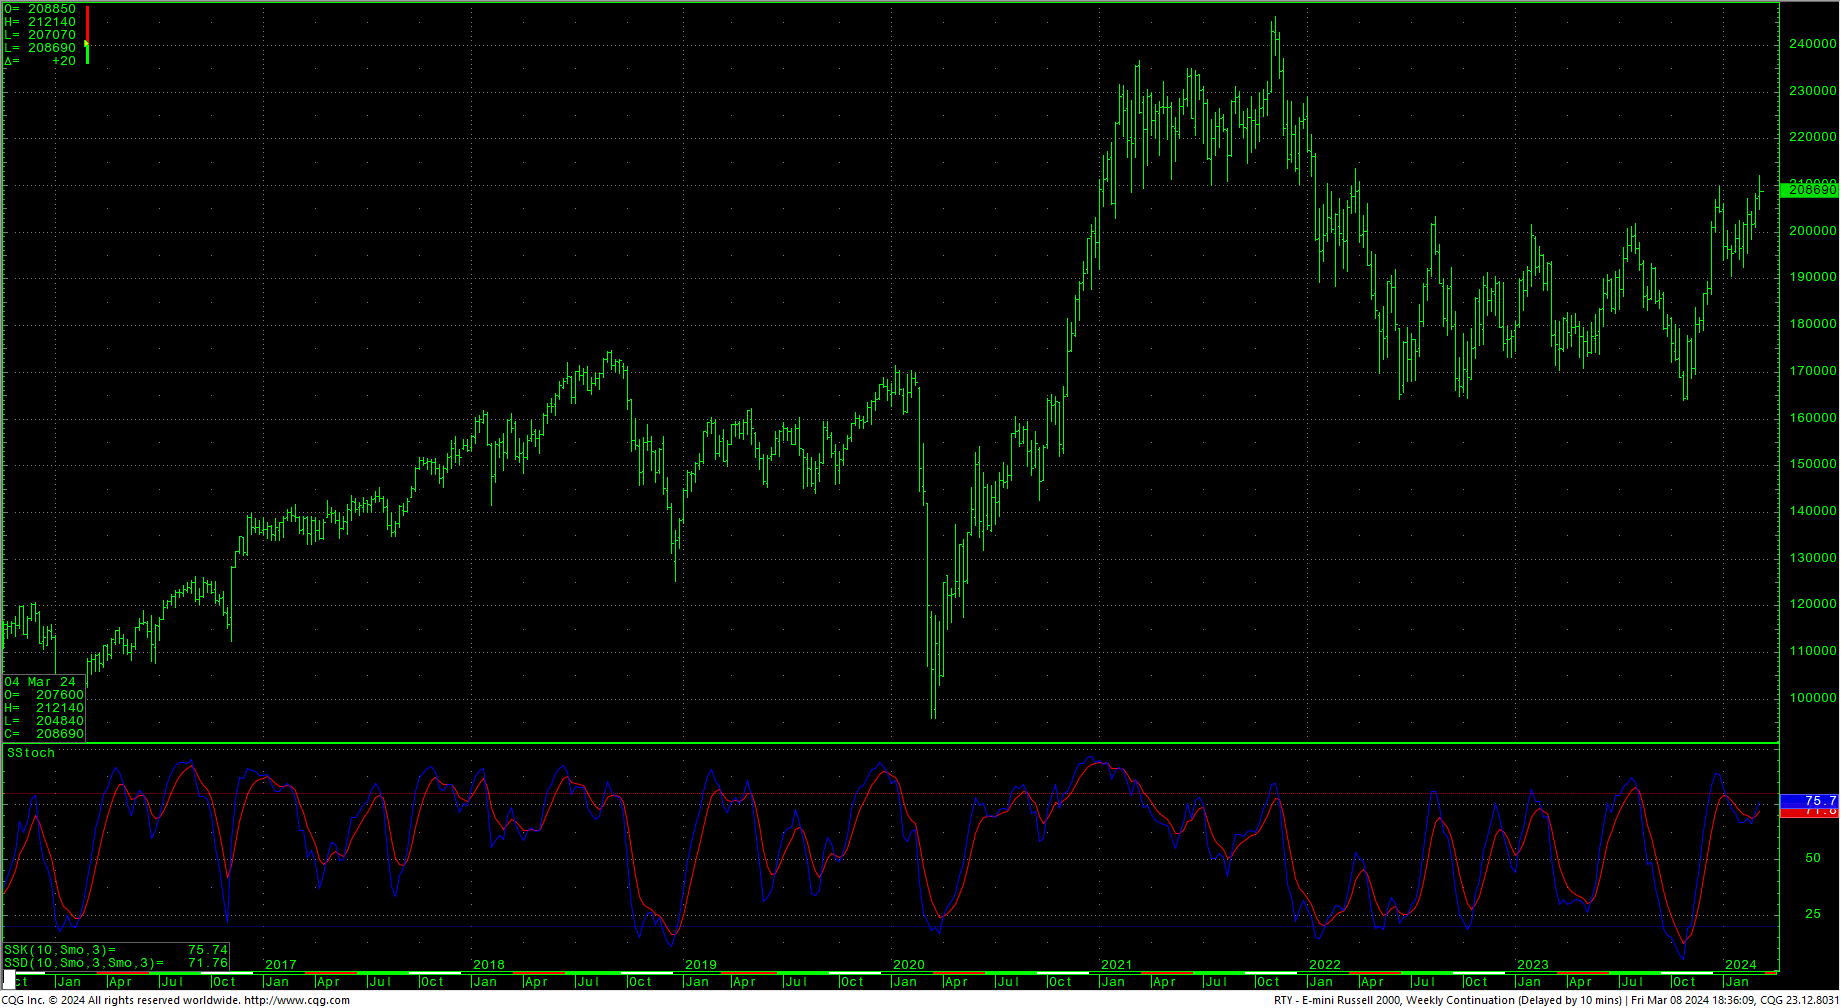
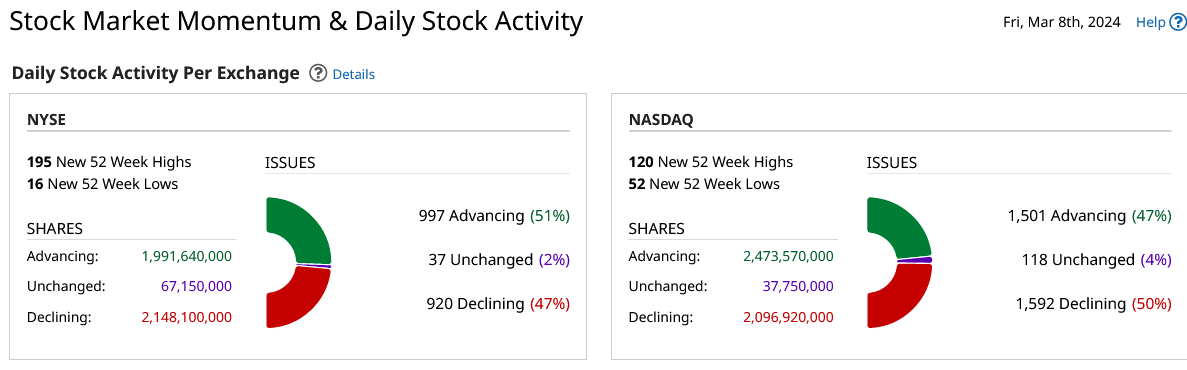 Sentiment indicators remain in greed/extreme greed readings with breadth greedy but still short of the highs set earlier this year. Last week in the AAII Sentiment Survey: Optimism Rises to Unusually High Level. The Dow A/D line moved down marginally to 5709, coming off the record highs, indicating greed (The Dow is now down -1.04% from its record high close on 23 February 2024.) The VIX closed higher, in the upper end of the range at the highest close since 30 October 2023. The Put/Call ratio is at 0.72, reflecting extreme greed. The 52-week, A/D moved up to +6.28% and indicates extreme greed…as that indicator hit a new high for this bull drive. The Dow closed the week down -0.93%. The S&P set record intraday highs, then ended lower -0.26%. The Nasdaq ended the week down -1.17%, the FANG dropped sharply, closing the week down -2.82% and the Russell closed the week up +0.30%. The 10-year notes rallied and closed on the high end of the week’s range with the yield dropping to 4.077%. For S&R, see the latest Special Report.
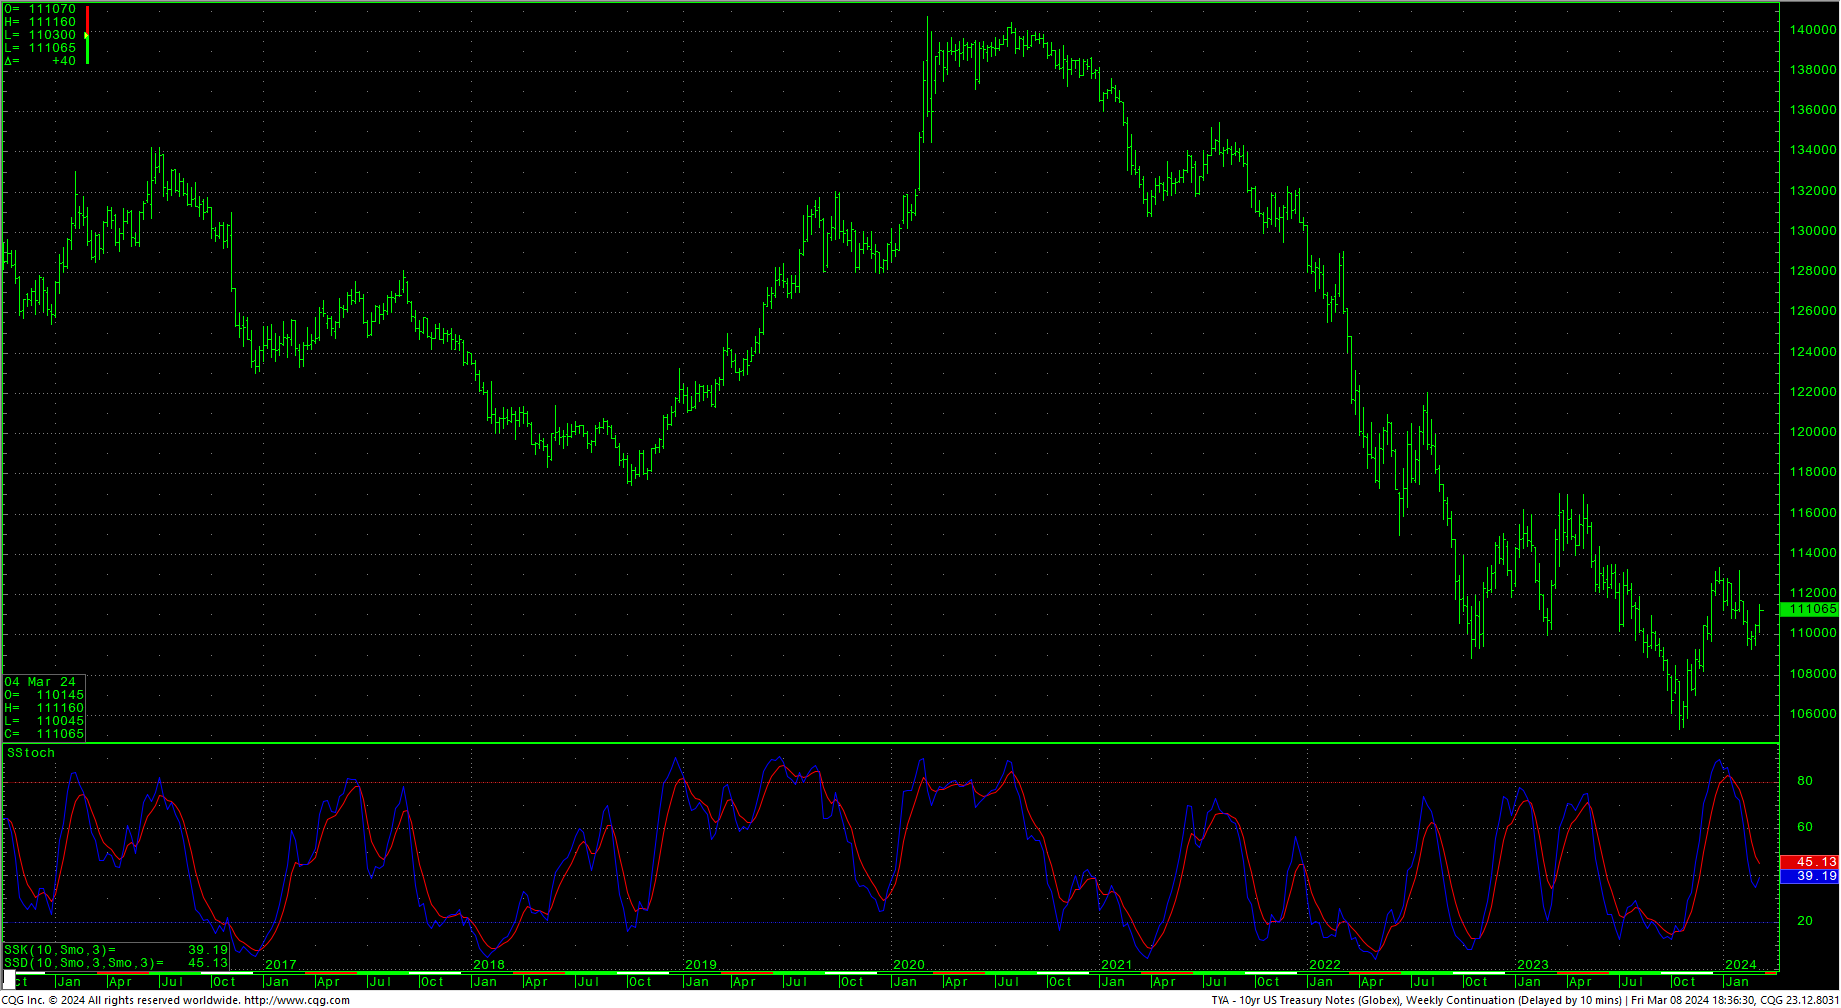
USCI Commodity Index
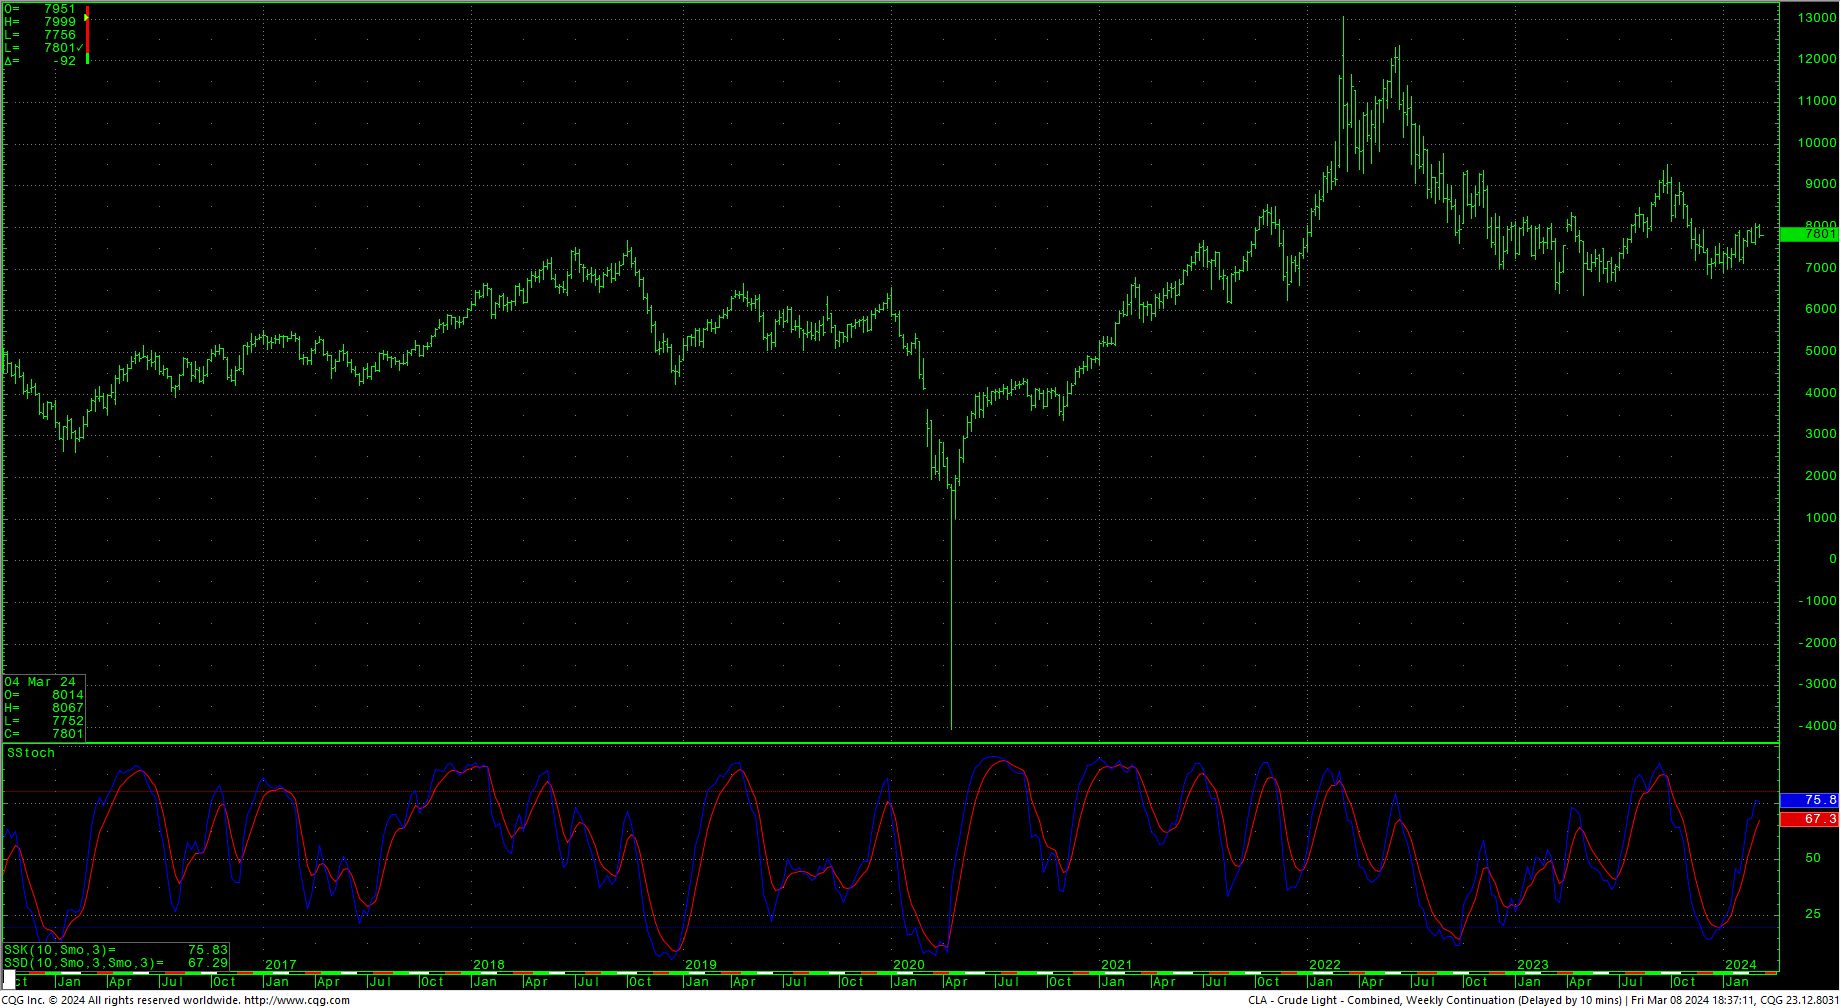
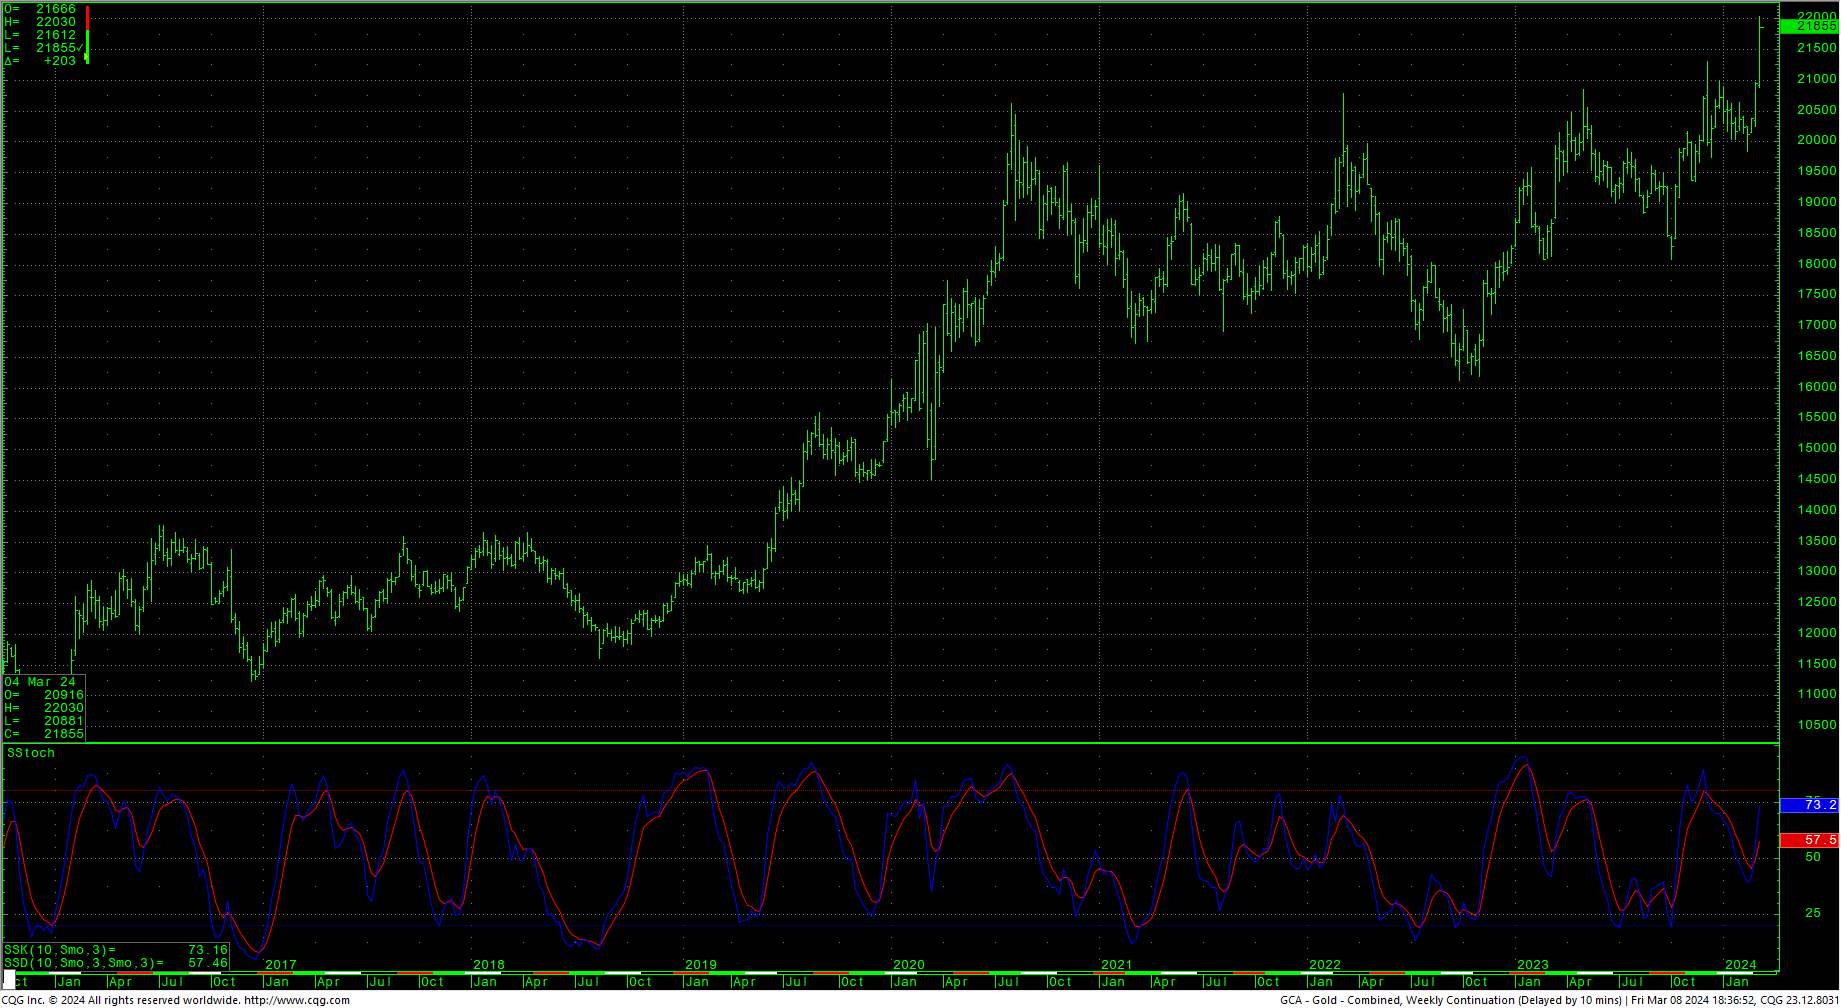
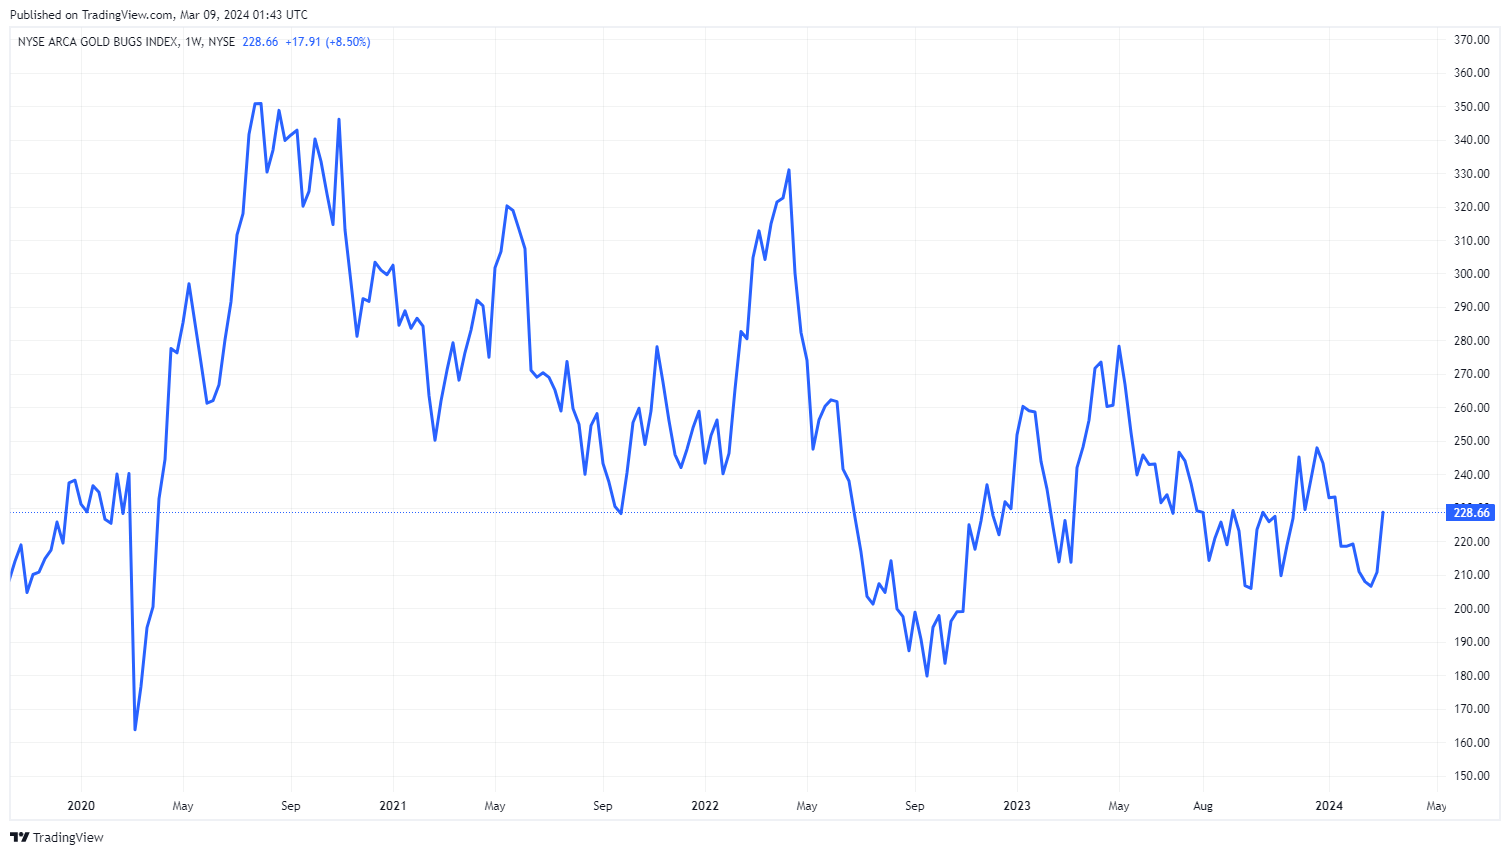
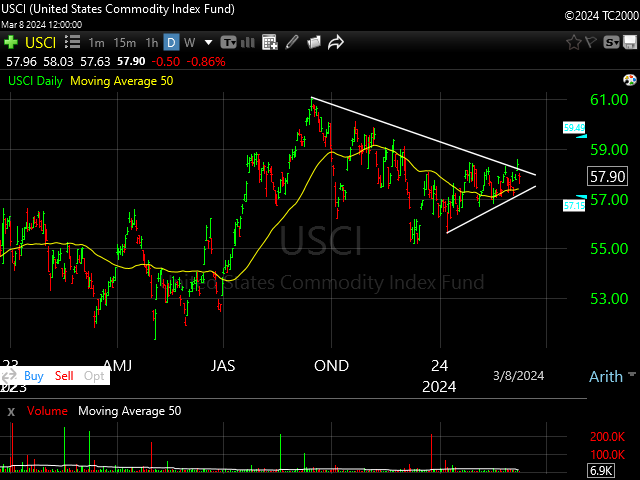 The USCI Commodity Index broke out above the upper end of a massive triangle and then immediately dropped below the trendline. The CRB closed flat, down -0.08%…as crude oil staged an inside week and closing on the lows. Gold continued its explosion to record highs and closed in the top end of weekly range. The Gold futures are far outpacing mining stocks, and the HUI Gold Bugs is seriously trailing the futures markets. The CoT still mostly looks like speculators selling while commercials are long.
Timing Points
Tuesday marks minor timing. The next strong timing date is the 19th. The period between March 19th and April 30th represents some of the strongest long-term timing in more than a few years.
- 03/12 **
- 03/19 *** X Key
- 03/25 **
- 04/04 **
- 04/10 **
- 04/15 **
- 04/19 *** X
- 04/29-30 *** X Key week for financials
CNN Fear & Greed Index
 AAII Investor Sentiment Survey
 Dow Jones Industrial Average Hourly HLC
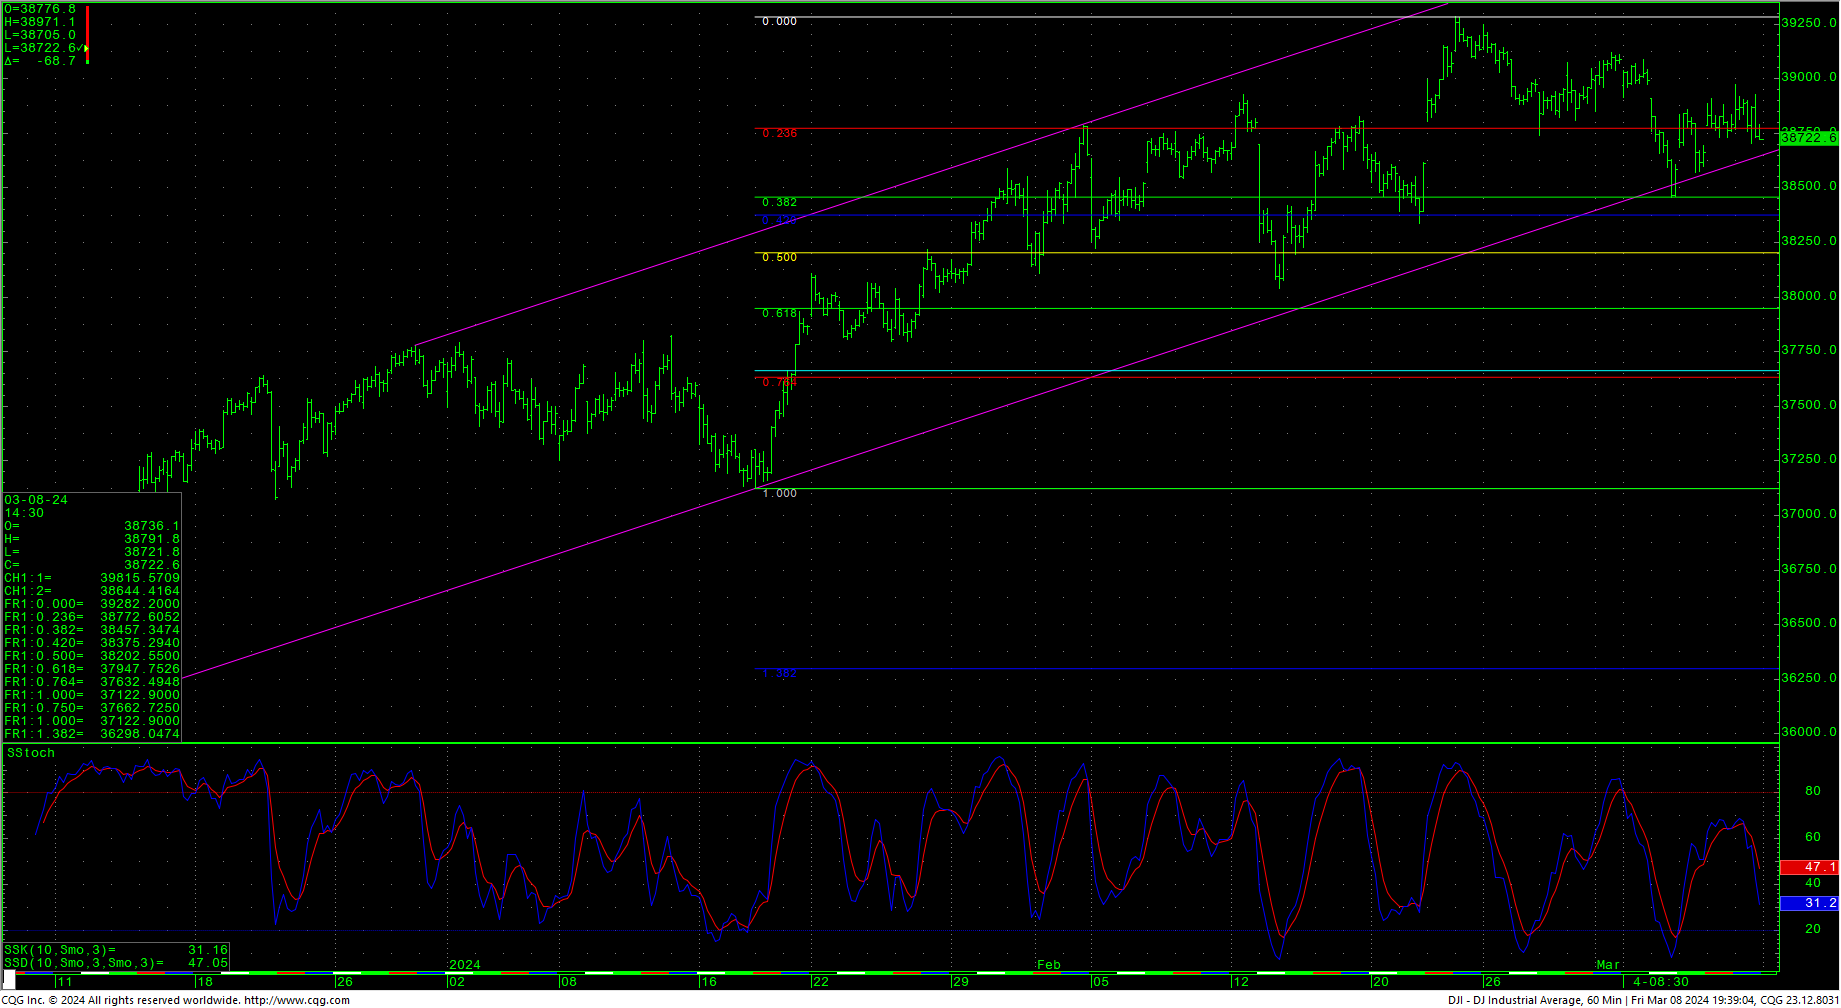 The Dow closed lower Friday at the bottom of the day’s range. The hourly is neutral. The daily is still flashing bearish divergence and the weekly is overbought while the monthly is currently trading an inside month with the stochastics validating the rally. A case can be built for a possible sloping head and shoulders on the hourly. Prices are now back under the longer-term target area of 39075.
Dow Jones Industrial Average Weekly HLC
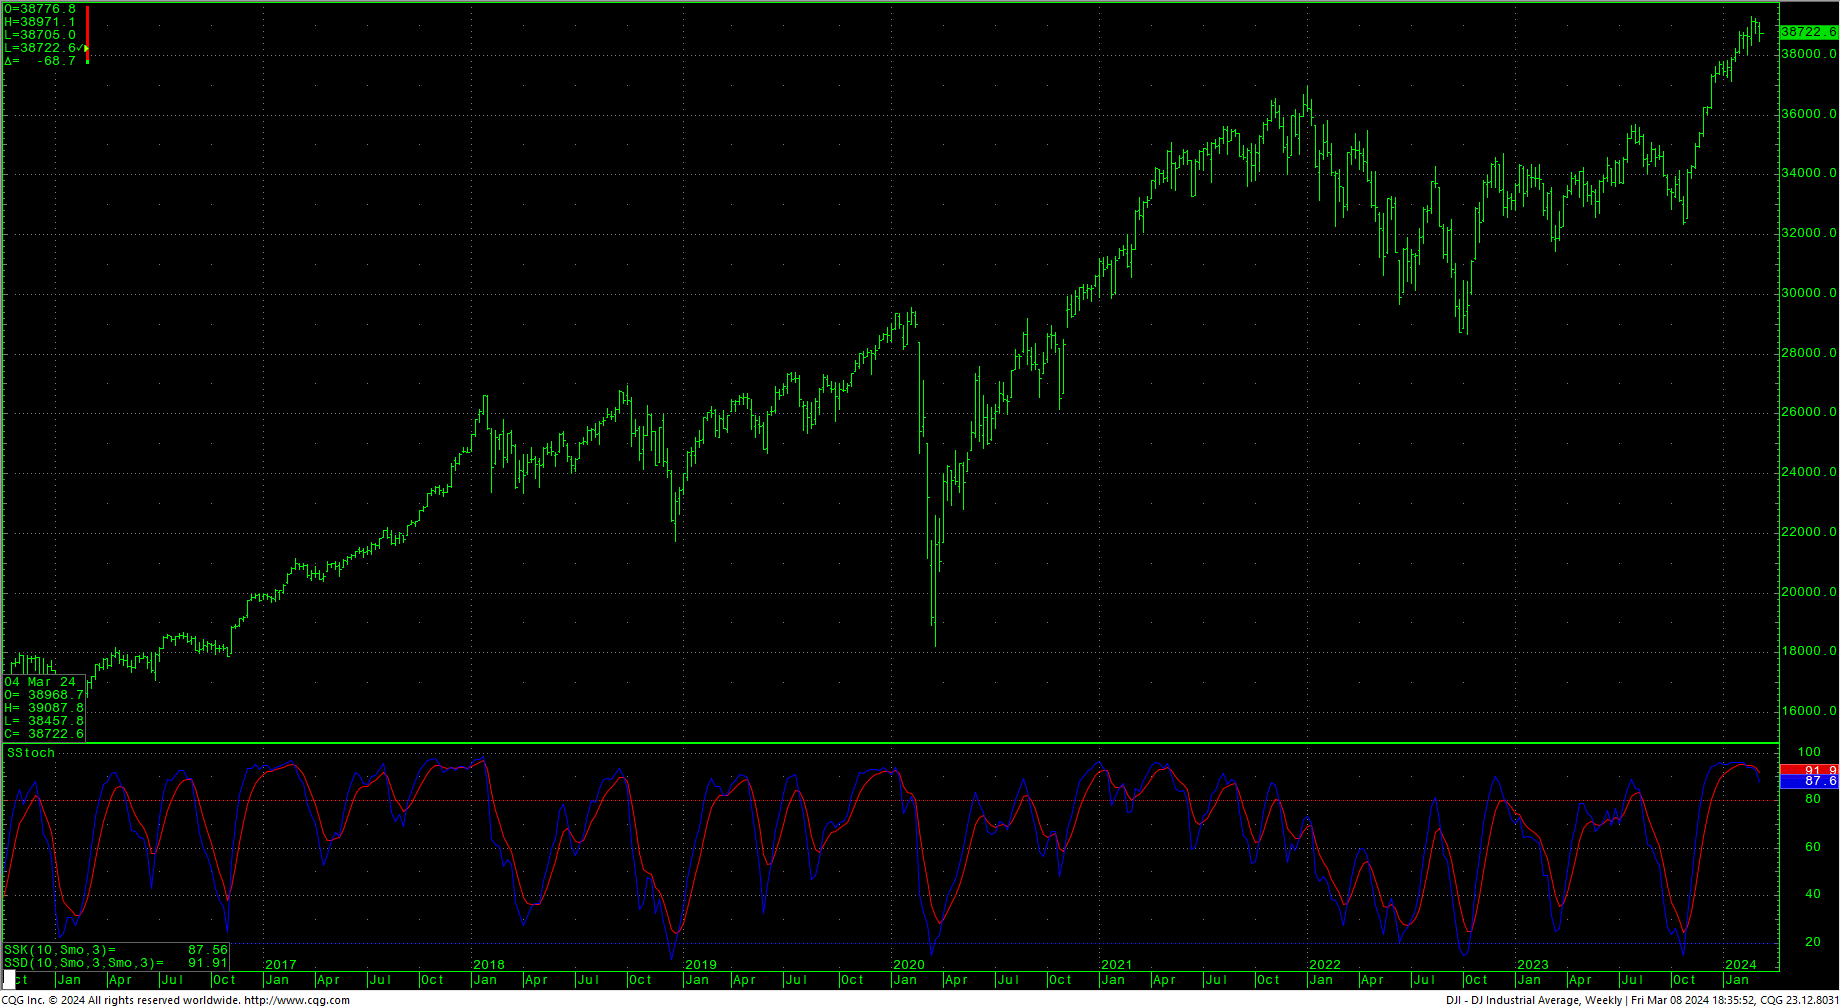 Support is pivotal at 38661/38658. Closes under 38658 setup a move toward 38547/38545. A breakdown under 38545 can test 38457 with counts to 38202 and 38039 with potential to critical short-term support of 37947/37940. Closes under 37940 can carry to 37122 with counts toward critical short-term support of 36775. Closes below 36775 open counts to 35224.
Resistance is 38789 and 38868/38875. A drive over 38875 should test 38954/38971. Rallies over 38971 should test 39075 with potential to the intraday highs at 39282/39283. Closes over 39283 can test 39651 and will renew momentum toward weekly objectives at 40245.4. 40000 is a critical psychological area. Closes over 40245.4 will offer longer-term potential to targets in the 45244 area. Above 45244 gives monthly counts to 47400.
Resistance
|
Support
|
S&P 500 Cash Index
S&P 500 Index Hourly HLC
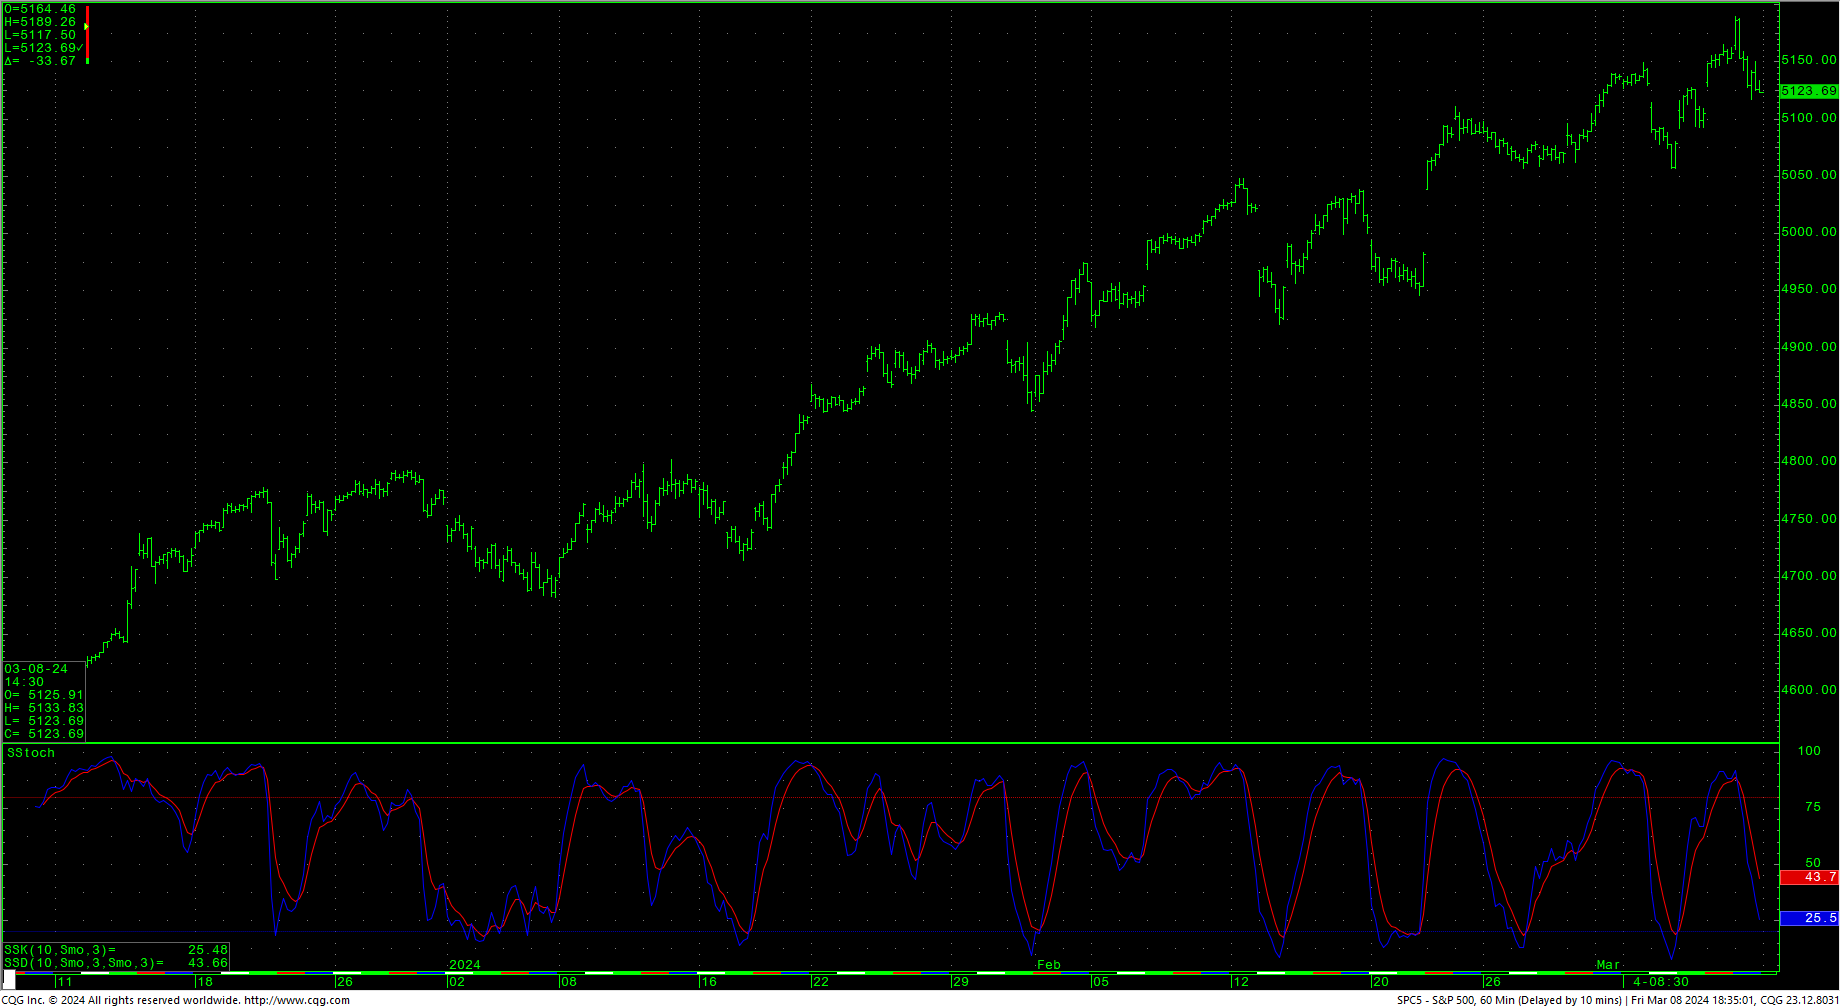 The S&P staged a huge outside day down Friday after prices moved to an all-time record intraday high, falling just short of yet another century mark at 5200 (the intraday high was 5189.26). The hourly ended the day in neutral territory in a down trend. The daily is overbought with some preliminary bearish divergences. The weekly is overbought while the monthly looks bullish. Prices ended back under the 5144-target area.
Resistance is 5144, 5154 and 5161/5163. Rallies over 5163 can carry to 5171/5172 with potential to retest the intraday highs at 5189/5190. Closes over 5190 set up a drive to 5288 with counts toward 5432. A breakout over 5432 will open potential to the 5720 area. Closes over 5720 offer upside targets at 6000/6008.
S&P 500 Index Weekly HLC
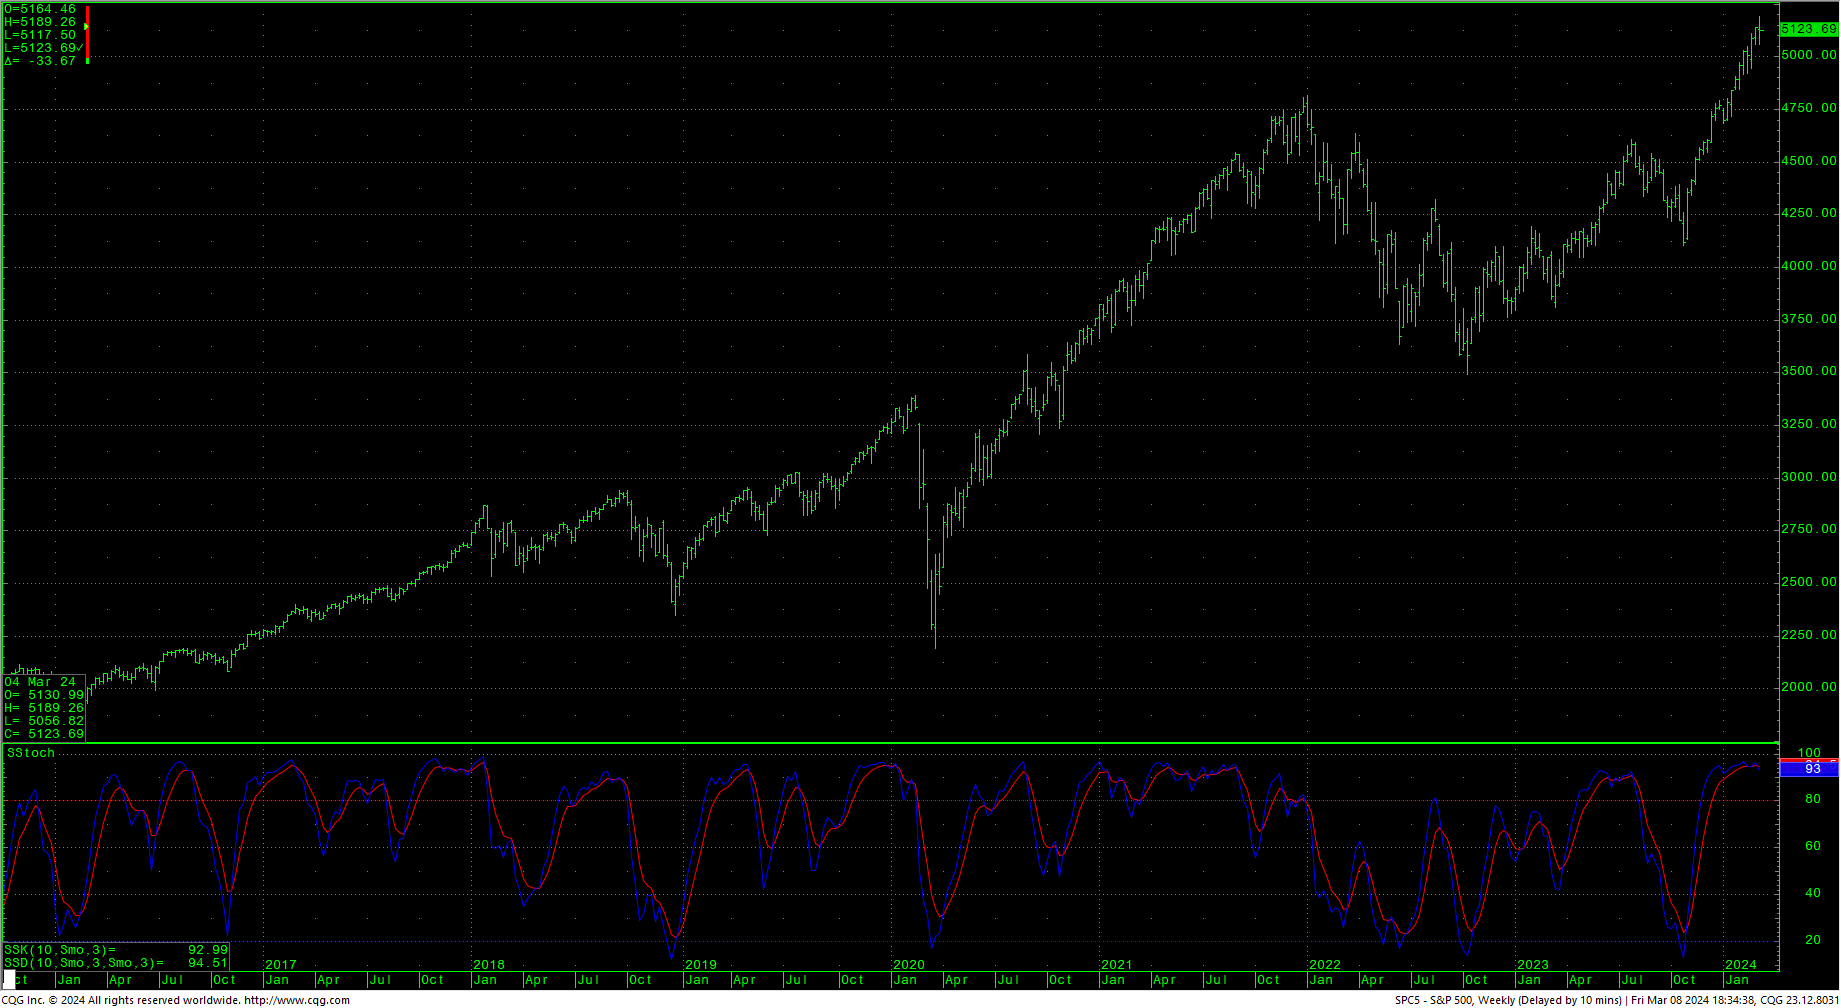 Support is at 5092 though 5080 where there is a gap. A breakdown under 5080 sets up a move to 5054 with potential to 5023/5020 with gap support of 5038. A breakdown under 5020 sets up a move to 4987/4983. Closes under 4983 suggest critical support of 4933/4920. A breakdown under 4920 should test 4774 with potential to 4714. Under 4714 counts toward 4646 with potential to pivotal support at 4518/4510. Daily closes under 4510 count toward 4447 with counts to 4315. Closes under 4315 have potential to critical short-term support of 4121/4115 through 4103.
Resistance
|
Support
|
Charts courtesy of CQG, Inc., CNN, Koyfin, Trading View and AAII


