TECHNICAL ANALYSIS (by Intraday Dynamics)
Are We Heading into March Madness?
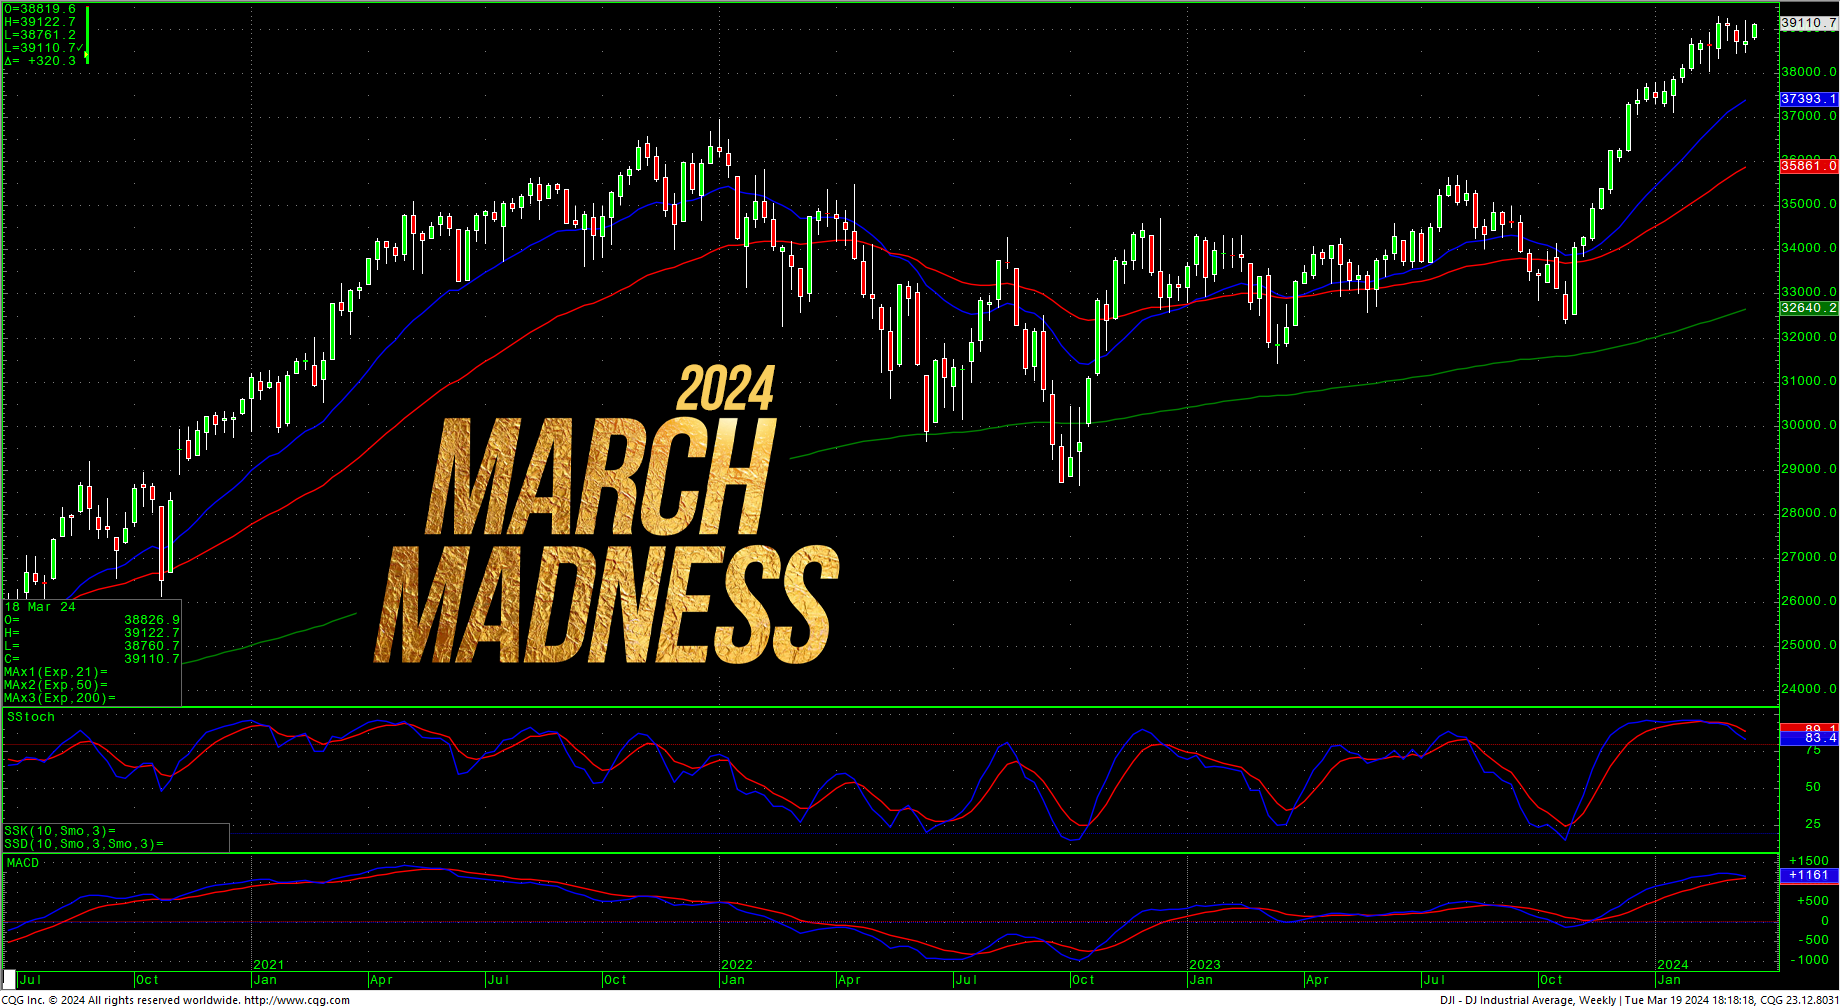
Dow Jones Industrials Weekly Candles
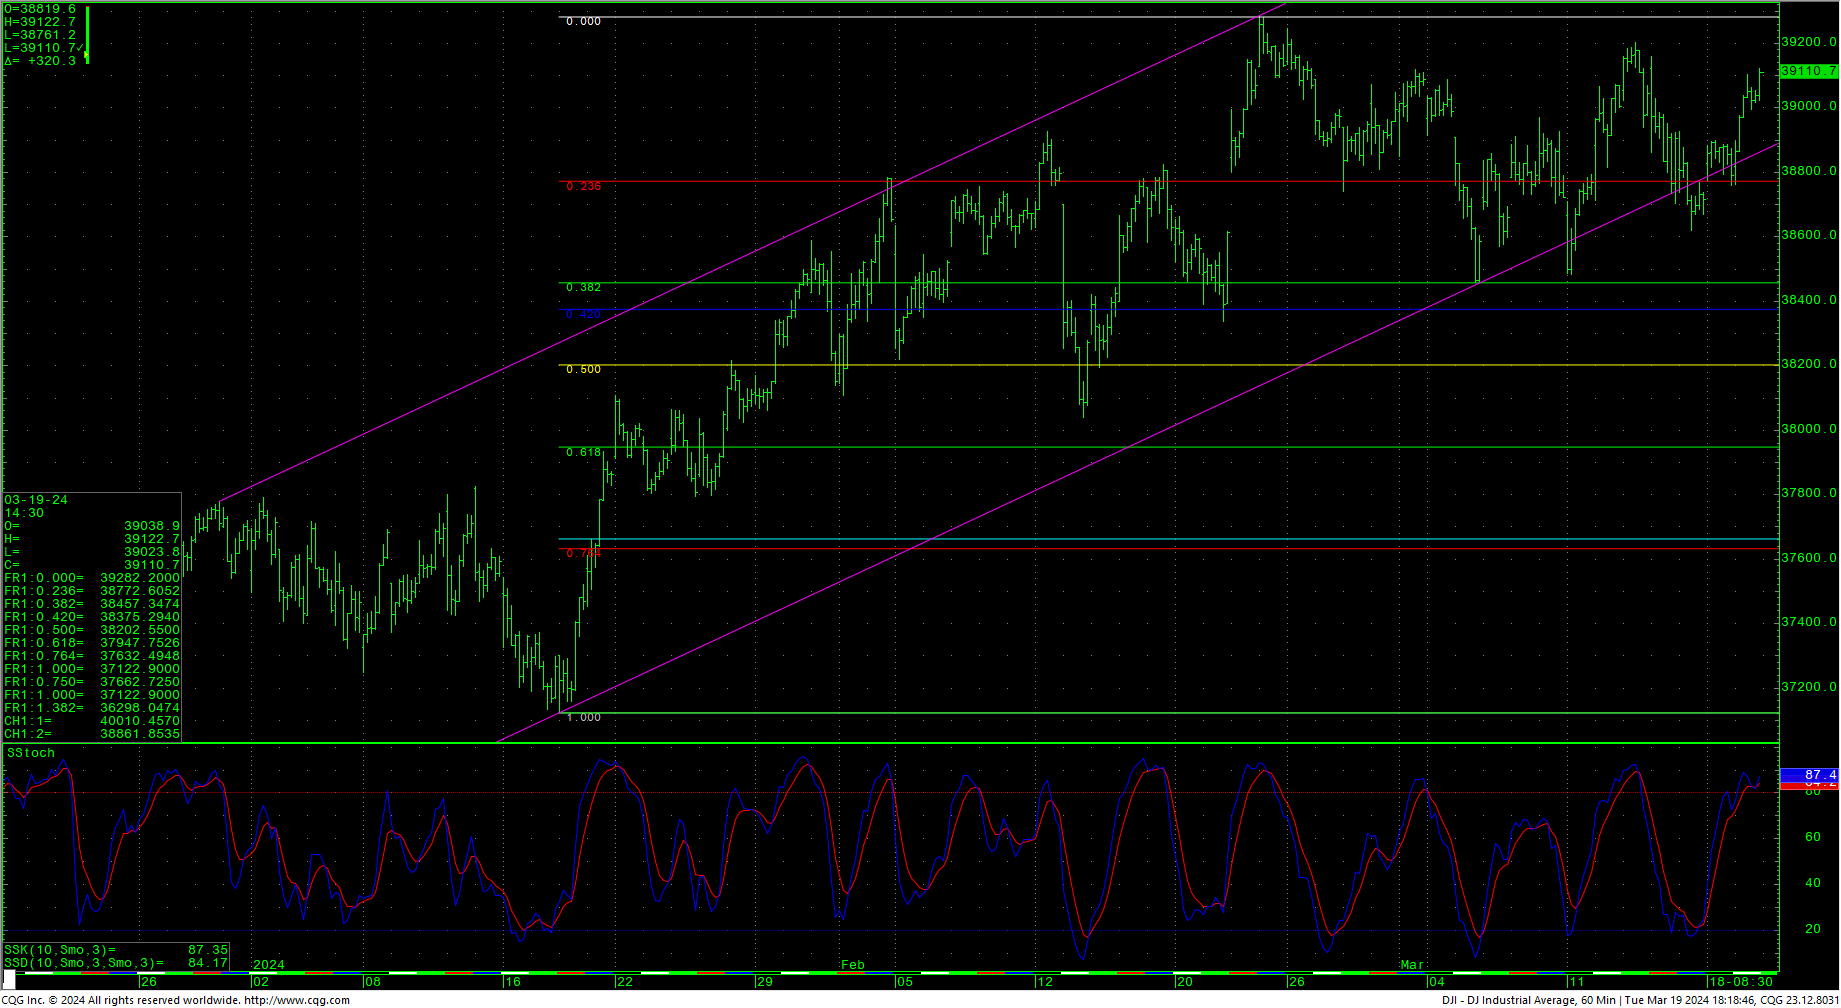
 As readers are aware, we are now entering into some major cycle timing. Tuesday’s daily timing resulted in sharp reversals to the upside and a new record closing high for the S&P 500. The Dow closed just under the record high close of 39131.5 set 23 February 2024. The daily stochastics are hooking up and the next move for stocks might be dependent on Wednesday’s FOMC meeting. It is critical to point out a couple of things. Speculator positions continue to look like sellers/shorts in the market…and, a number of analysts are pointing out that the market has already shrugged off the near-crazy predictions of 6-7 rate cuts in 2024 and have resolved to maybe 2-3 by year’s end. Also, while this data has been digested, the market is basically focusing on earnings now and they have continued to deliver this quarter. The bottom line is that between now and the end of April there is some very critical cycle timing (note that it may even run into mid-May, but the focus is on the last week of April 2024).
Dow Jones Industrials Hourly H-L-C
 As pointed out in last week’s update, stocks closed out last week in a high-volume, triple-witching that left prices sitting on sharply sloping trendlines while also bringing out a raft of doom and gloom forecasts. Psychology is very interesting here, seeming to closely mirror the 1987 rally where the Dow climbed a wall of worry. Price action has been mostly ‘normal,’ and has followed Technical Analysis 101A, e.g., “buy trendlines and buy the breakout.” There still are no signs of terminal velocity for prices, even as the Dow has basically been in a 4.5 week ‘running correction.’ The weekly has eliminated some of the overbought conditions with the sideways trade. The monthly chart has a hook higher in both the stochastics and the MACD. The S&P has been on a 20-week run that has only seen lower lows on the weekly for two weeks in that run. Tuesday’s trade took out last week’s high by only a fraction.
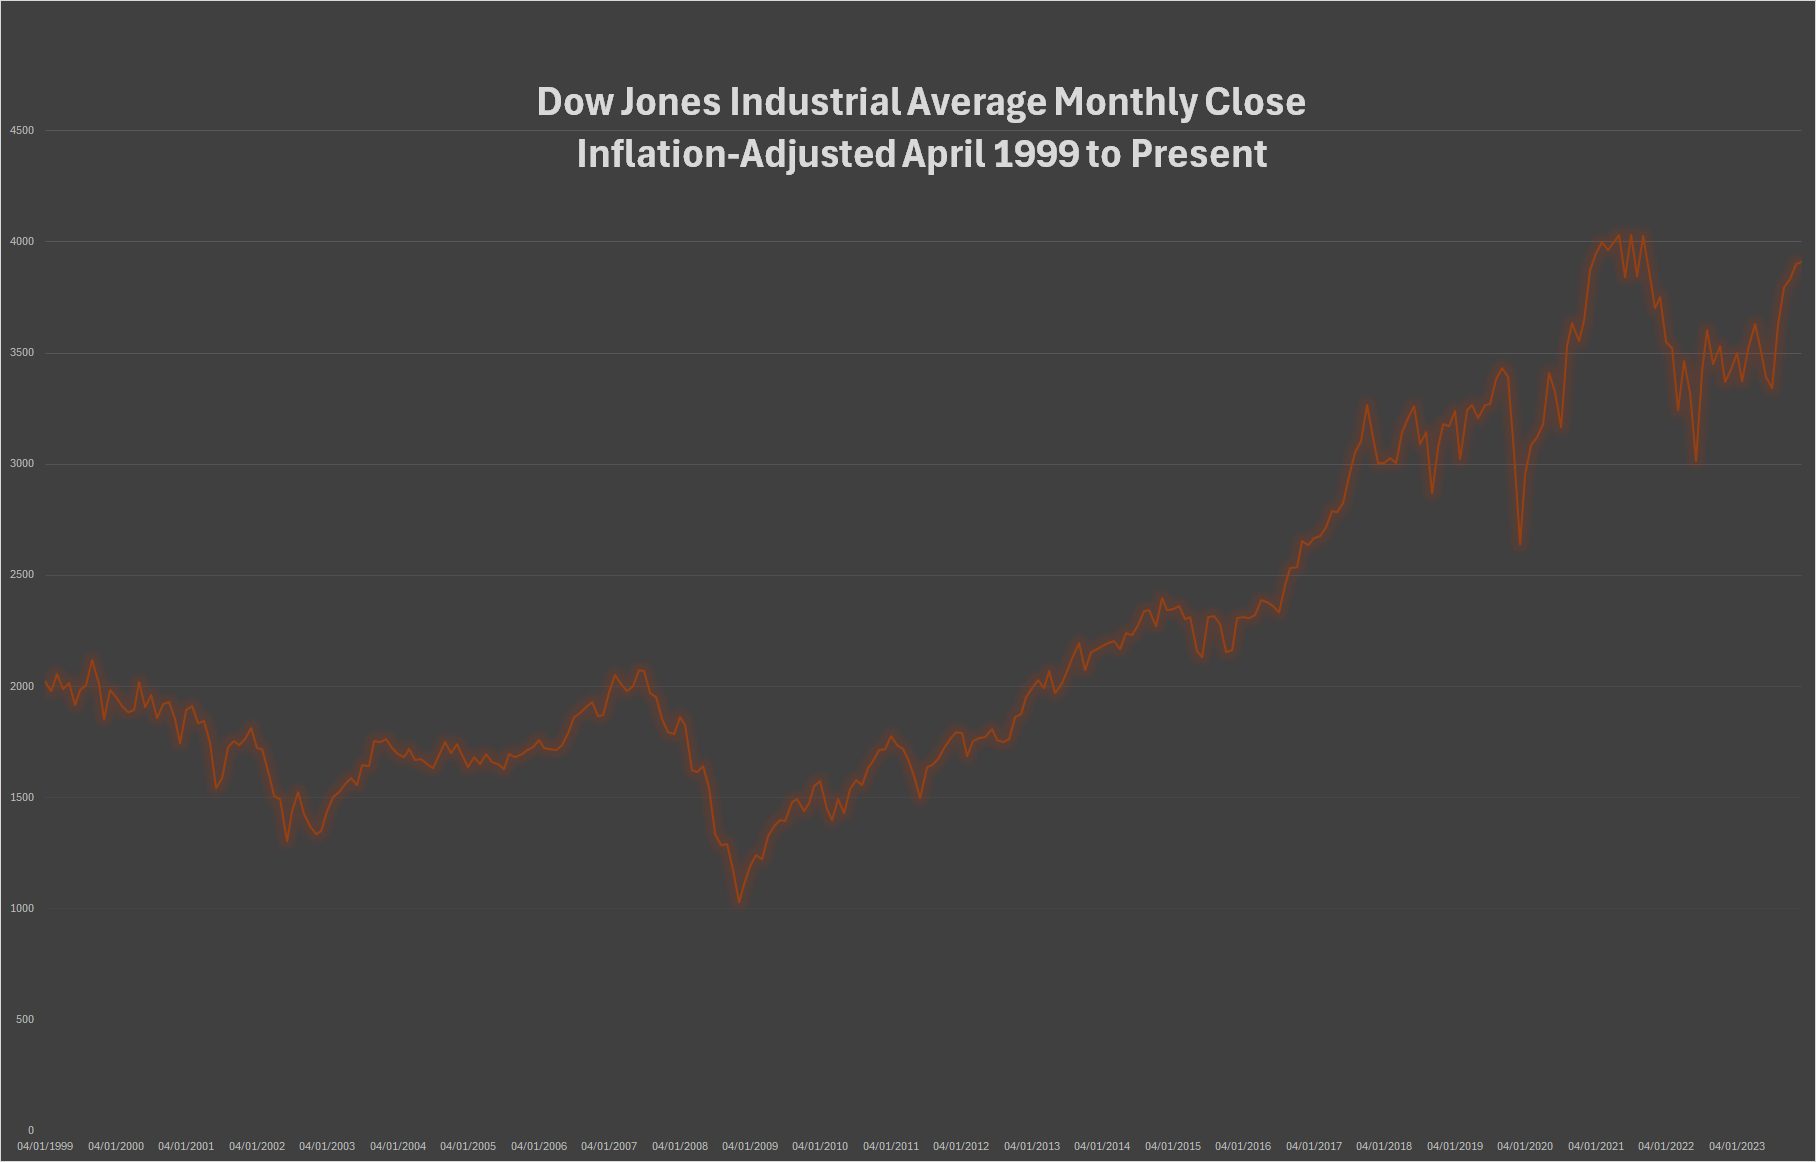
On an inflation-adjusted chart, the Dow is still trading just under the 2021 highs which register at 40010 and 40250, 40300 respectively.
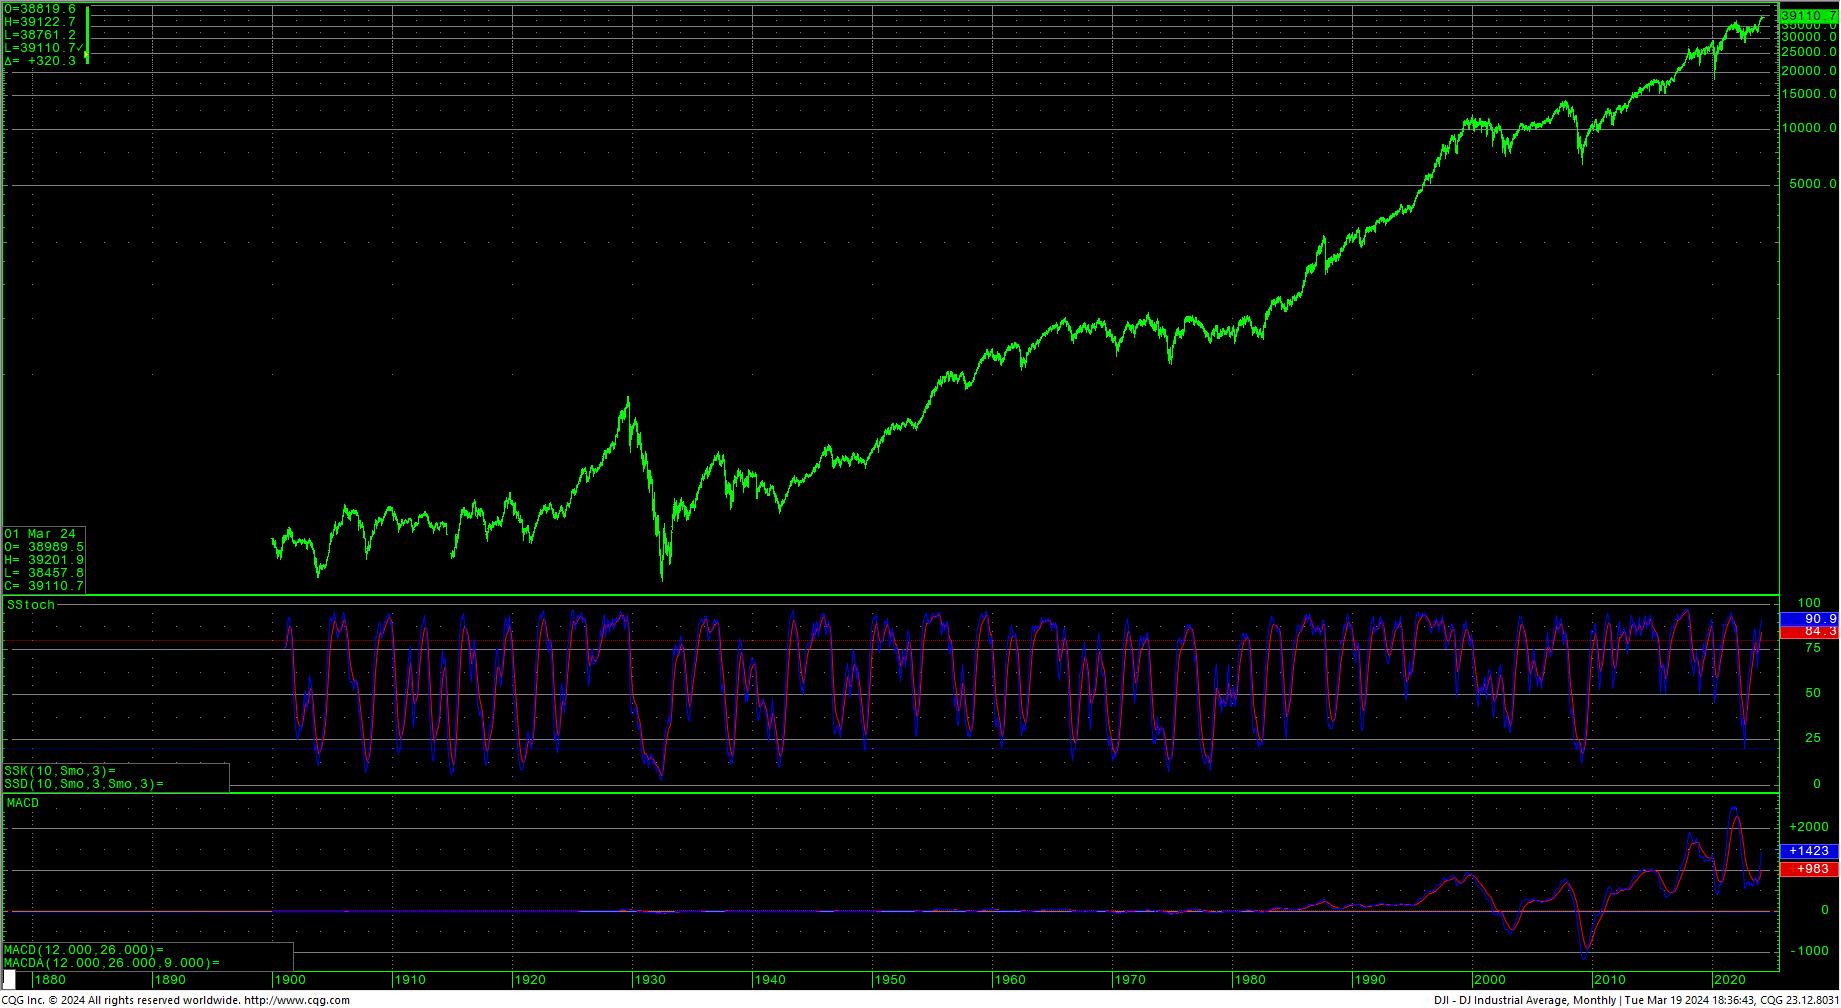
 Dow Jones Industrials Monthly H-L-C (log scale)
 A breakout into new highs right now for the Dow should see prices minimally touch those inflation-adjusted tops. An immediate objective, based simply on the recent congestion is 40106.6. There also remains a weekly target for the Dow at 40245.4. The current intraday highs are 39282/39283.
YM Daily Continuation H-L-C
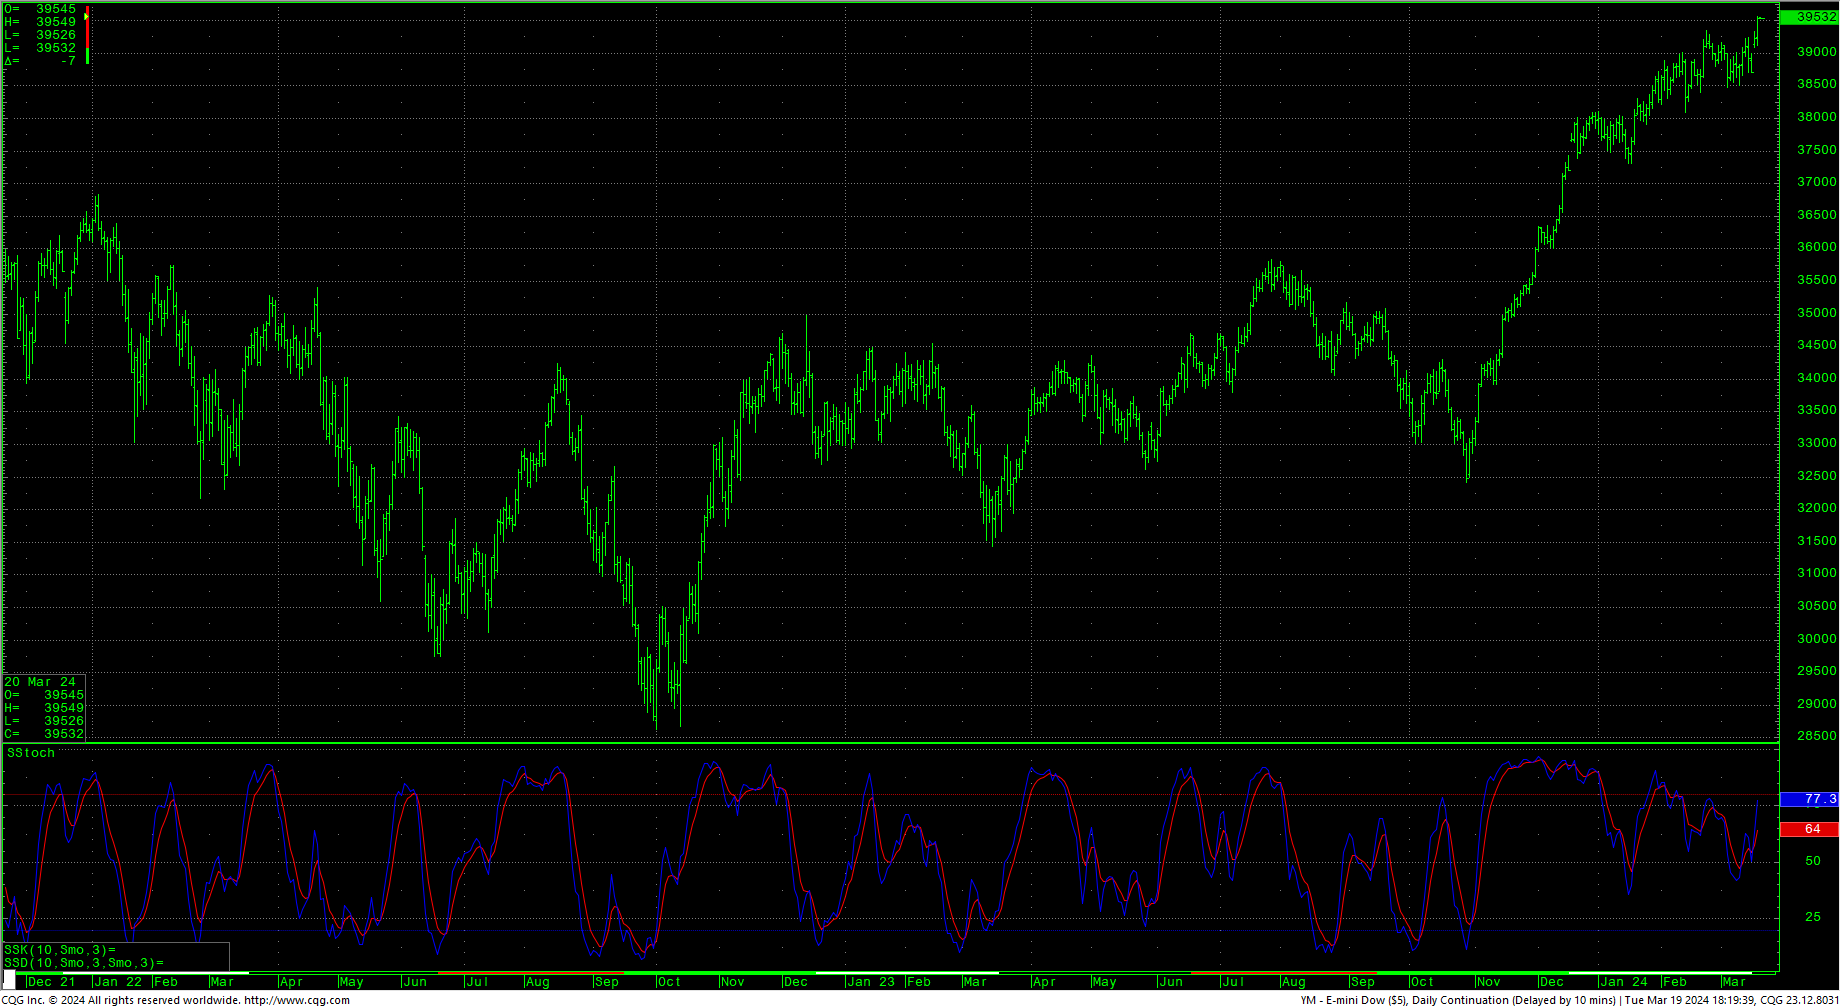 With the JUN taking over for the E-Mini continuation, the daily continuation chart set new record highs in Tuesday’s trade, however the JUN24 futures are still inside the congestion area which now looks like a bullish congestion area or flag.
YMM24 JUN24 E-Mini Daily/Hourly H-L-C
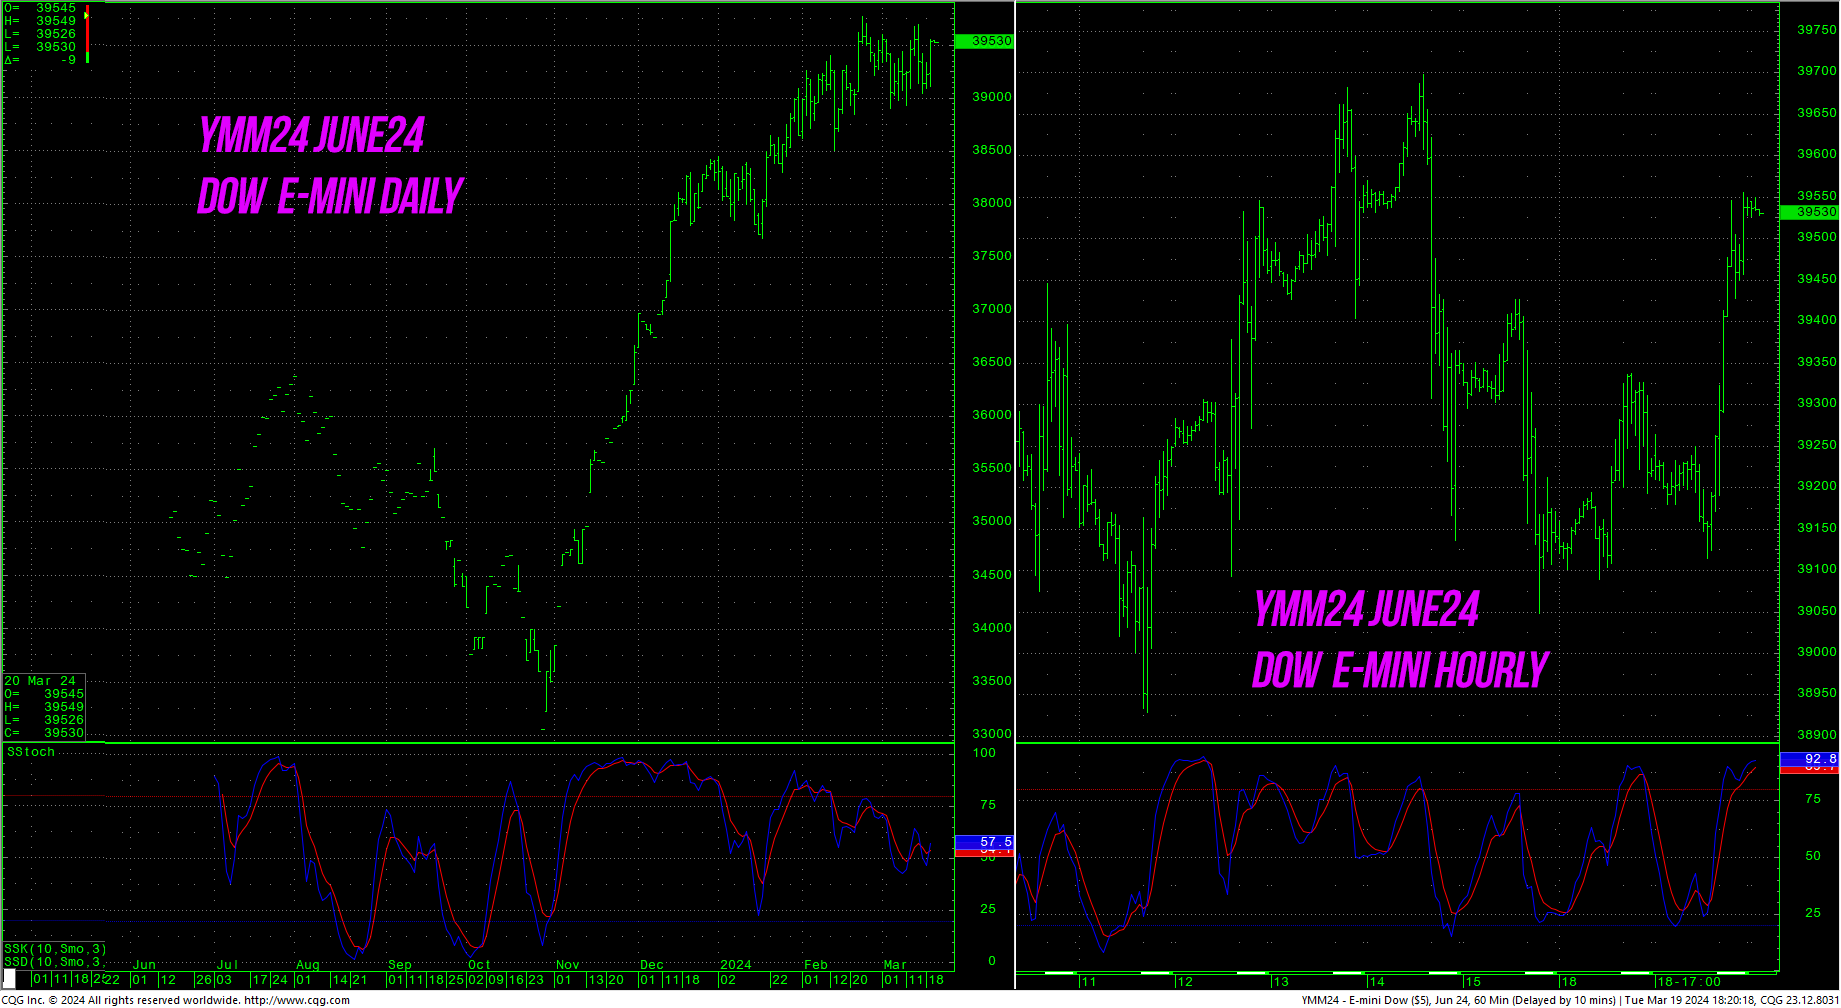 YMM24 closed at 39539 and the highest daily close is 39585 set 23 February 2024. The YMM24, as the spot on the daily continuation, now has an upside target of 40190 for the futures. Resistance for the YMM24 is pivotal right here at 39552/39564. A drive above the 39564 area should test 39698 and the intraday high at 39767. Rallies through 39767 should carry to the target at 40190.
Support for YMM24 is 39396, 39303 and 39210/39200. A breakdown under 39200 will test 39106/39095 with potential to the swing lows at 38909 with support at 38990/38985. Closes in YMM24 under 38909 open counts to 38807 with potential to 38511.
DJIA Support and Resistance
Resistance is 39160, 39201 and pivotal at the intraday highs 39282/39283. Closes over 39283 can test 39651 and will renew momentum toward a daily target at 40106.6 and weekly objectives at 40245.4/40250. 40000 is a critical psychological area and inflation-adjusted highs at 40010 and 40250, and 40300. Closes over 40250 will offer longer-term potential to monthly targets in the 45244 area. Above 45244 gives monthly counts to 47400.
Support is pivotal at 38988 and 38807. A breakdown under 38807 can test 38661/38658 with potential to 38547/38545 and 38514/38510. A breakdown with closes under 38510 can test 38457 with counts to 38202 and 38039 with potential to critical short-term support of 37947/37940. Closes under 37940 can carry to 37122 with counts toward critical short-term support of 36775. Closes below 36775 open counts to 35224.
Charts courtesy of CQG, Inc.,