
TECHNICAL ANALYSIS (by Intraday Dynamics)

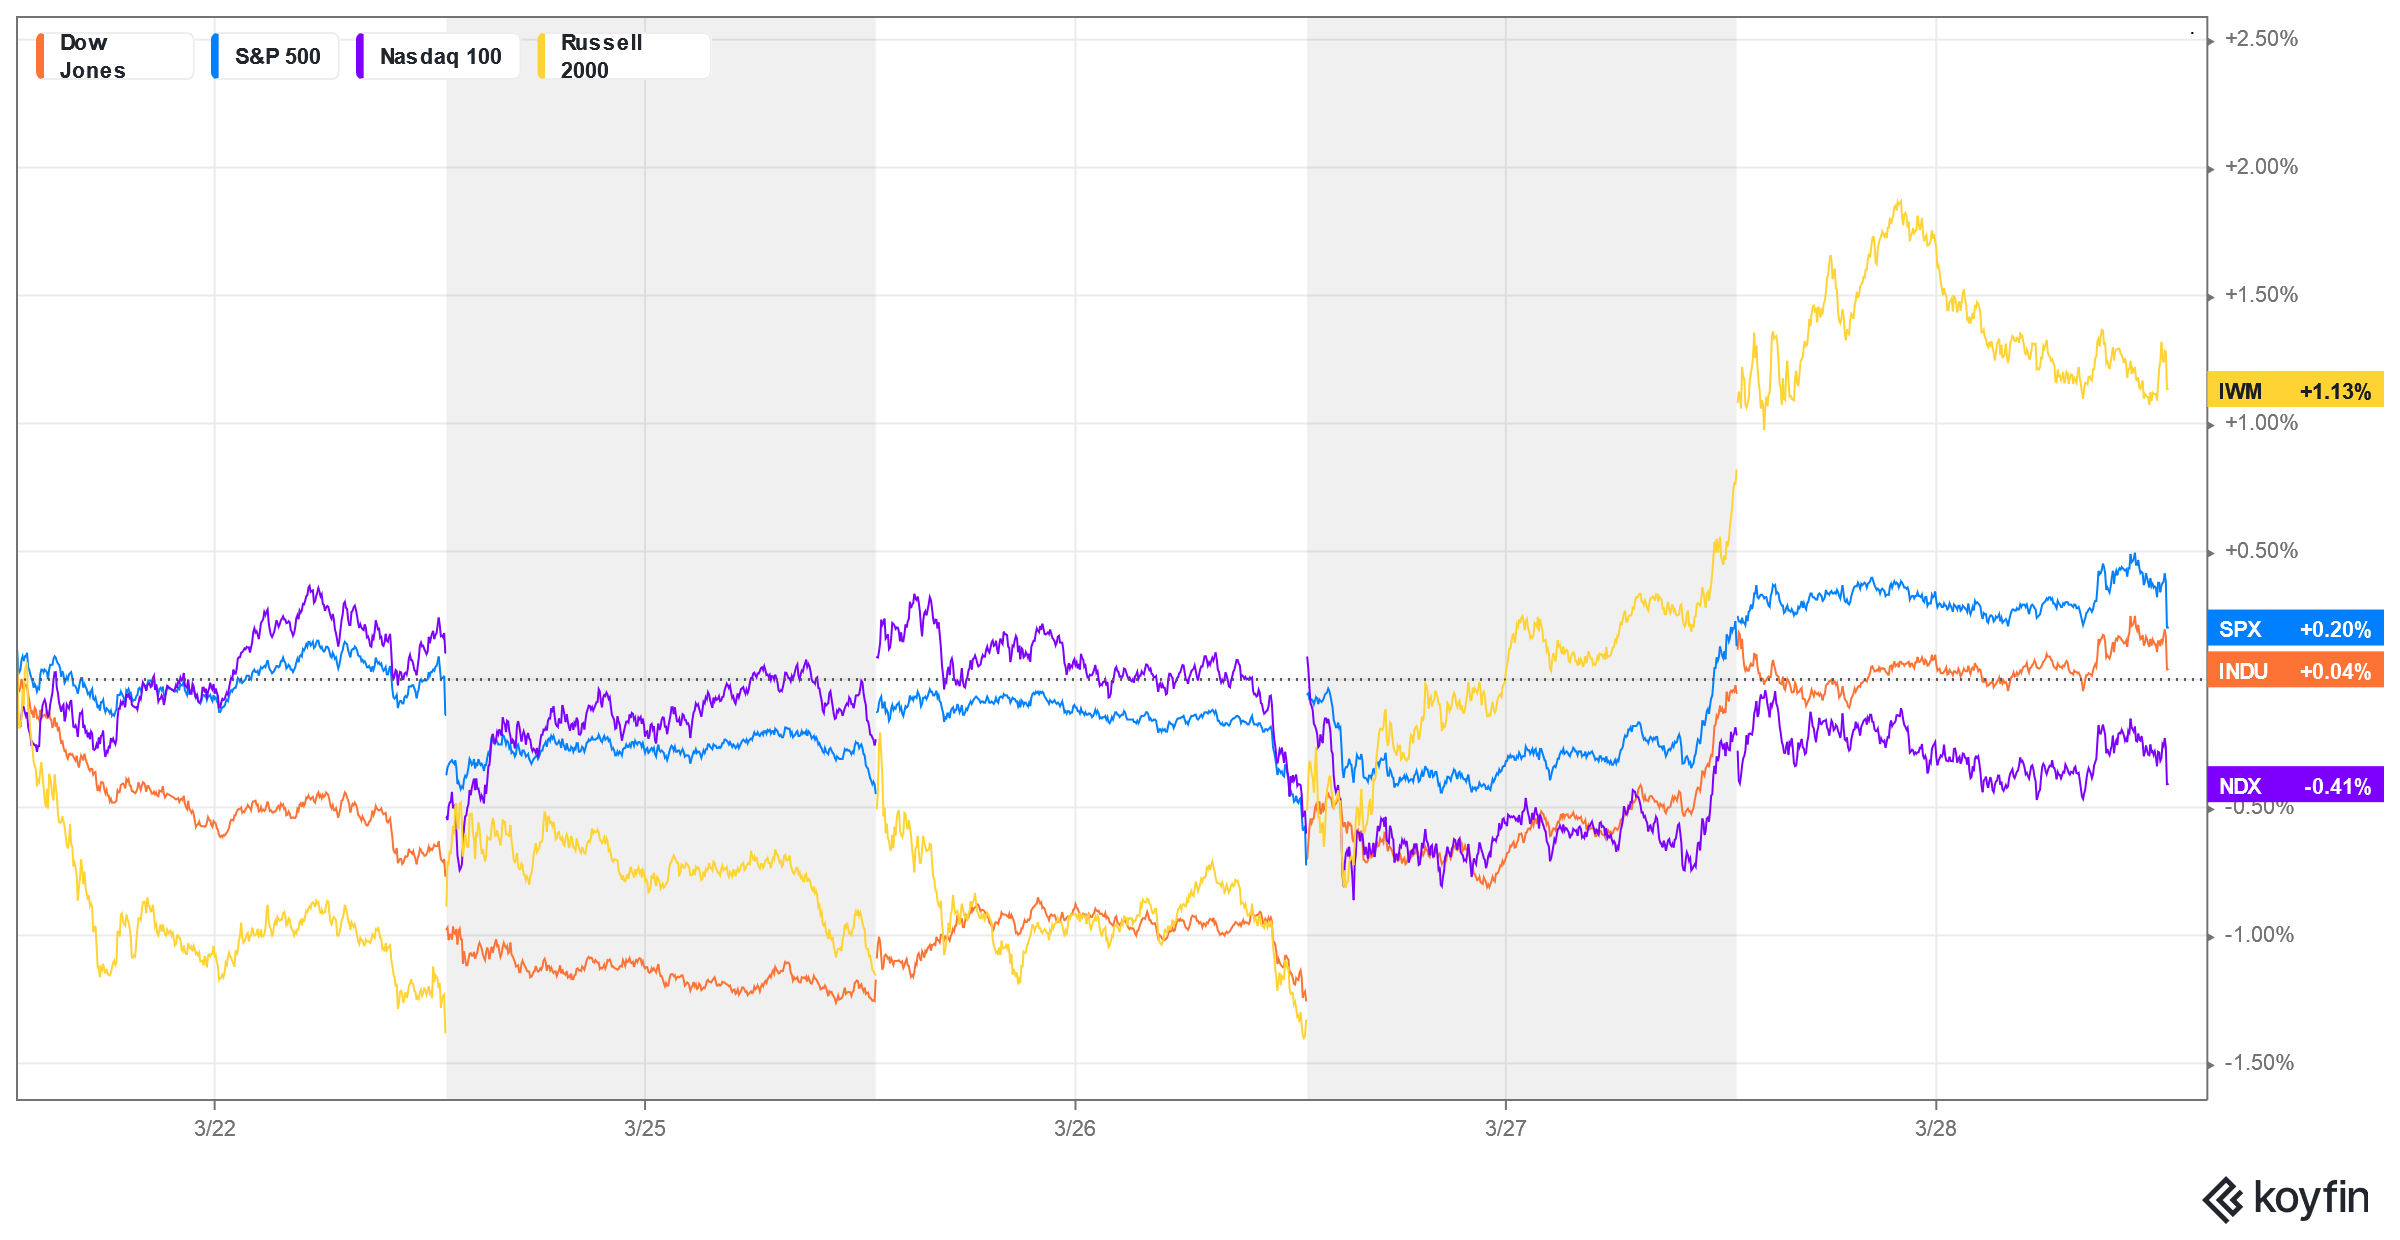
Major Indices Week of March 28, 2024
 Dow Jones Industrial Average Monthly H-L-C (log scale)
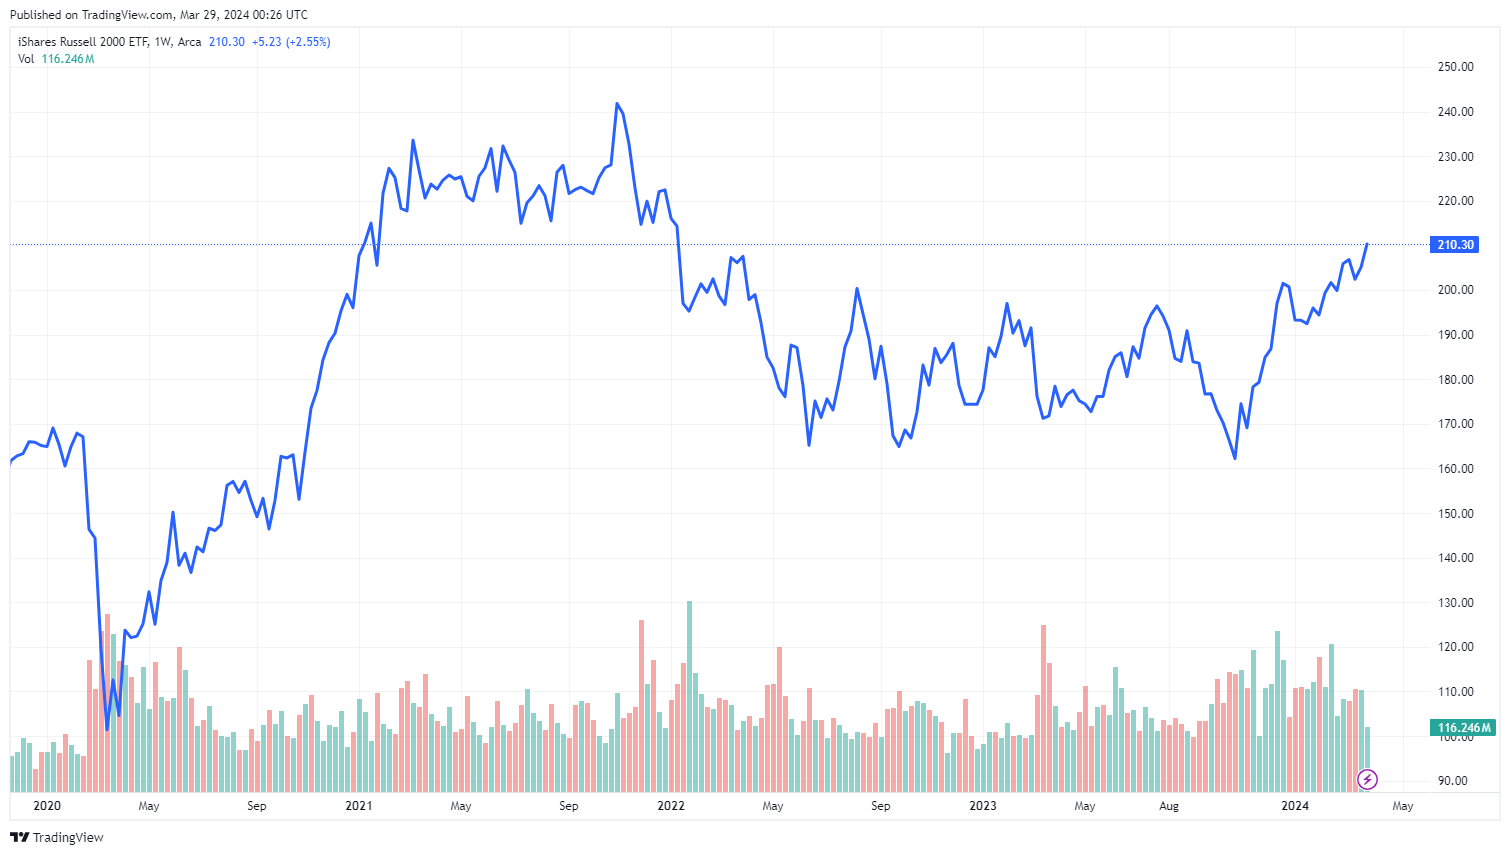
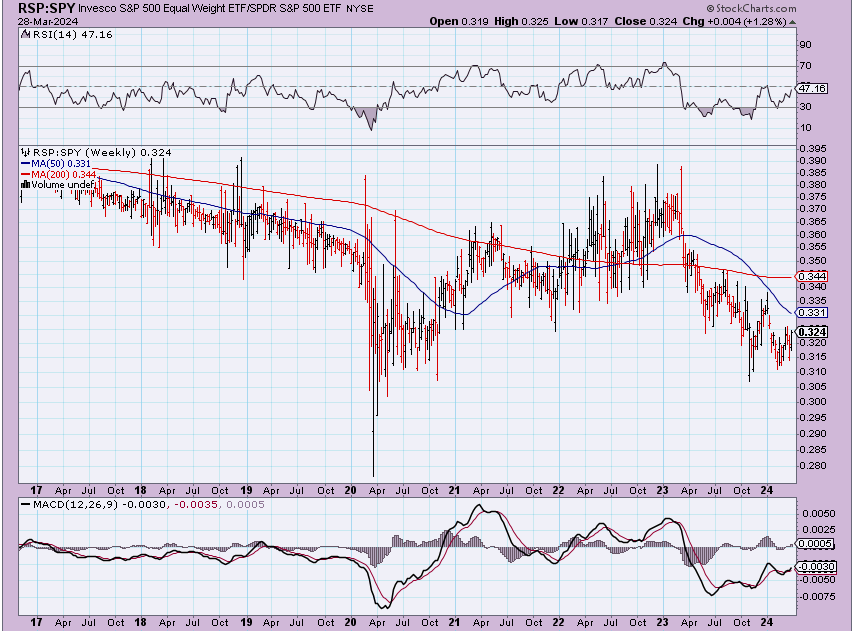
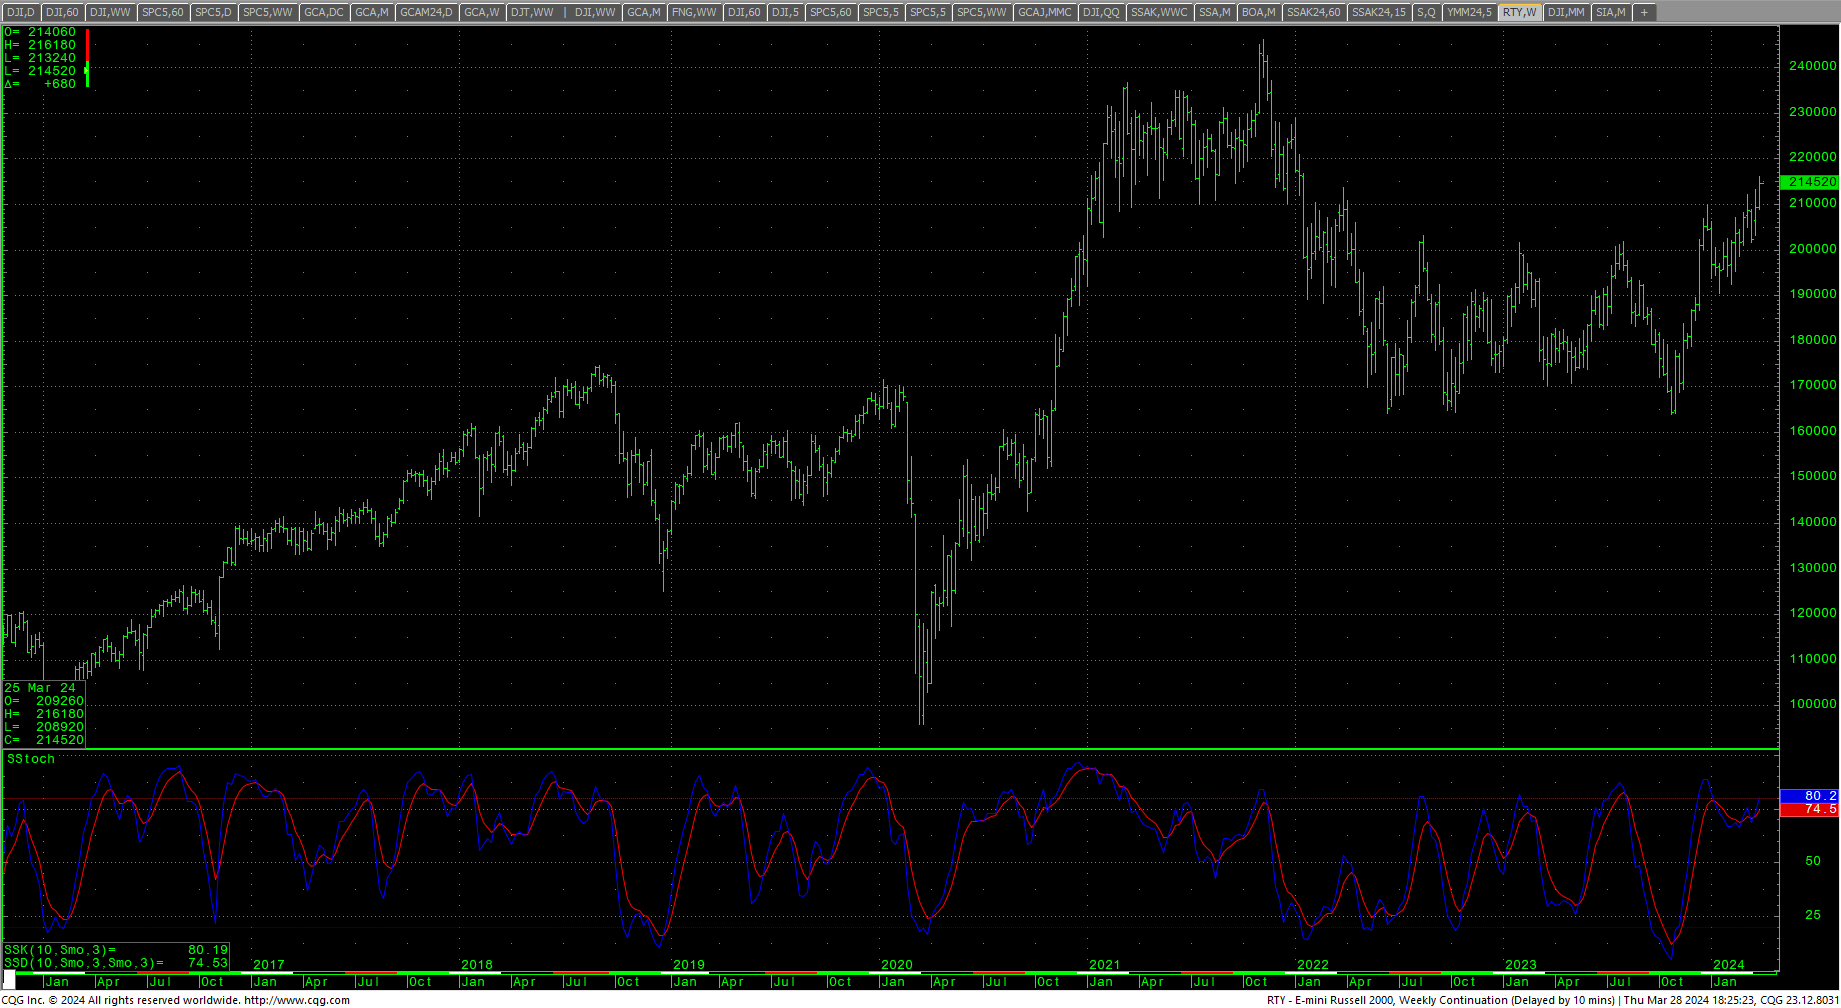
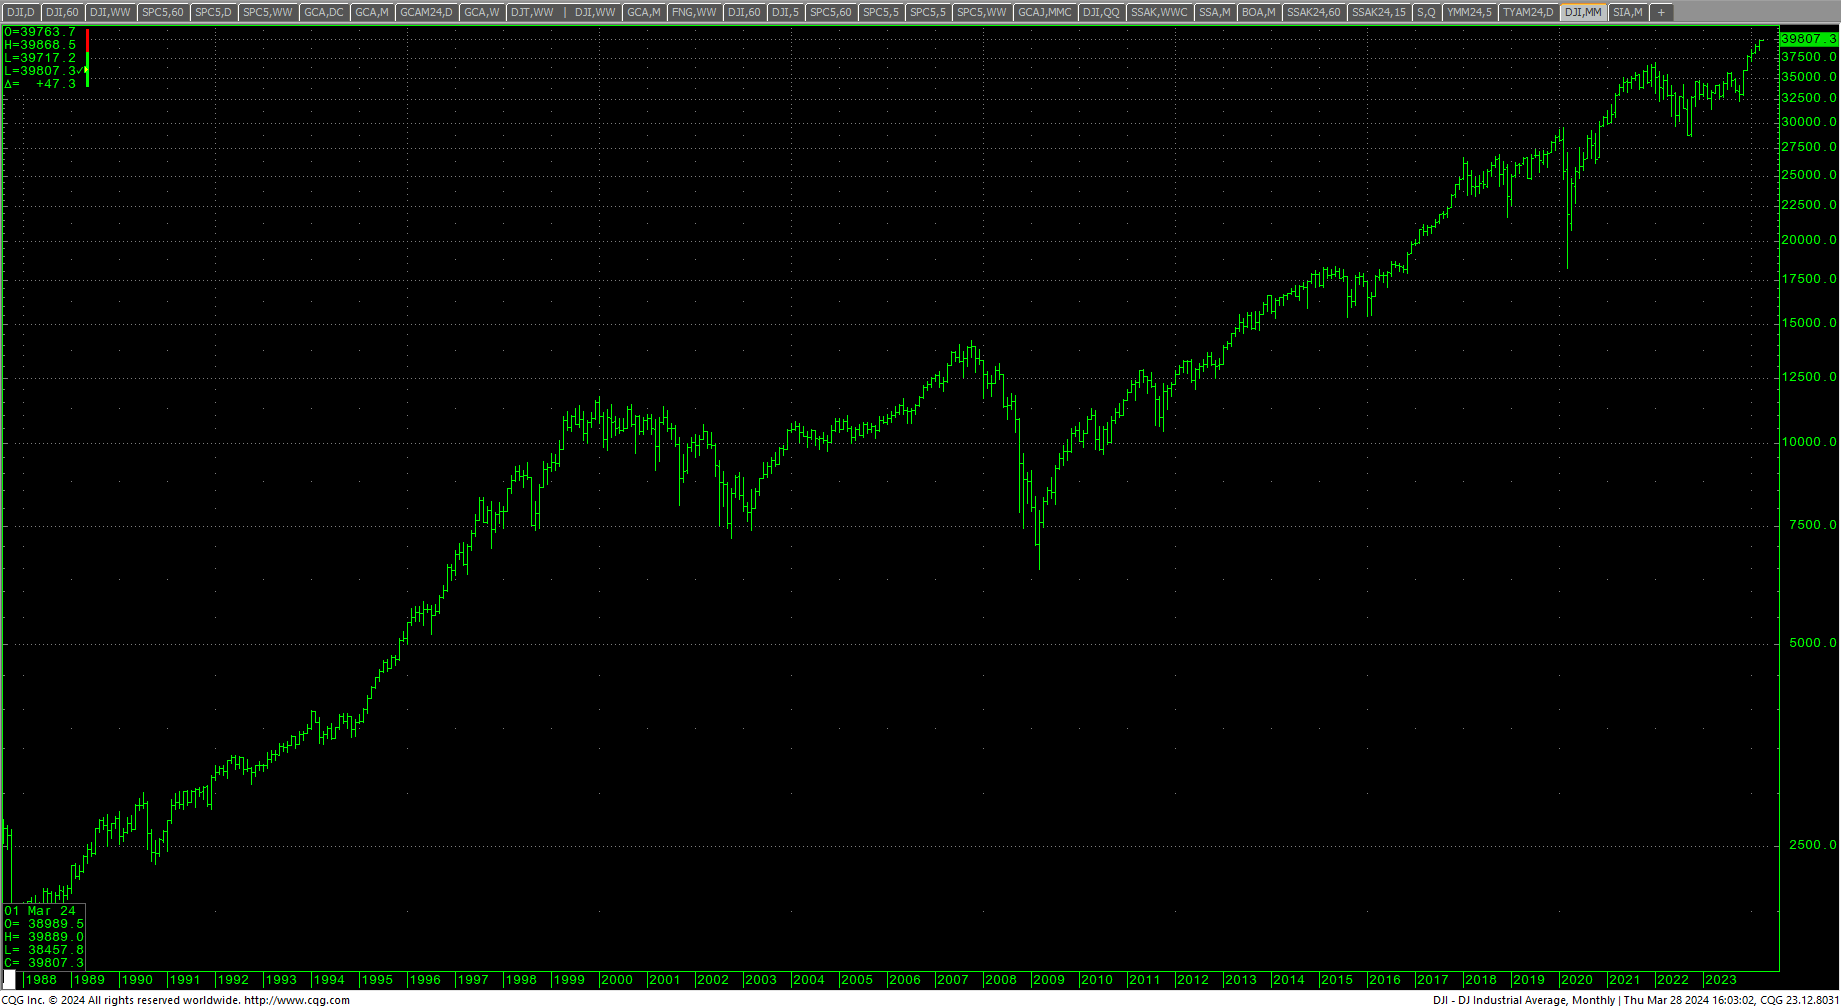 Stocks traded a quiet holiday week in mostly choppy and mixed trade but ended the shortened week with record high closes for the Dow and the S&P 500, while tech stocks took a breather and closed slightly lower. The Russell rallied sharply last week to the highest weekly close since 10 January 2022 as the RSP:SPY continues to try to bottom. The Dow is knocking on the door of a major milestone at the 40,000 level.
 S&P 500 Quarterly Candles
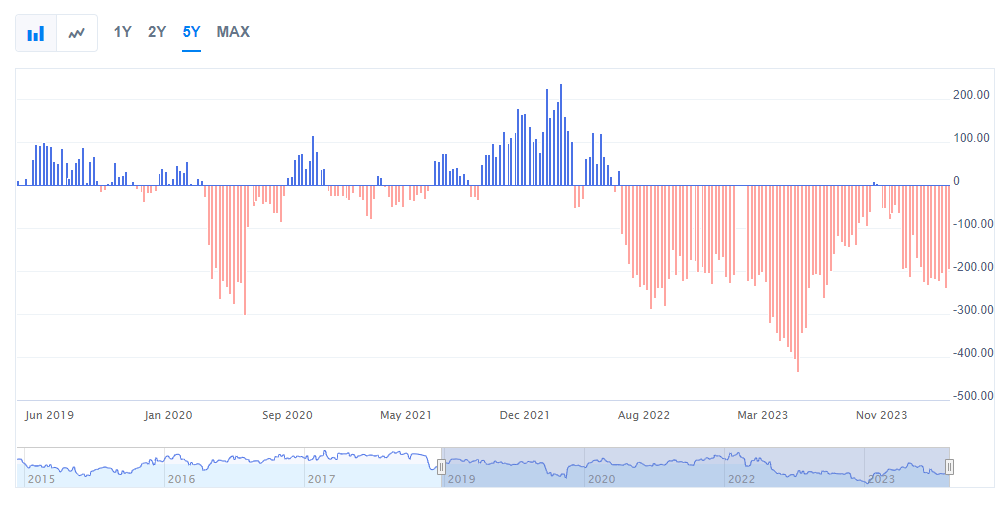
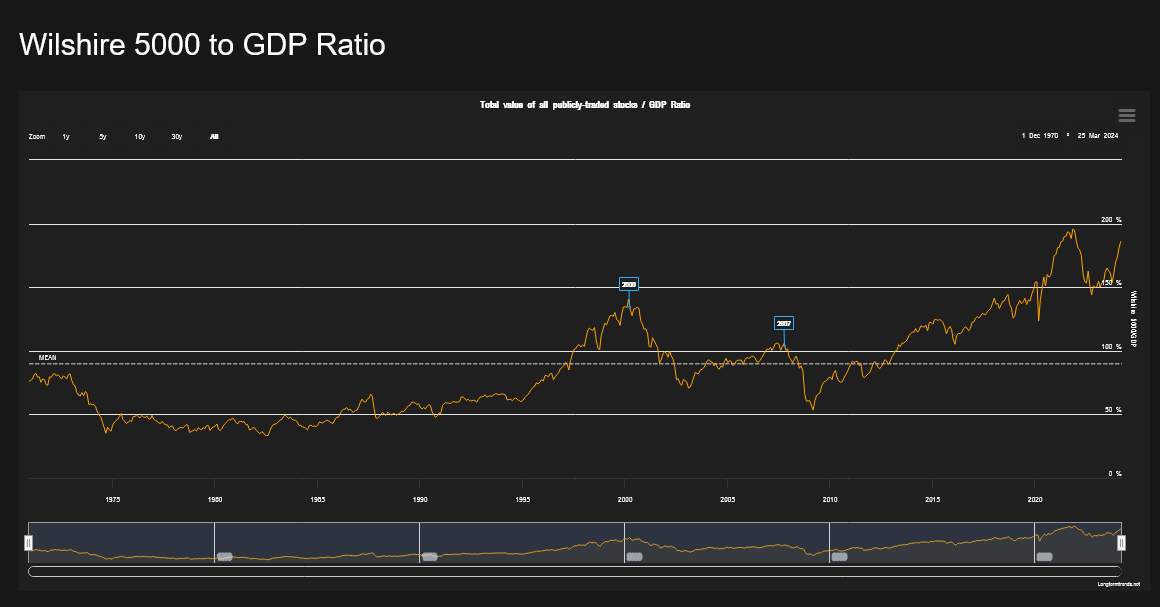
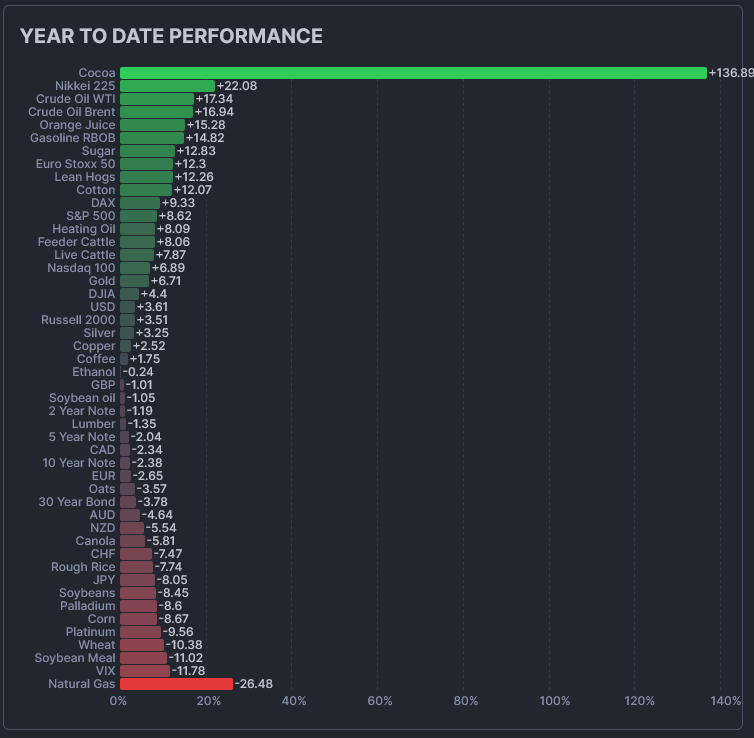
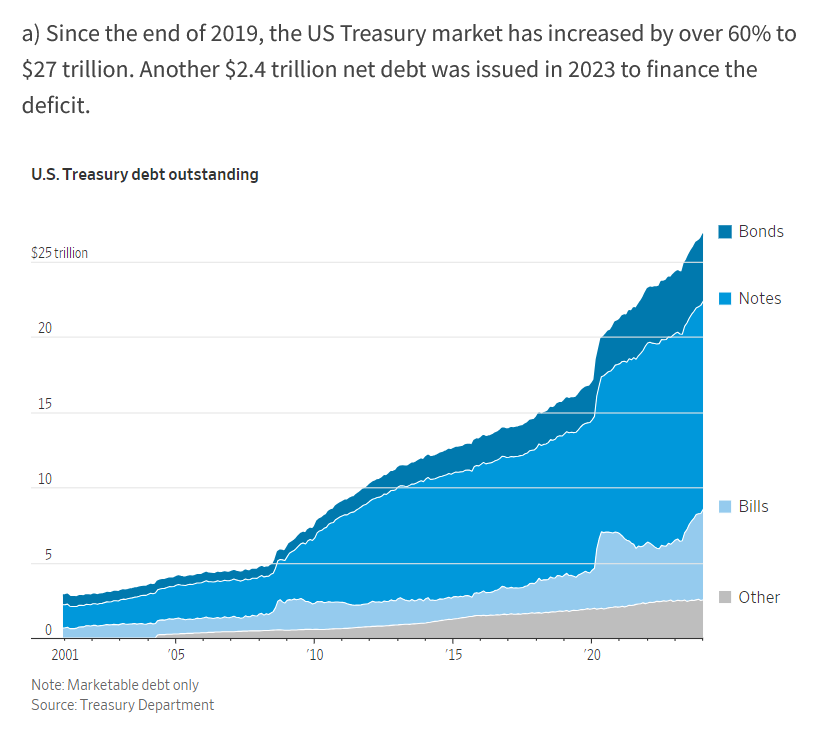
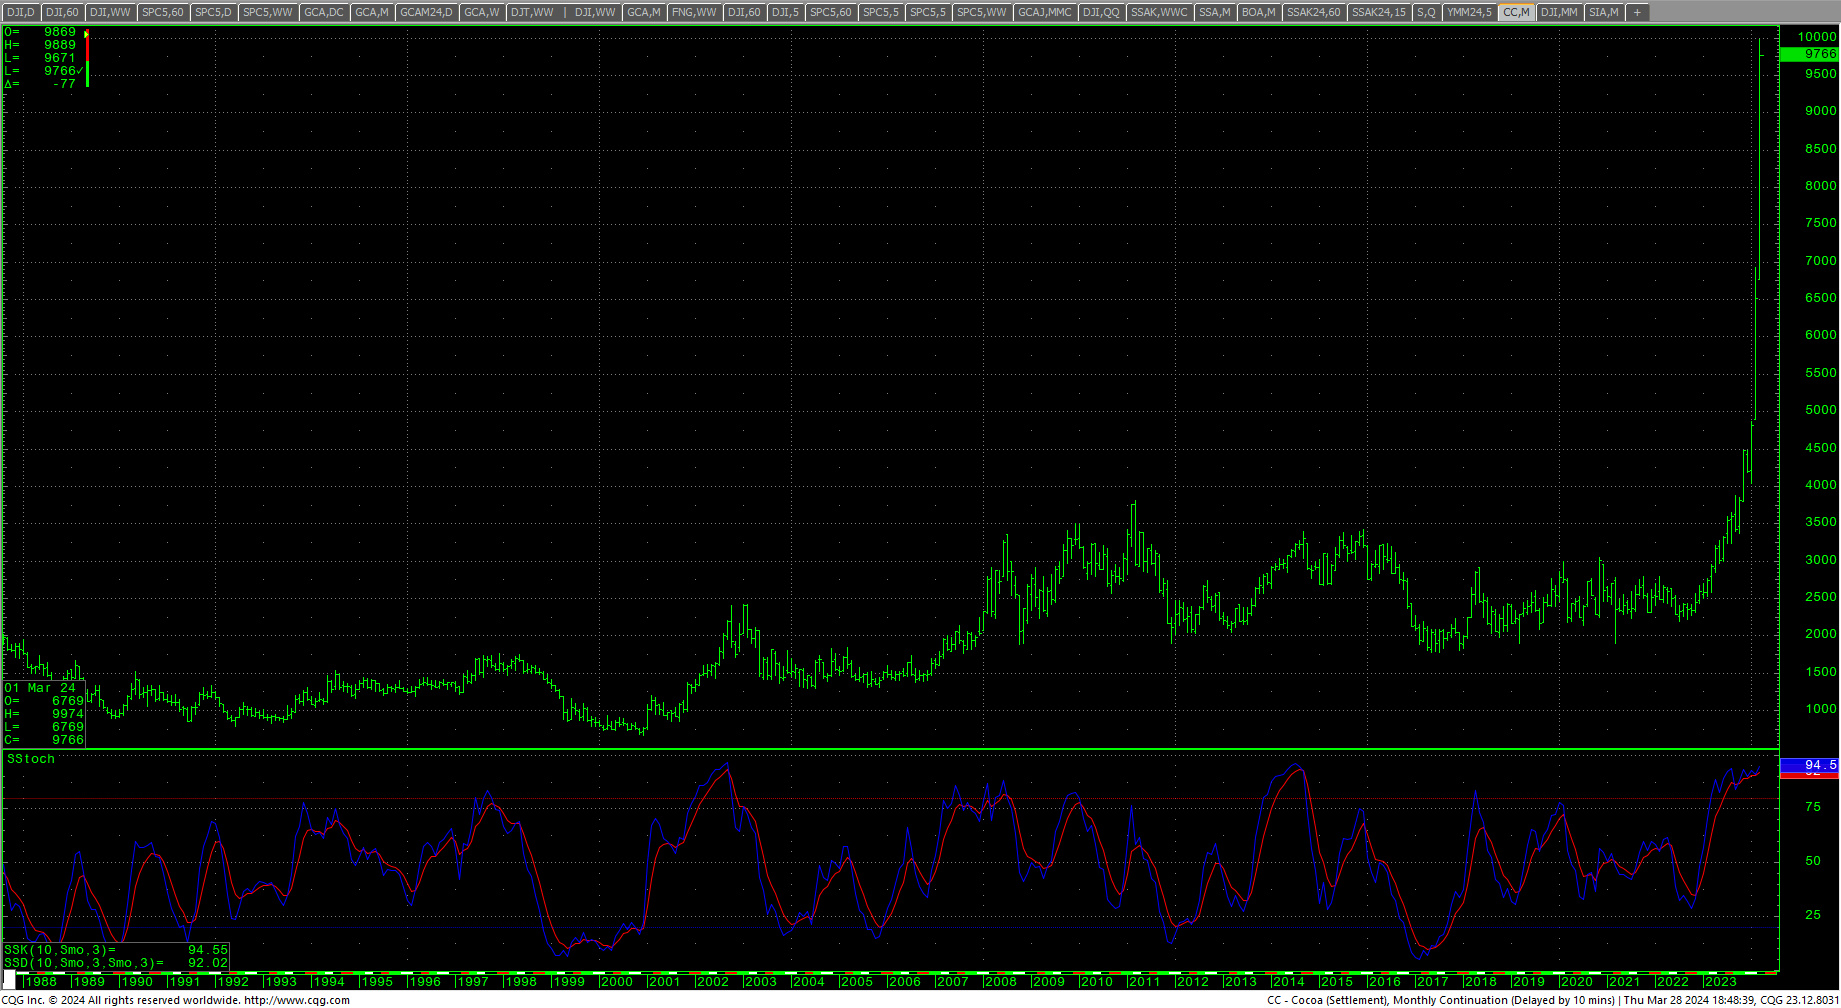
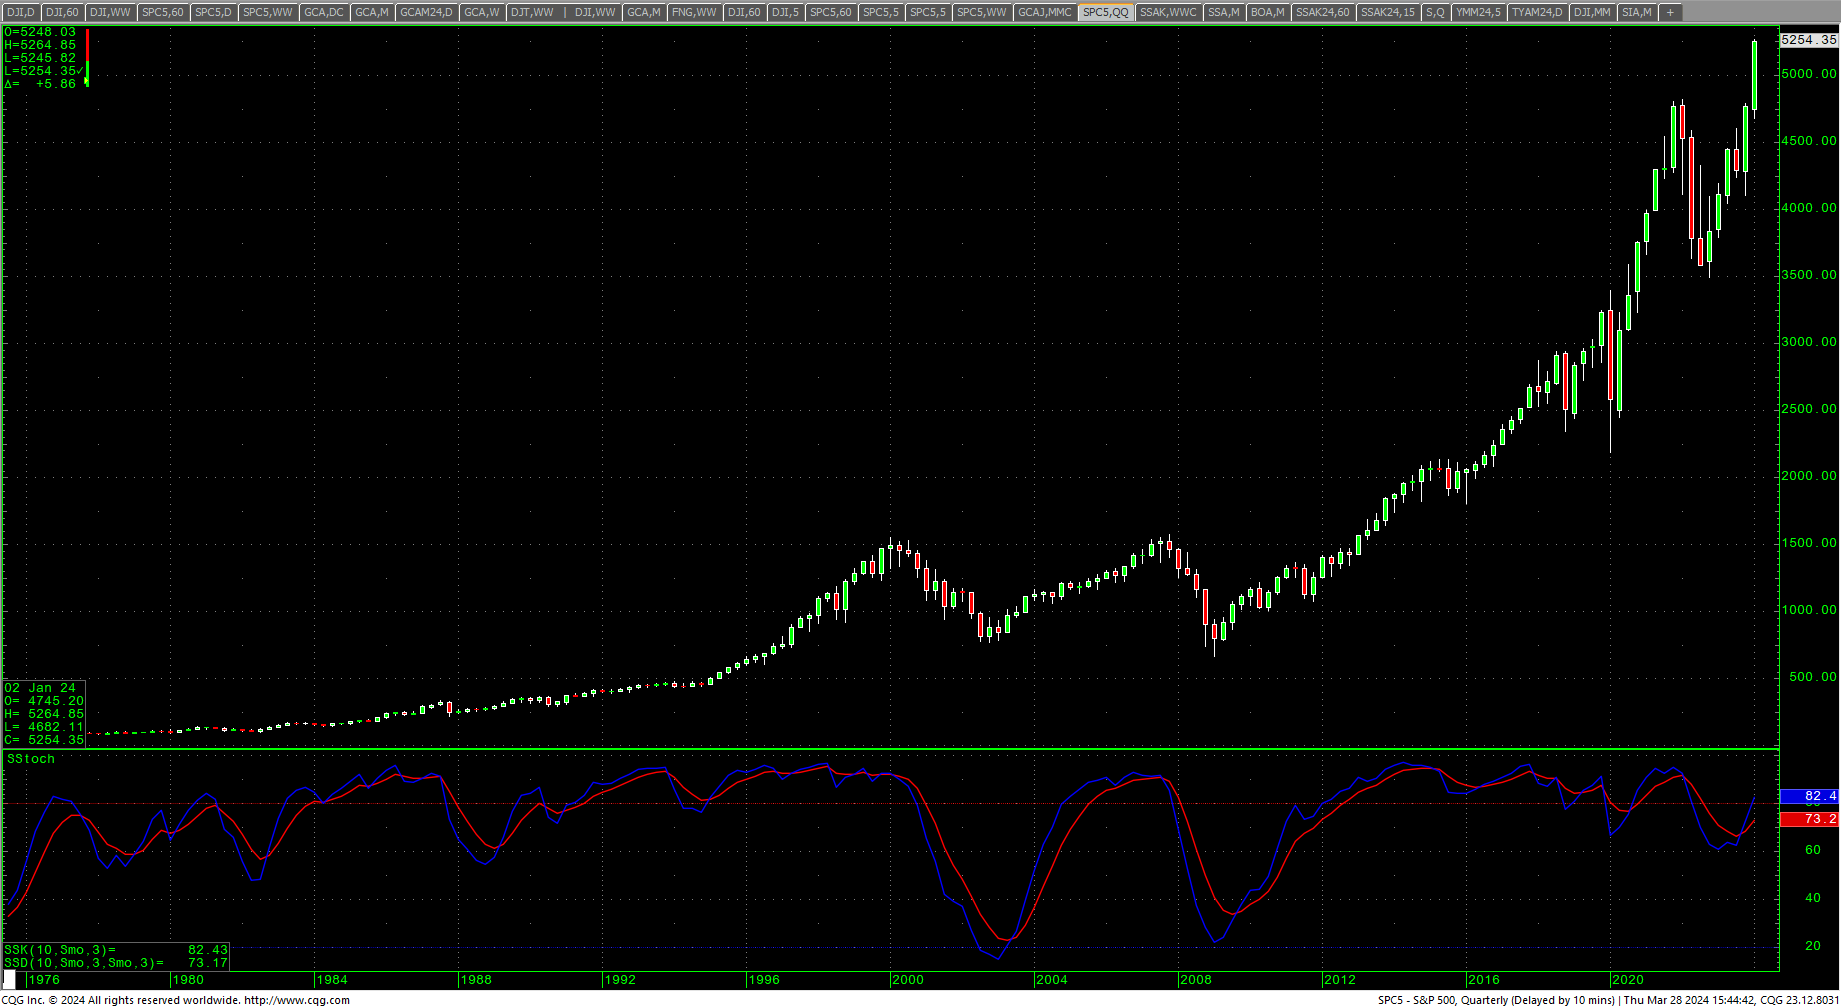 Sentiment remains high and yet the markets closed out one of the best quarters since 2019, with the market now finishing a five-month run on the upside. The S&P is up over 10% for the quarter. It’s still a wall of worry with a mixture of rate/inflation anxiety, Fed Funds, the US debt and the fact that, as a share of household financial wealth, stocks are now at a 70-year high. Commodity markets are heating up, however the reality is that cocoa is the vast percentage of the index rallies. Energy prices are climbing with crude oil hitting the highest levels since last fall. The CFTC reports continue to show speculators as shorts in the market. The “Buffet Indicator” (Wilshire 5000 to GDP Ratio) remains below the December 2021 top. Yet another zero valuation “meme stock” entered the fray last week.
CFTC S&P 500 Speculative Net Positions
 The Buffett Indicator: Market Cap to GDP
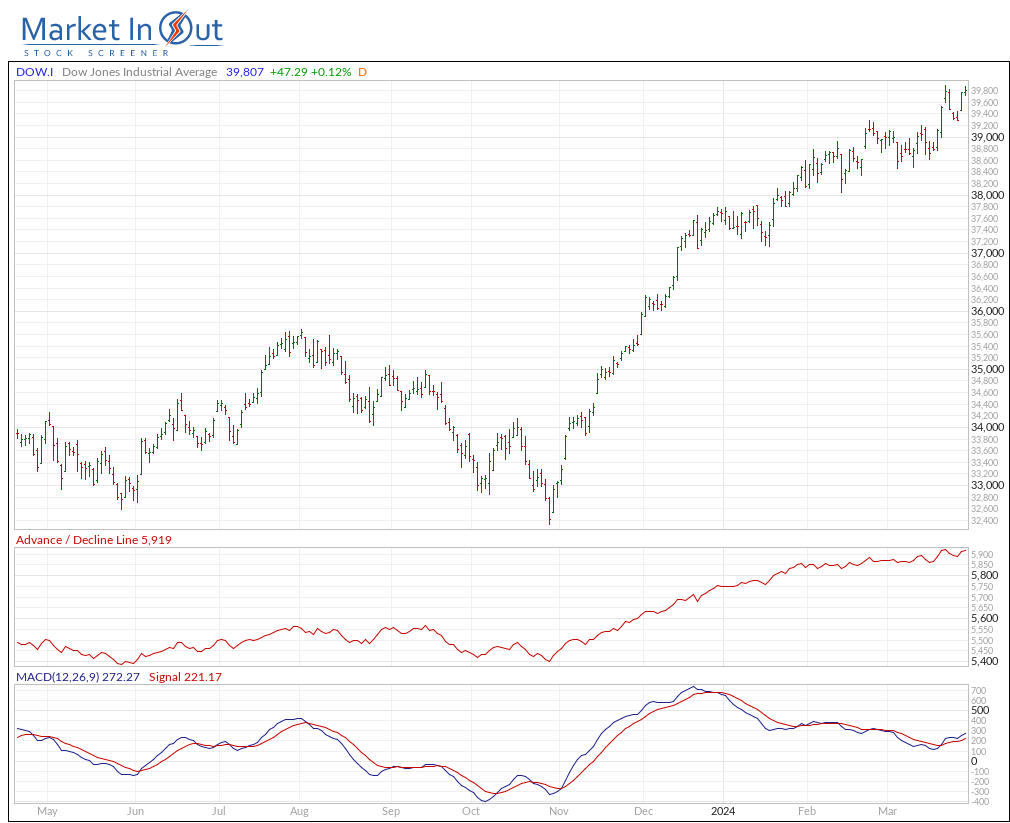
 Dow Jones Momentum
A reminder that we are now in a critical cycle window that runs between now and the end of April. Trade can become much more active with potential for wider swings and short-term moves.
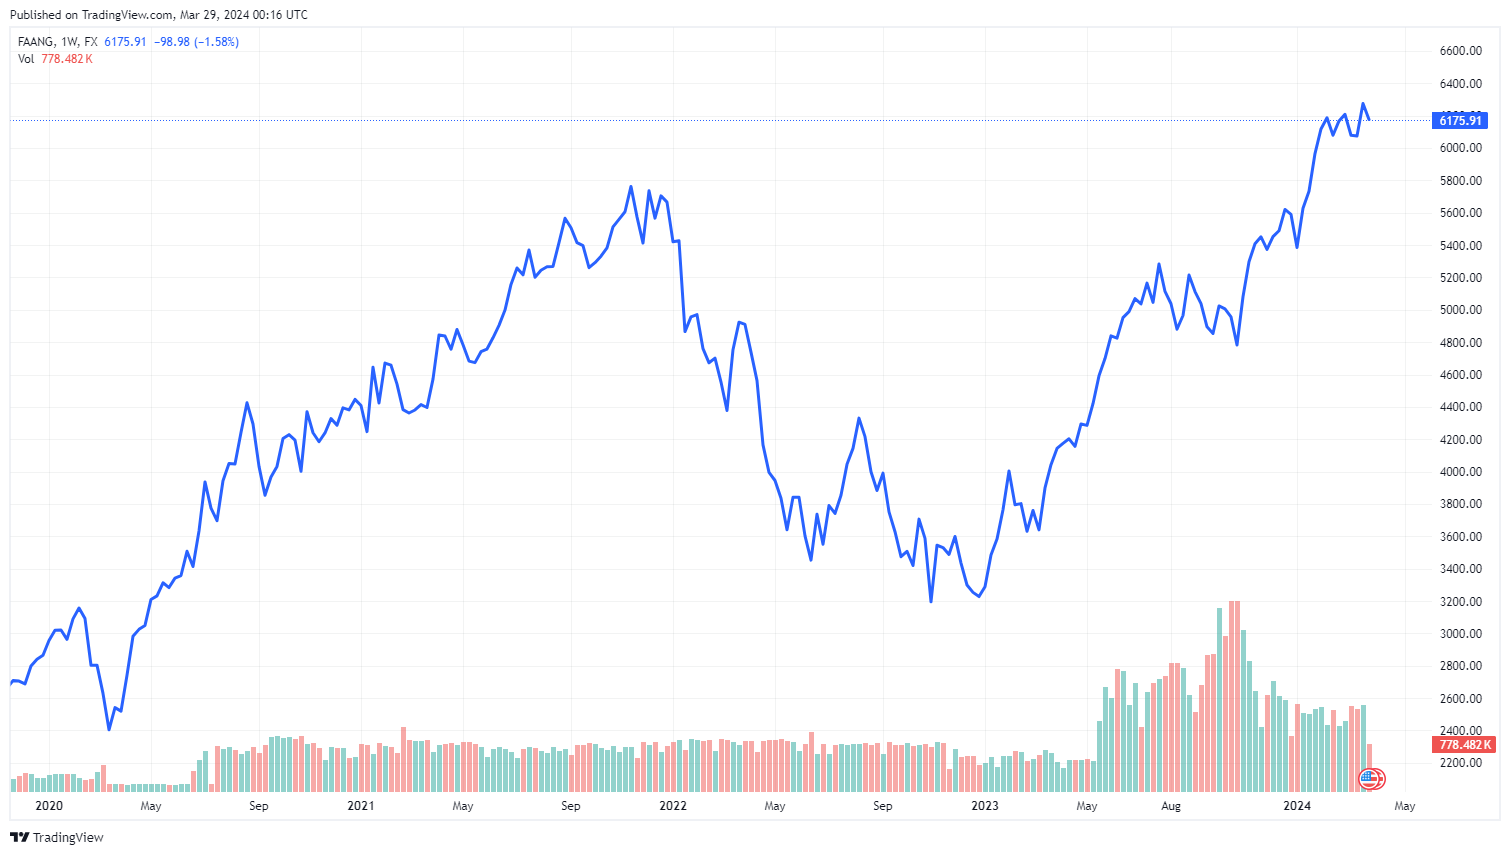
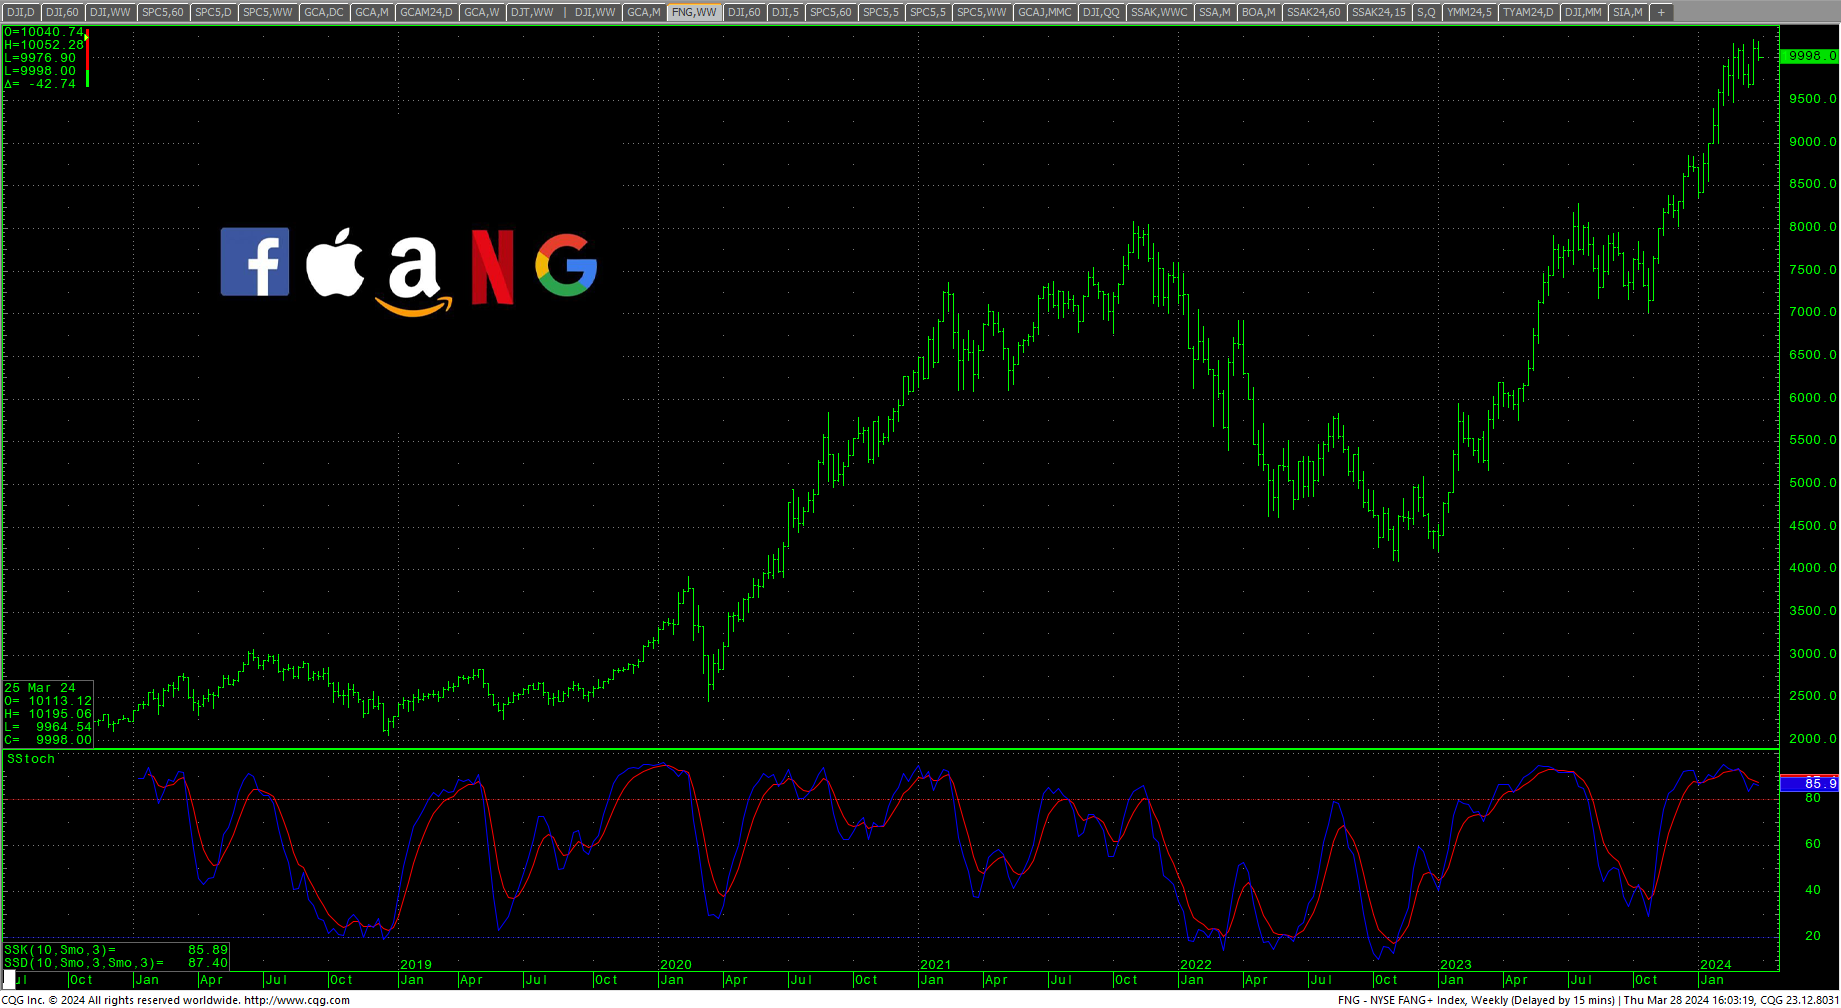
FAANG (FXCM)
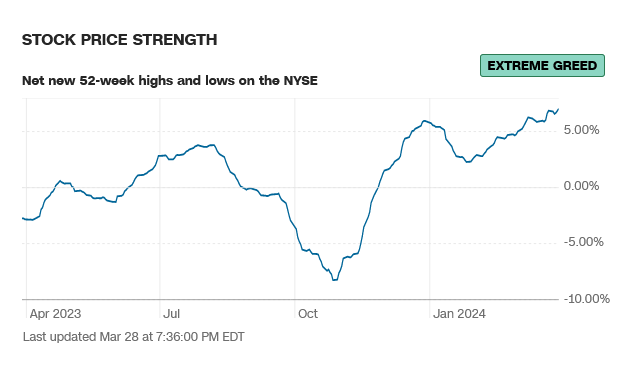
 52-Week A/D Line
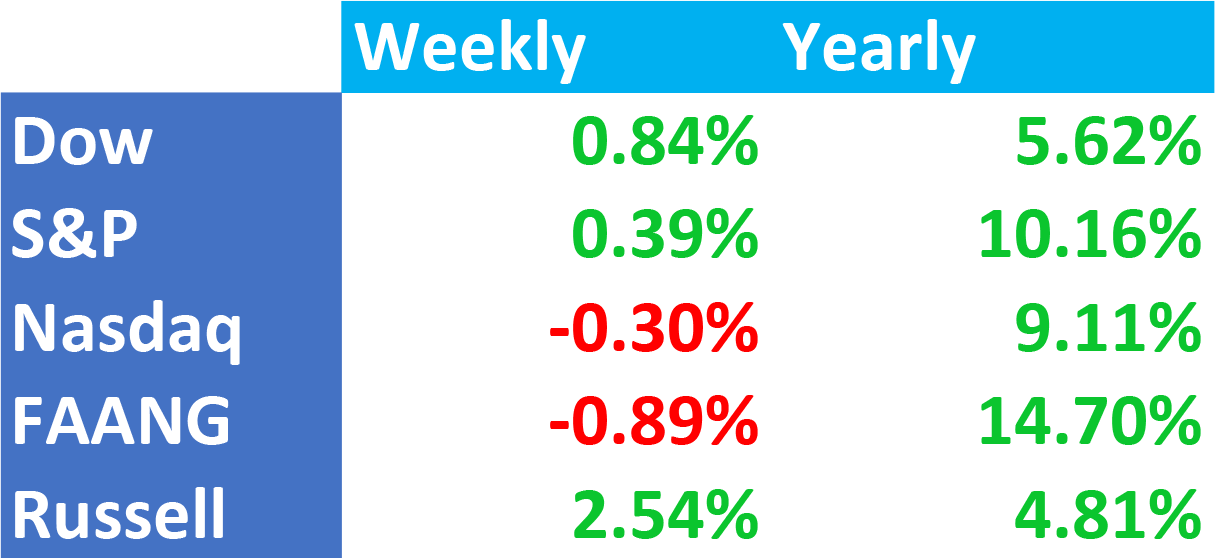
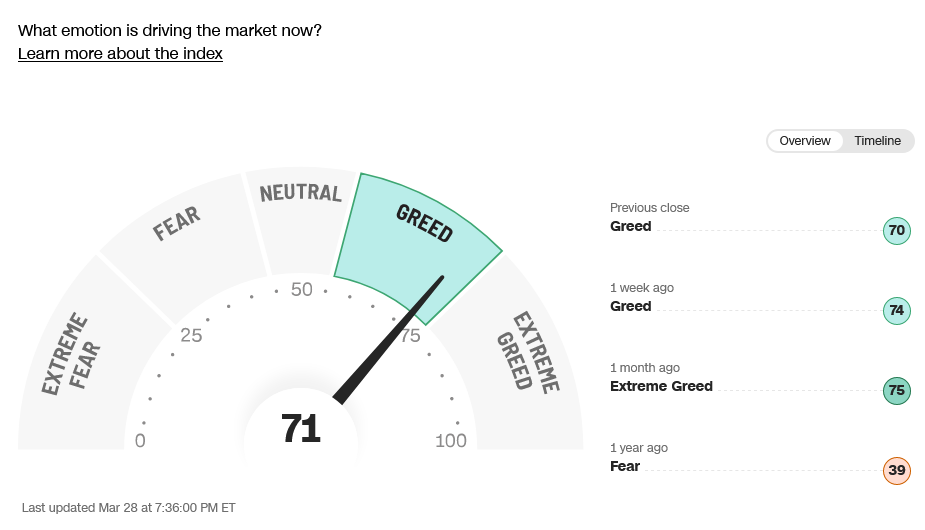
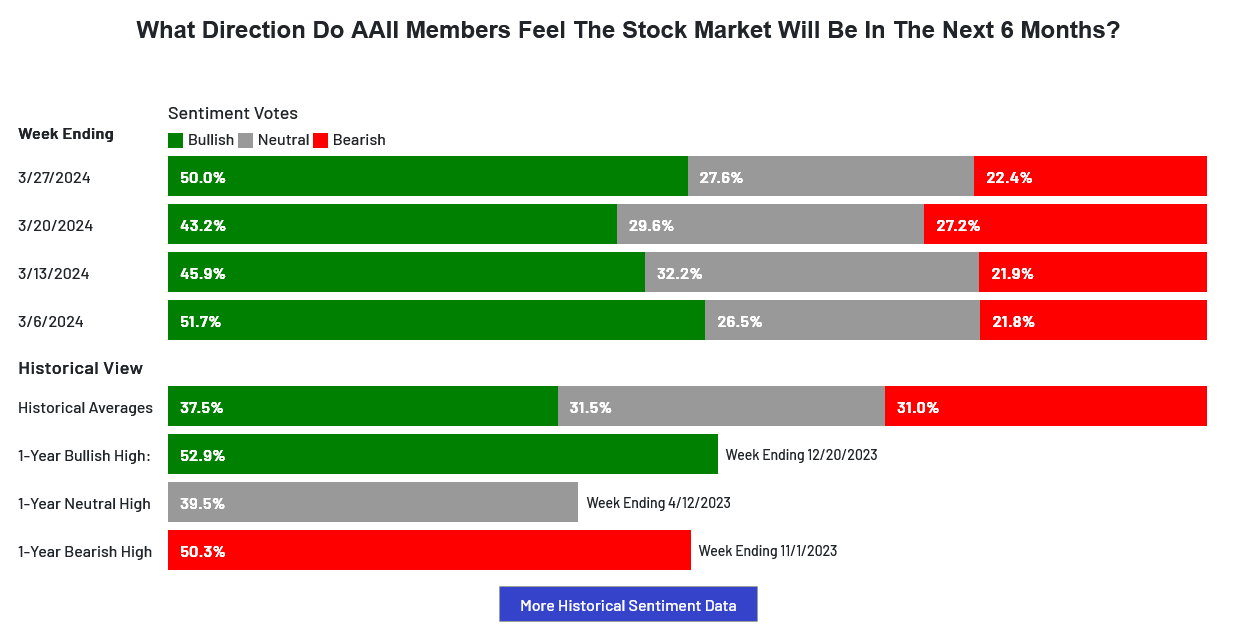
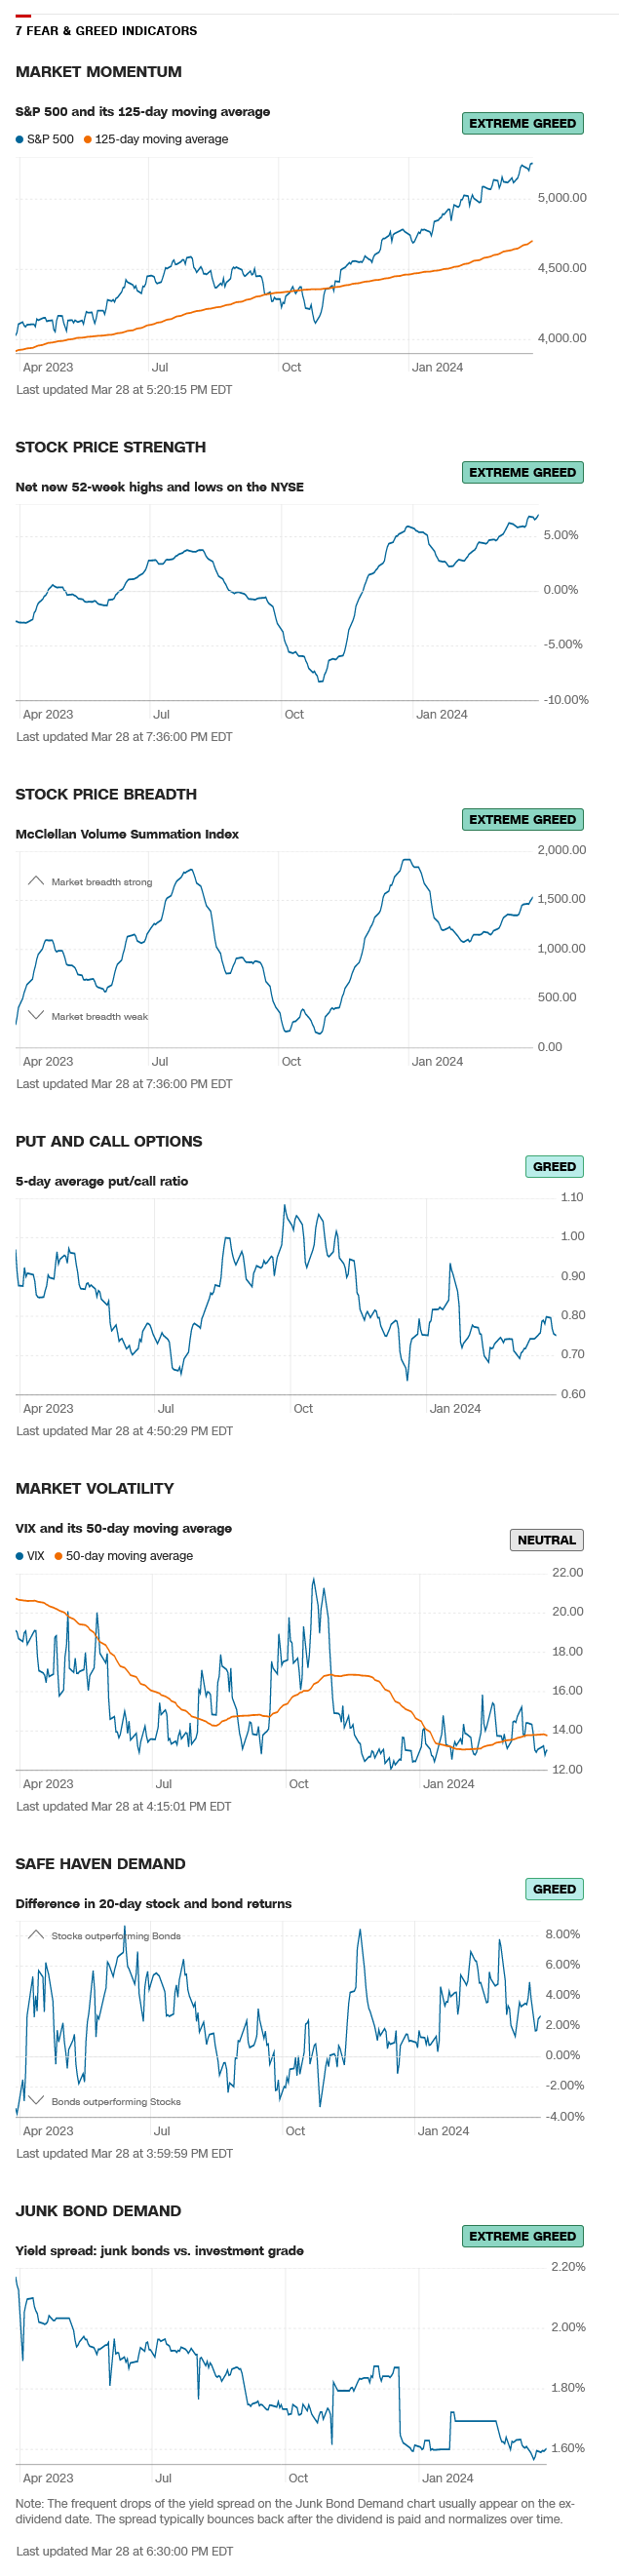
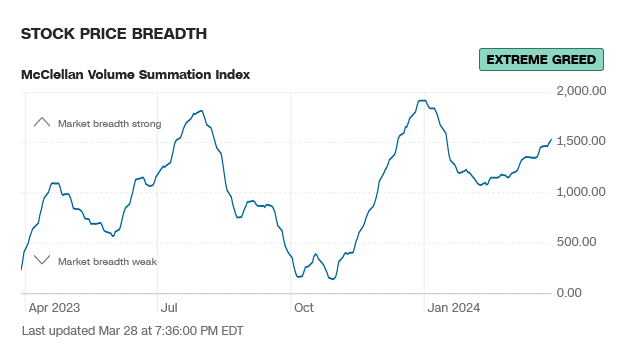
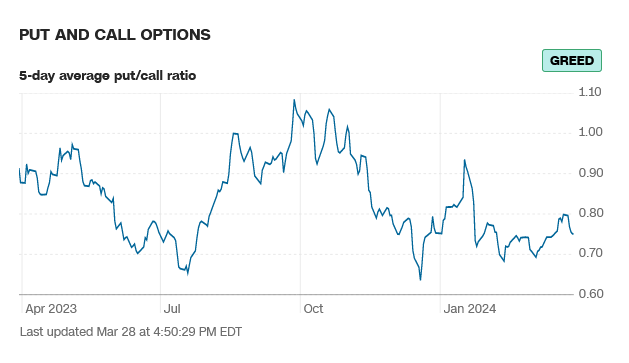
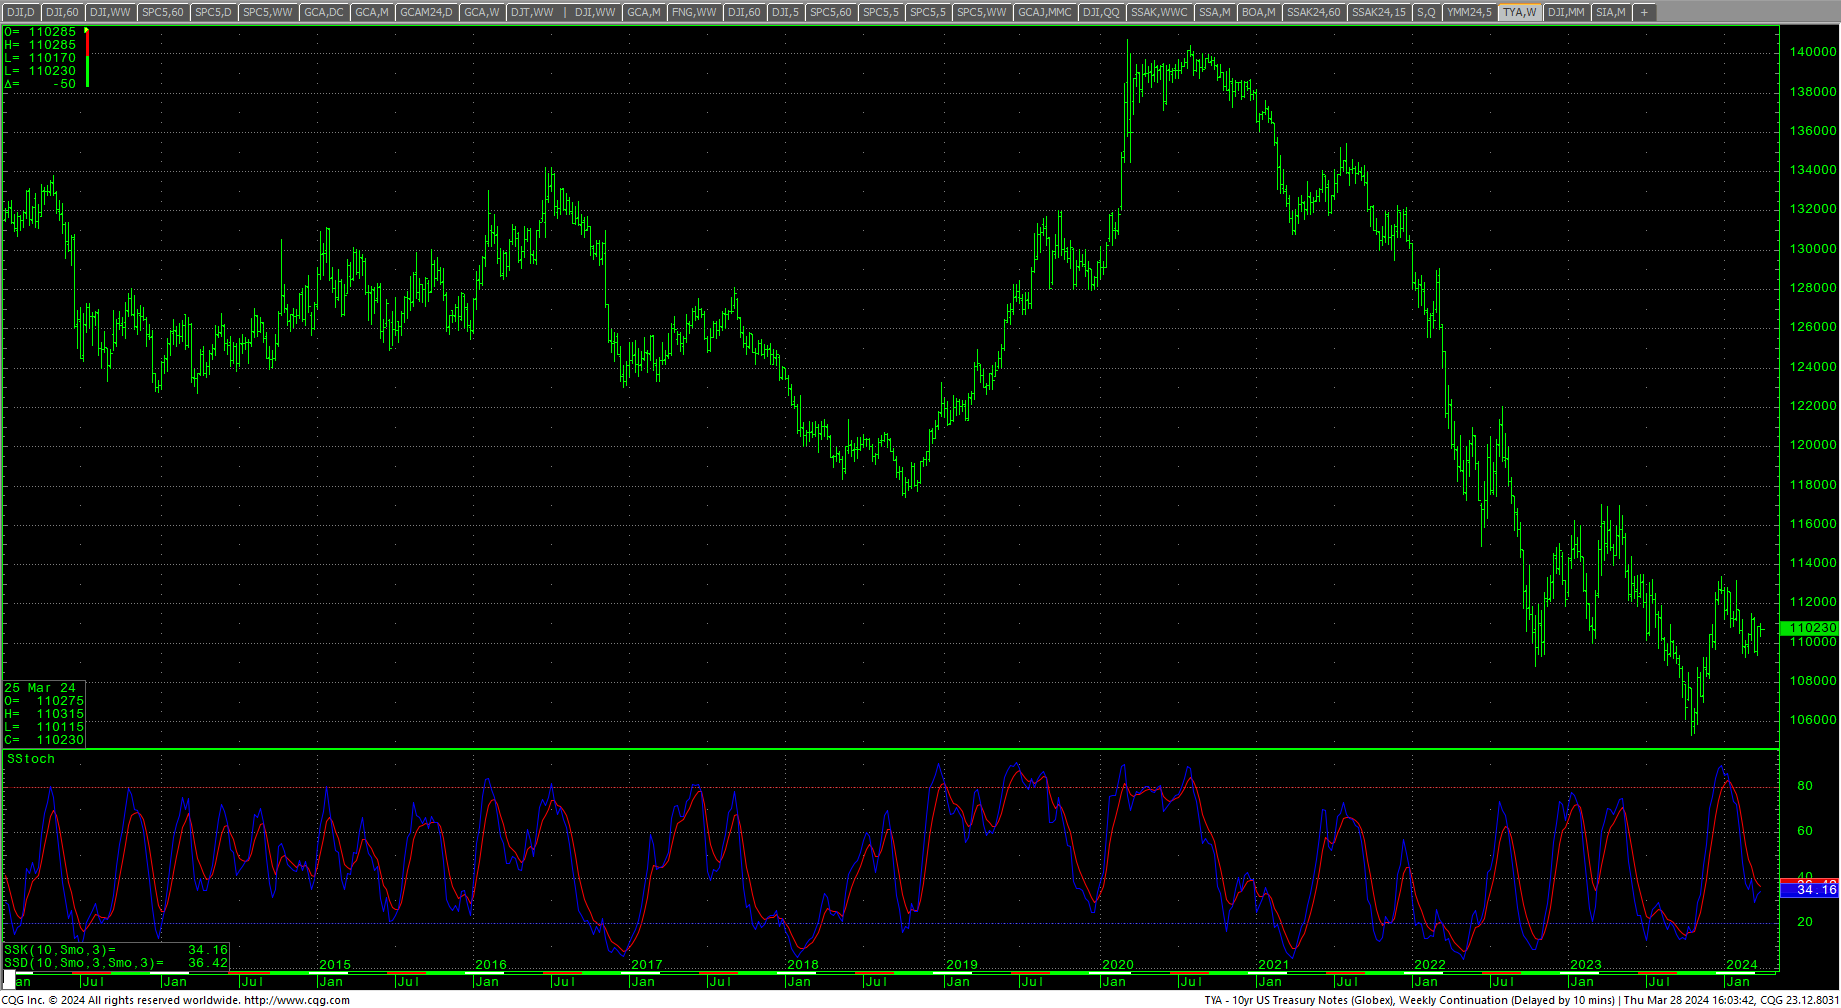
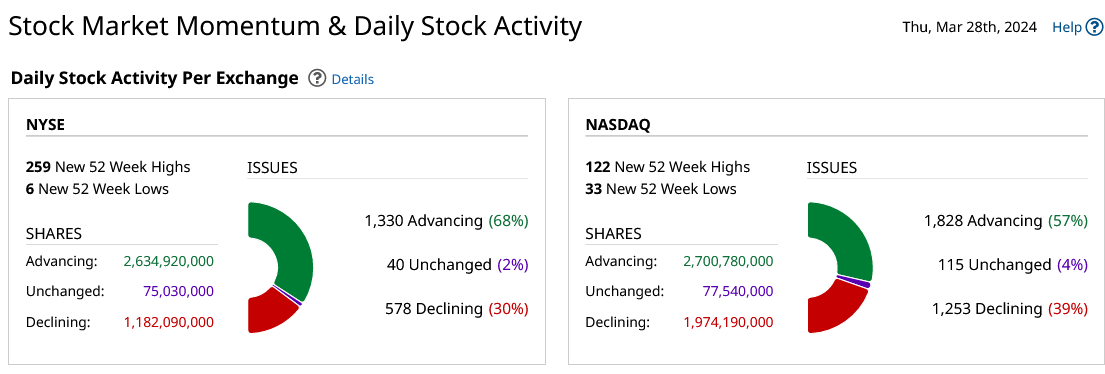 Sentiment indicators remain in greed/extreme greed readings with breadth in extreme greed but still short of the highs set earlier this year. Last week in the AAII Sentiment Survey: Optimism Rises. The Dow A/D line moved up to new highs at 5919. The VIX stayed in a very tight range and closed the week slightly higher. The Put/Call ratio is at 0.75, reflecting greed. The 52-week, A/D moved up to +7.05% (new highs) and indicates extreme greed. The Dow closed the week up +0.87% at a record high. The S&P ended the week at a record high, up +0.39%. The Nasdaq ended the week lower -0.30%, the FANG sold off and closed down -0.89% and the Russell ended the week up +2.54%, a two-year high. The 10-year notes traded an extremely tight holiday range and closed slightly lower, with the yield at 4.206%. (For TYM24 S&R see the last Special Report)
Futures Markets 2024
 Invesco DB Agriculture Fund
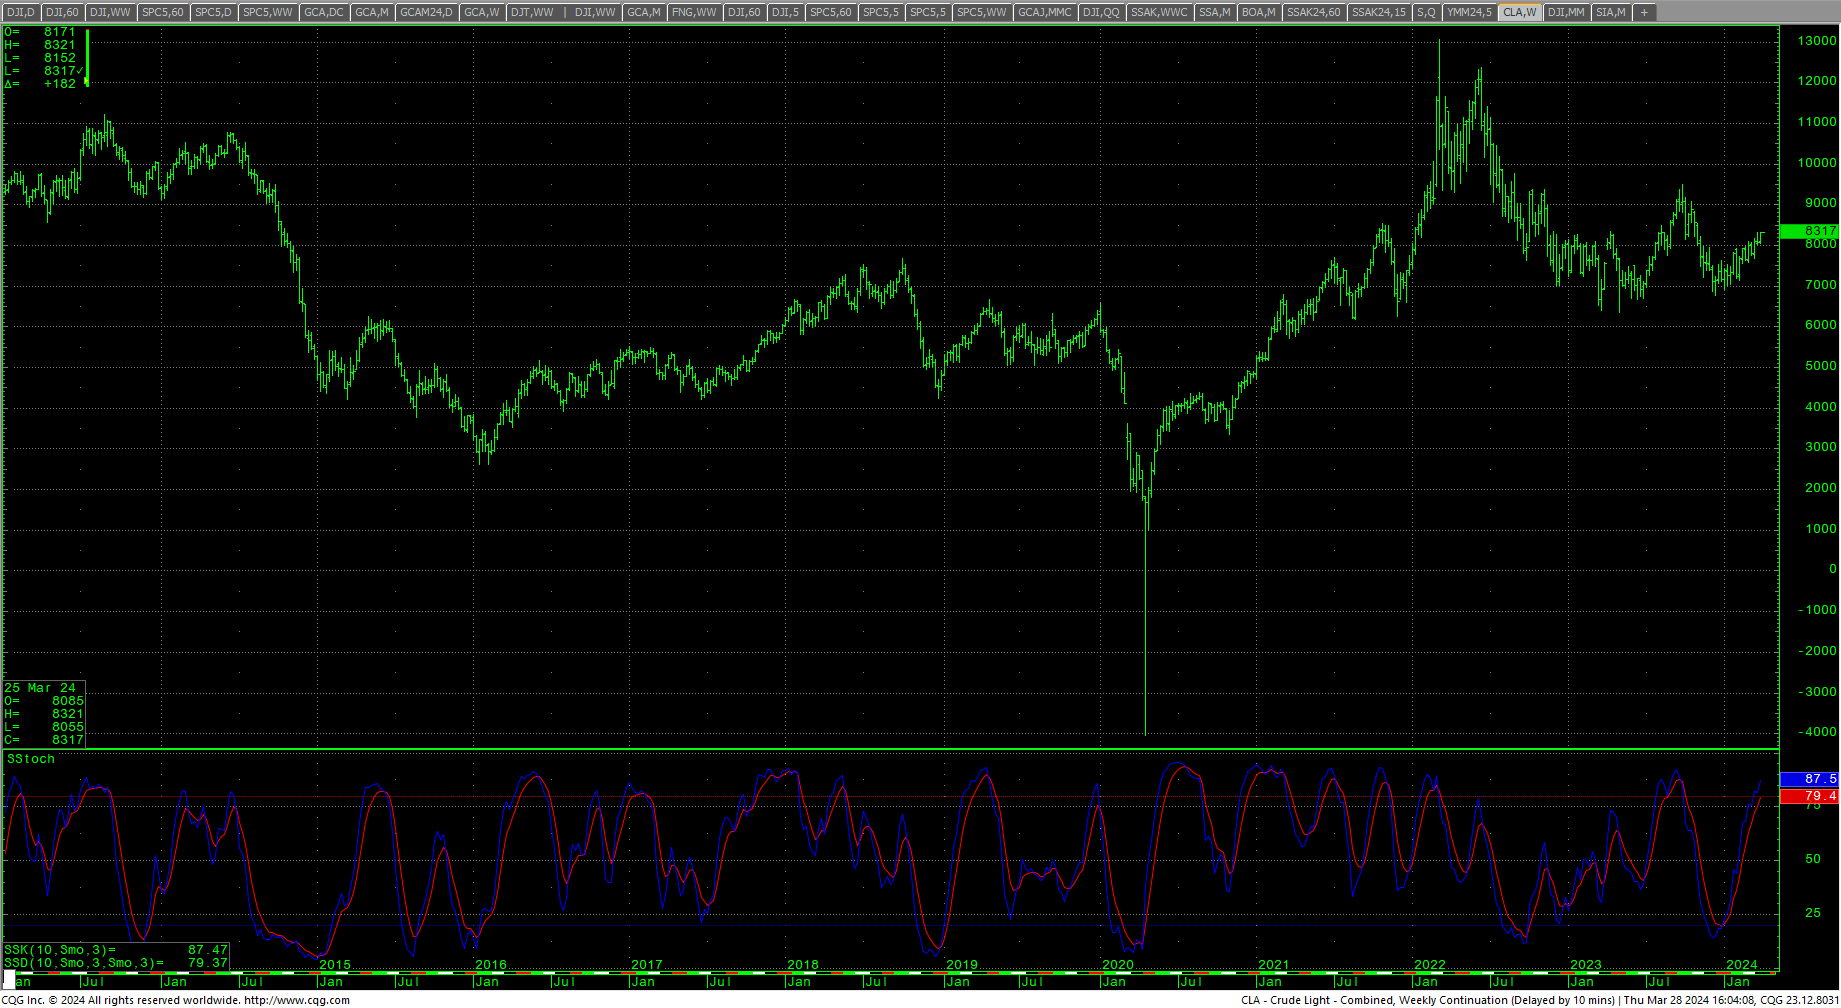
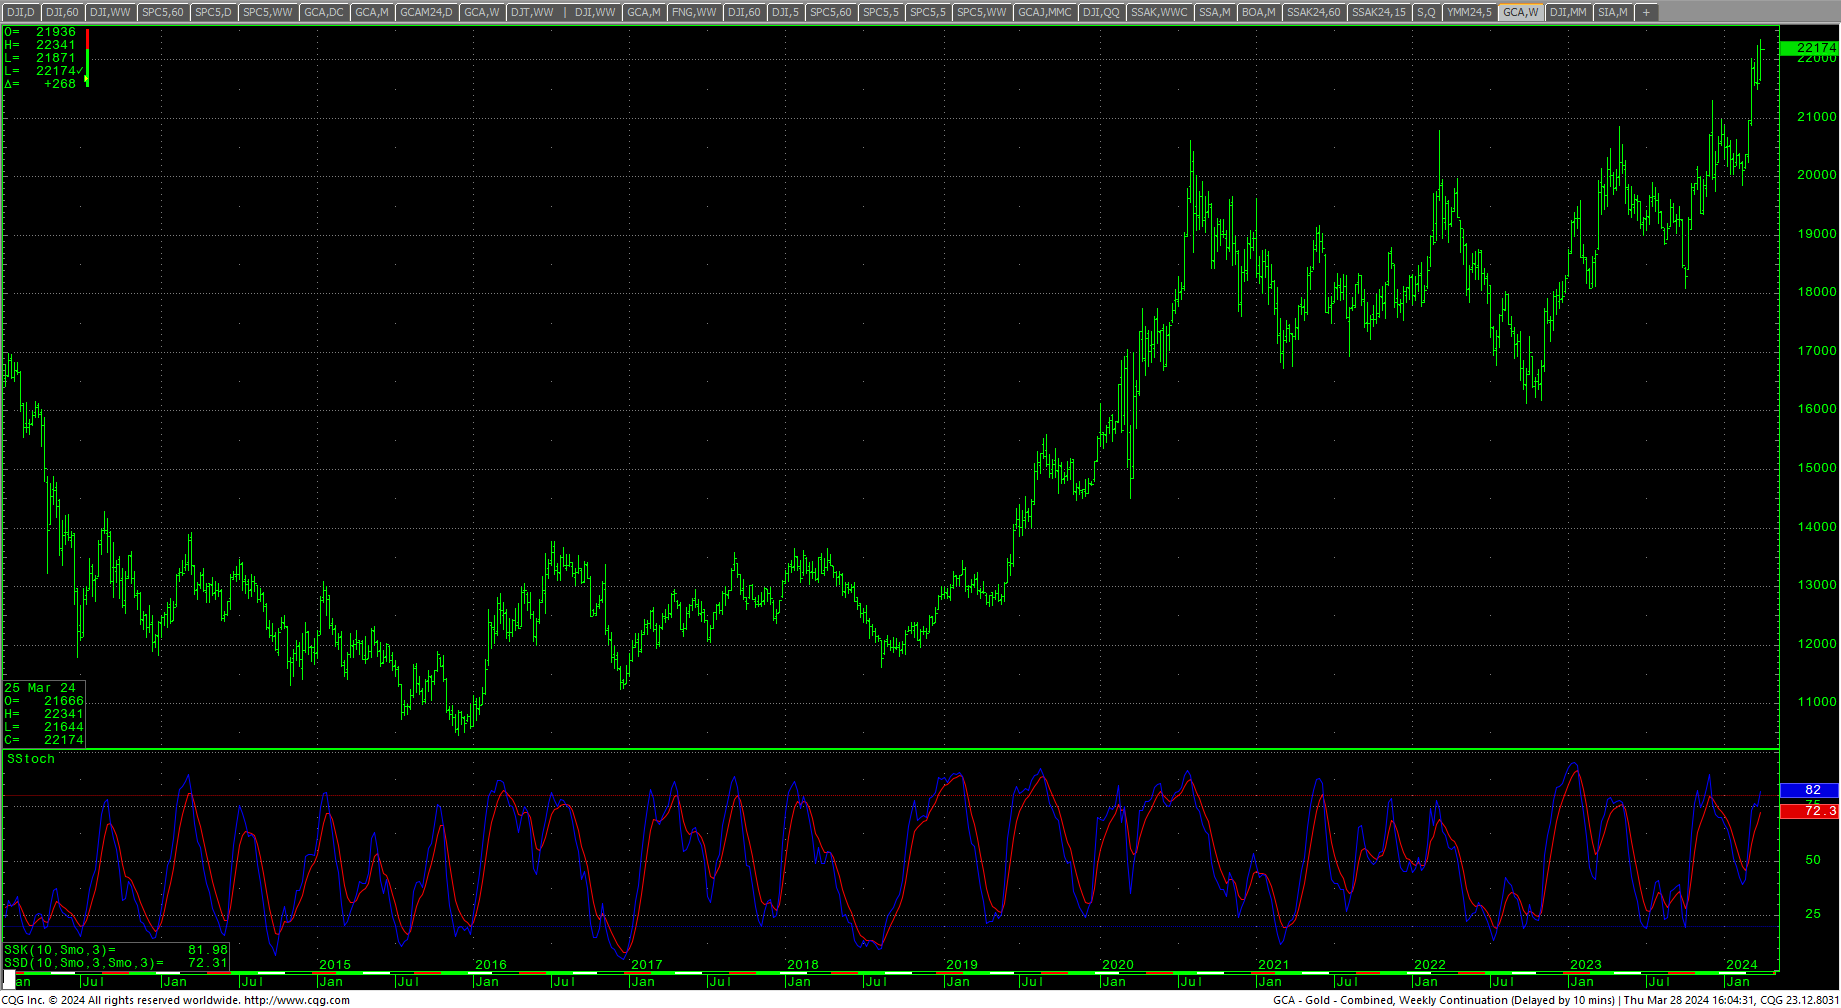
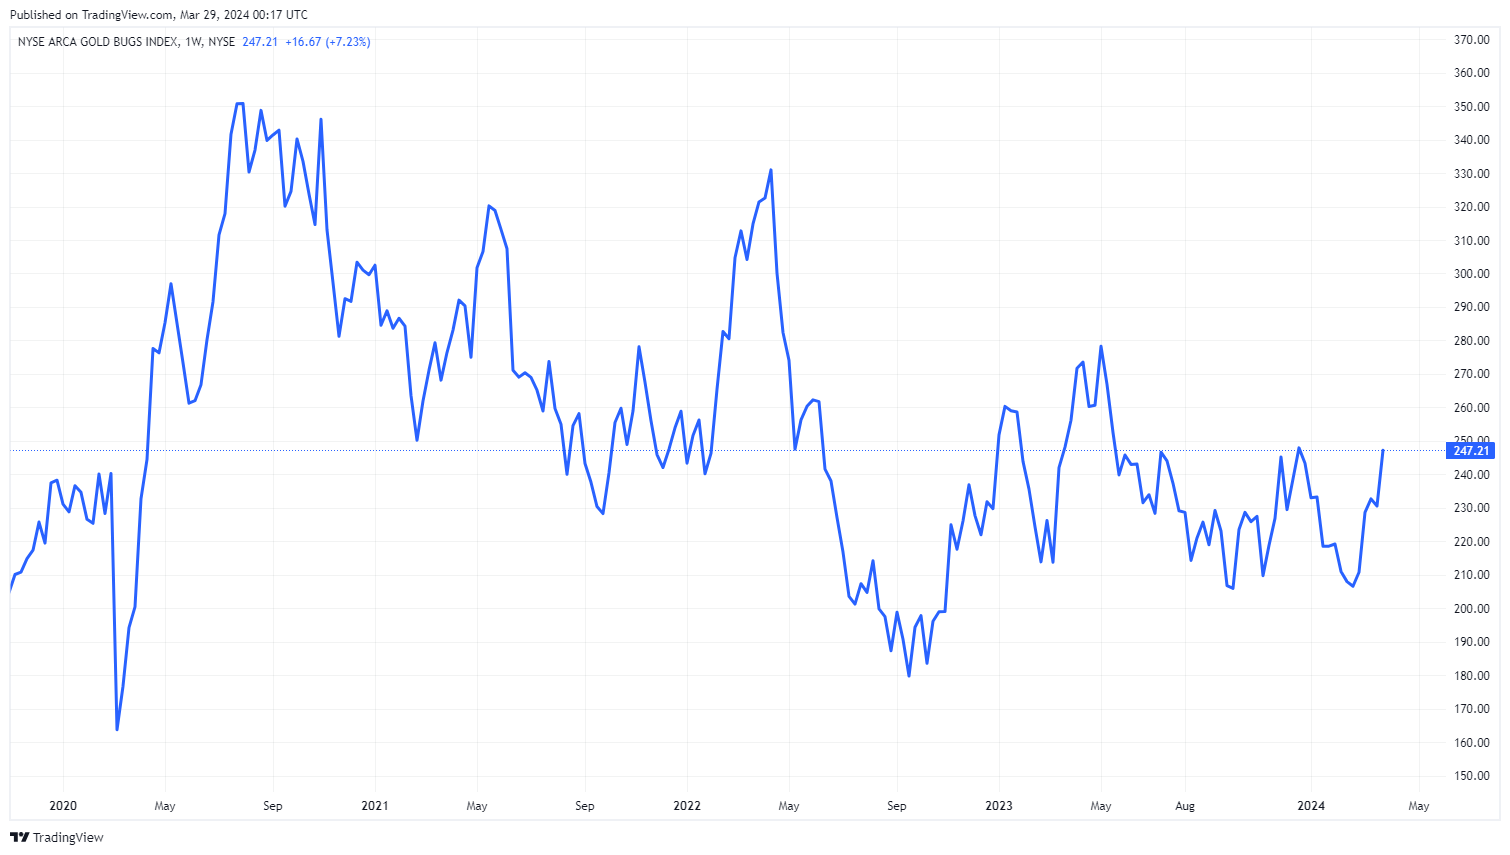
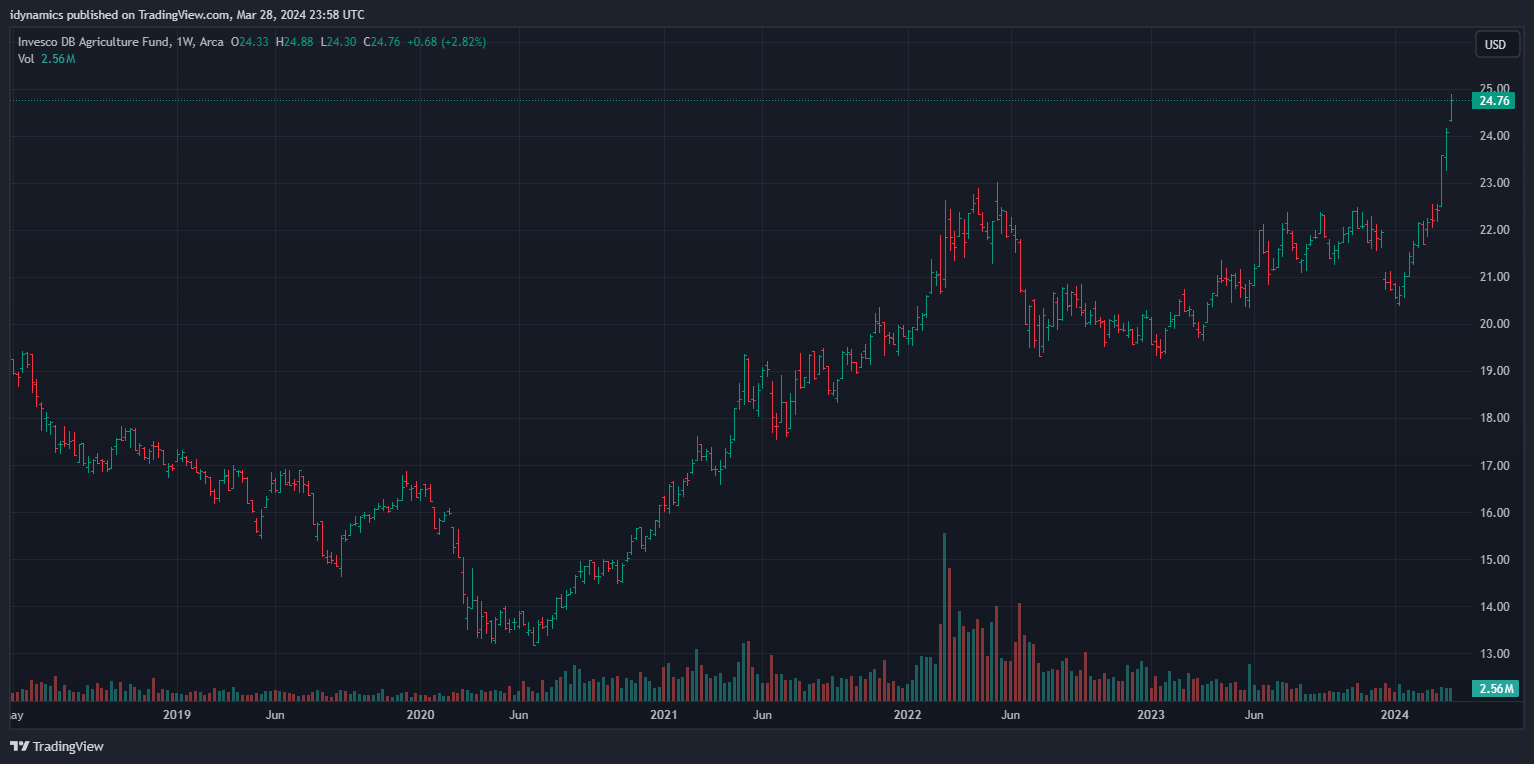 Commodities closed out the week with a rise of +0.78% in the CRB Index. Crude oil rallied to close at the highest weekly settlement since 23 October 2023 as prices are now above the $80 mark. Gold rallied to an all-time record high close above the $2200 area, on the top of the week’s range. The HUI Gold Bugs Index is testing the highest levels since 15 May 2023. The CoT is still not offering any major clues and does not point to any extreme.
Timing Points
Thursday marks minor daily timing. We are now in a period of critical intermediate-term timing that runs through April 30th and possibly into the middle of May.
- 04/04 **
- 04/10 **
- 04/15 **
- 04/19 *** X
- 04/29-30 *** X Key week for financials
CNN Fear & Greed Index
 AAII Investor Sentiment Survey
 Dow Jones Industrial Average Hourly HLC
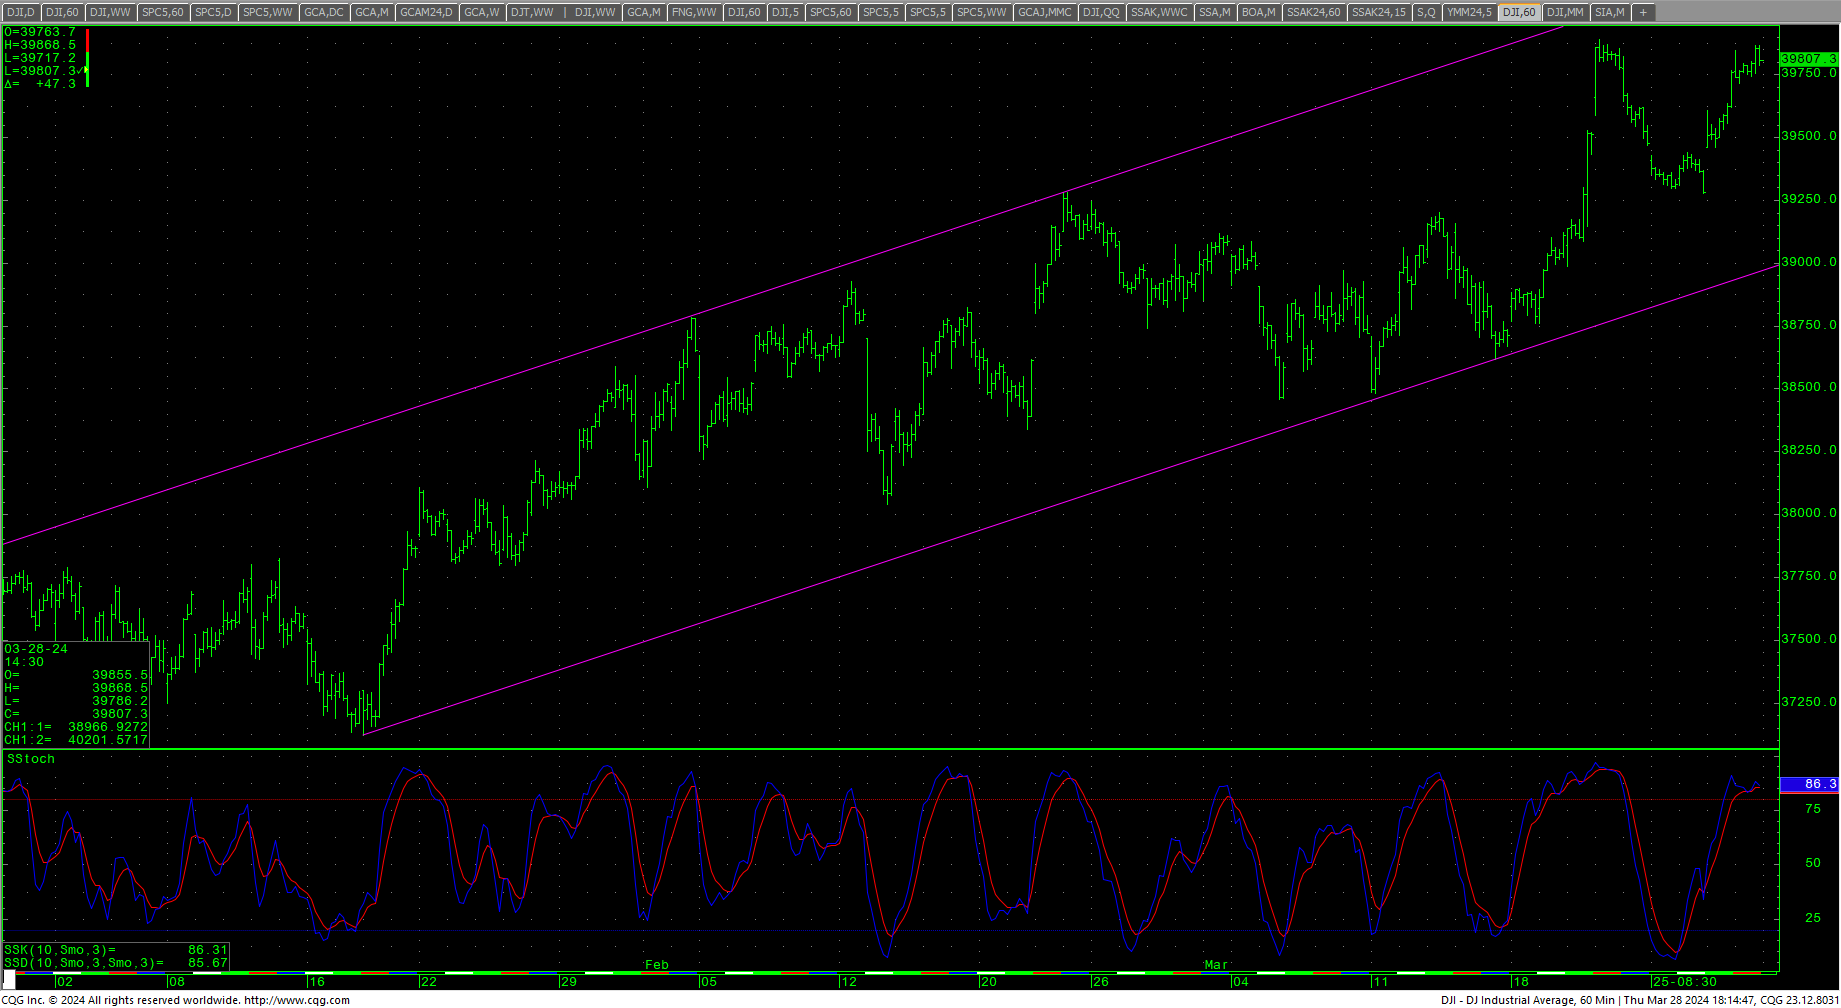 The Dow ended the short week higher as the hourly moves back into overbought conditions. Prices came within a fraction of the current intraday trading high and closed at a record high daily and weekly close. The action leaves the bulk of the numbers the same as we head into April, where we can see increased volatility. The MACD is turning up along with the stochastics and prices need to continue higher to support the oscillators. Prices ended the week with an inside week but another bullish candle.
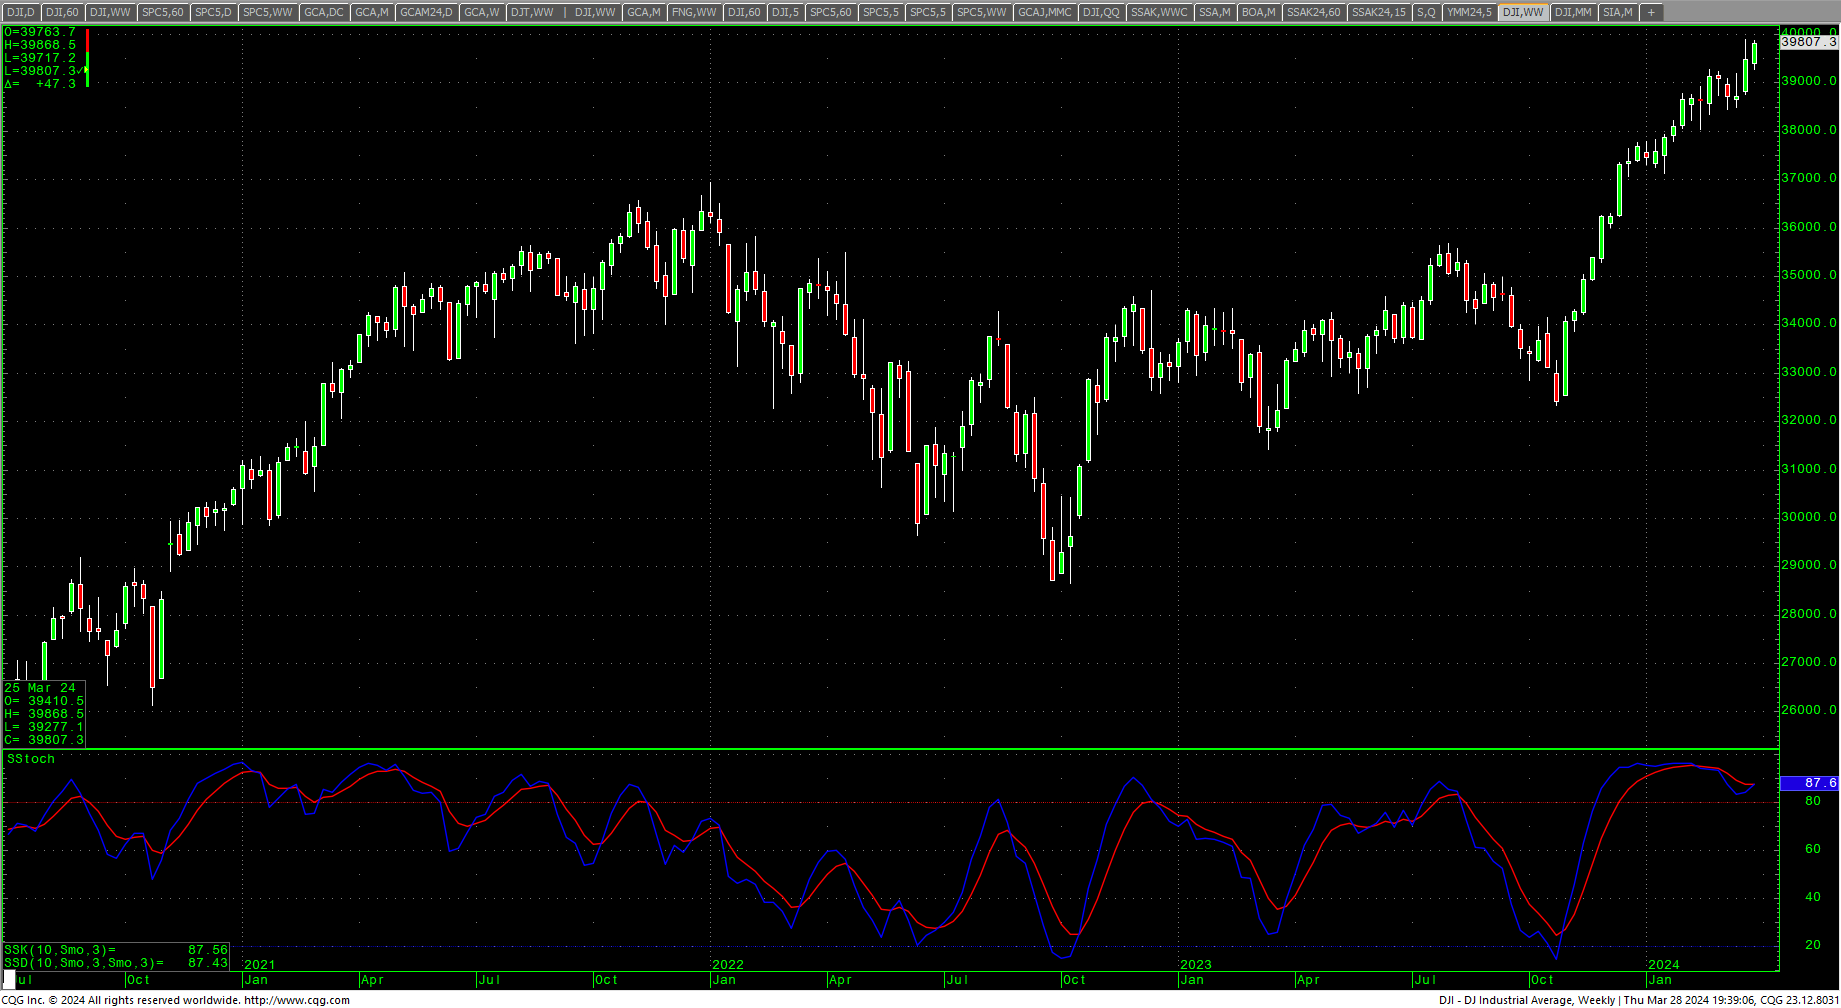
Dow Jones Industrial Average Weekly Candles
 Dow Jones Industrial Average Daily H-L-C
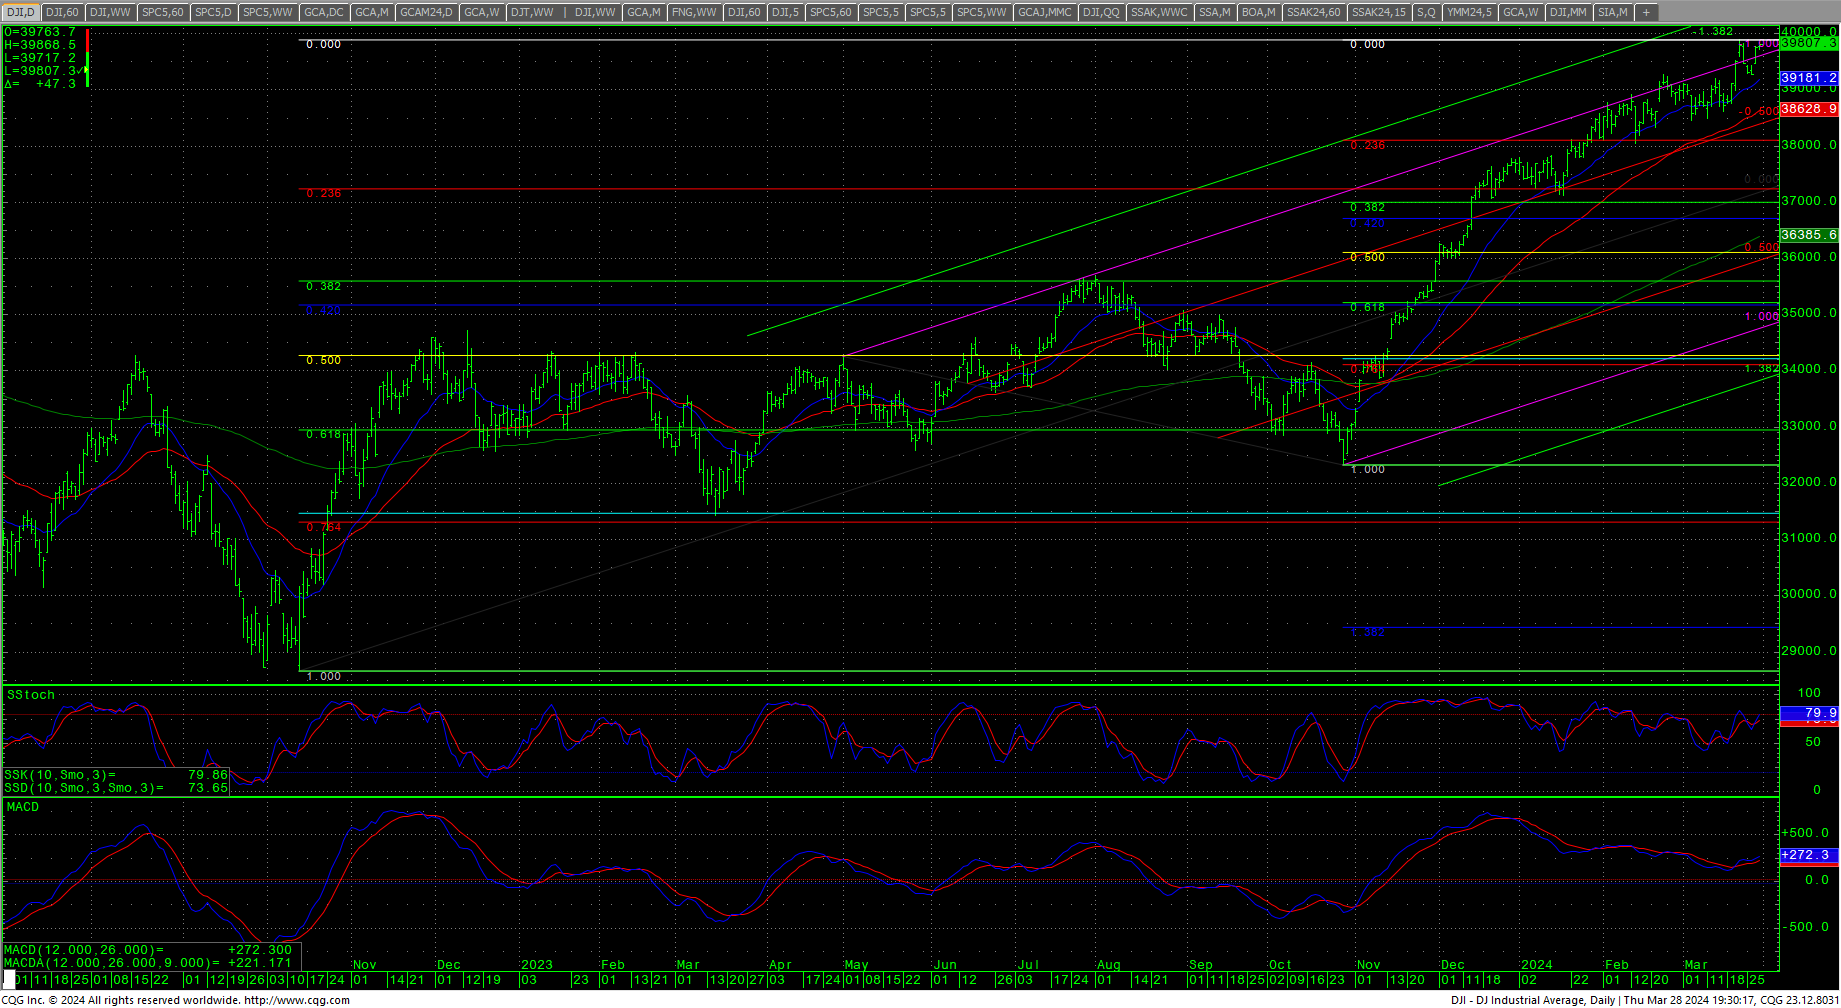 Further rallies should test the intraday highs at 39889/39890. Closes over 39890 will renew momentum toward a daily target at 40106.6 and weekly objectives at 40245.4/40250…with 40000 as a critical/pivotal psychological area. The 2021 inflation-adjusted highs are 40010 and 40250, and 40300. Closes over 40250 will offer longer-term potential to monthly targets in the 45244 area. Above 45244 gives monthly counts to 47400.
Dow Jones Industrial Average Monthly Close: Inflation-Adjusted
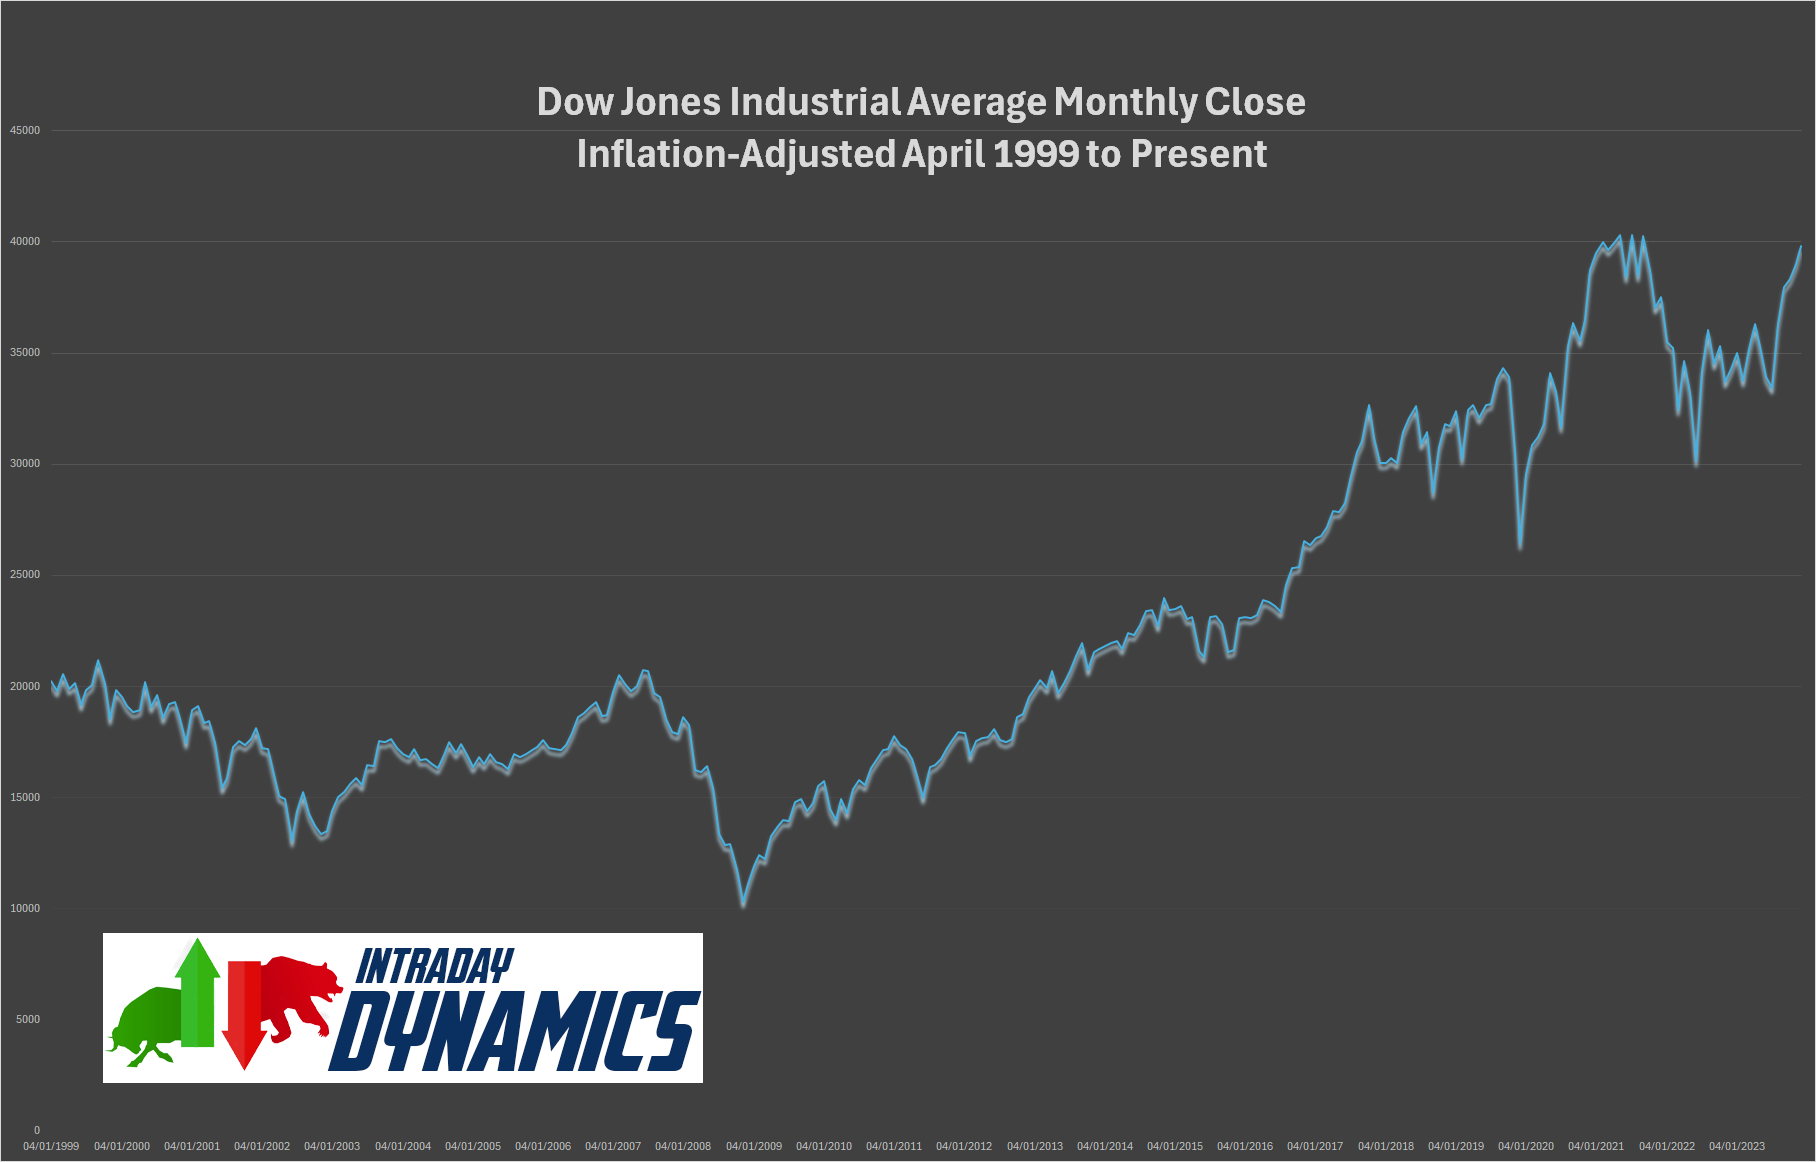 Support is 39552 and 39345. A breakdown under 39345 can test 39177 with counts to pivotal short-term support of 39008/39000. Closes under 39000 set up a move to 38832 with potential to 38505 and full potential toward critical support of 38179/38170. Closes under the 38170 area can test 38714/38775. Closes under 38775 will open counts to 38000 with potential to critical support of 37239/37122. Closes under 37122 open counts to 36713 and 36108. A breakdown under 36108 will open counts into 35599 level with full potential to 35215/35200.
Resistance
|
Support
|
S&P 500 Cash Index
S&P 500 Index Hourly HLC
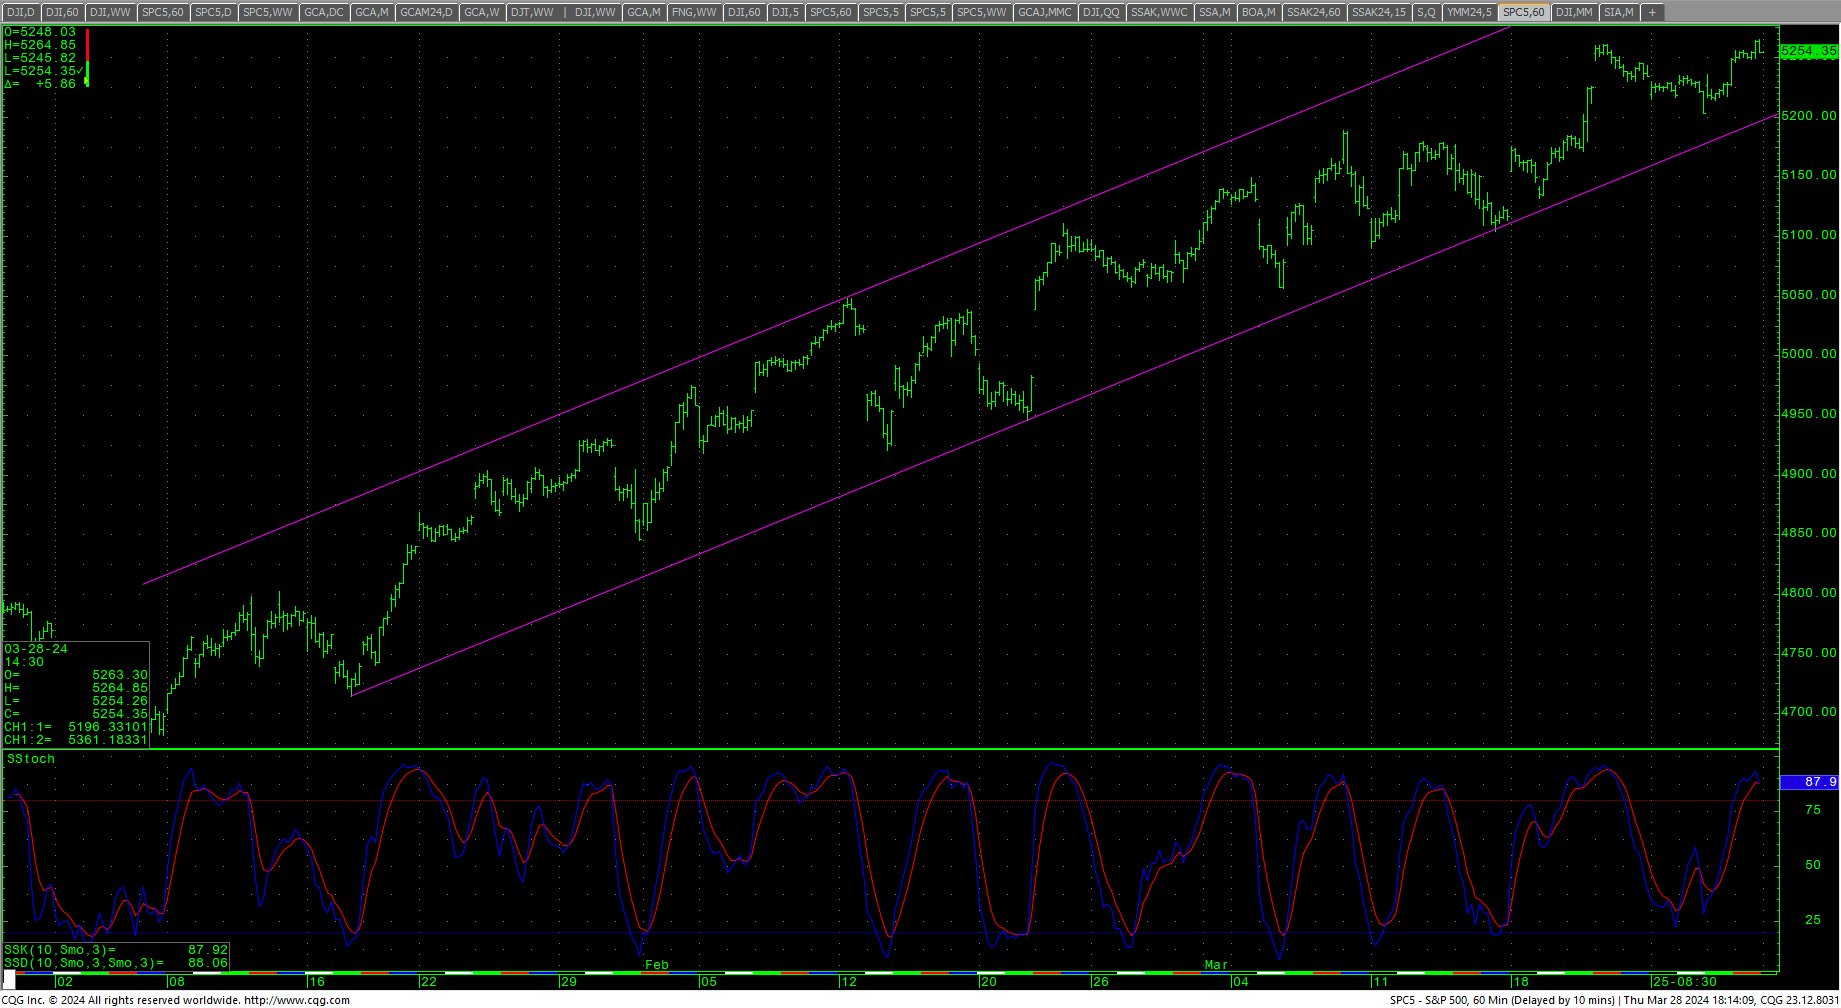 The S&P rallied to a record intraday and closing high for both the daily and weekly charts and closed out the weekly slightly overbought on the hourly charts. The action doesn’t change the major numbers all that much but the close is friendly as prices sit just under the next potential upside objective at 5288. Resistance is 5269/5270. A drive over 5270 counts to 5288. Closes over 5288 will open counts into the 5432 level. A breakout over 5432 will open potential to the 5576 with counts into the 5720 area. Closes over 5720 offer upside targets at 6000/6008.
SPY Weekly
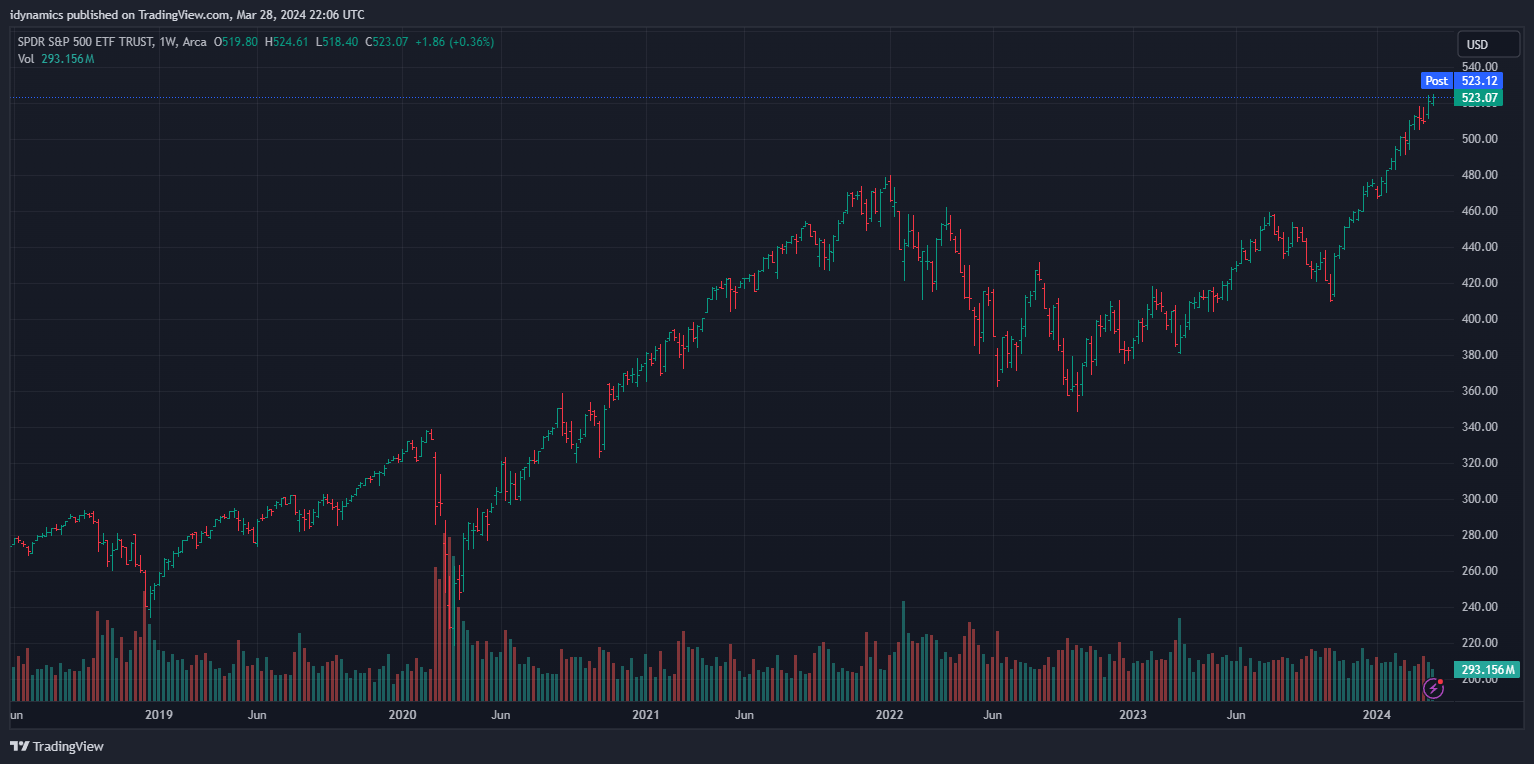
S&P 500 Index Weekly HLC
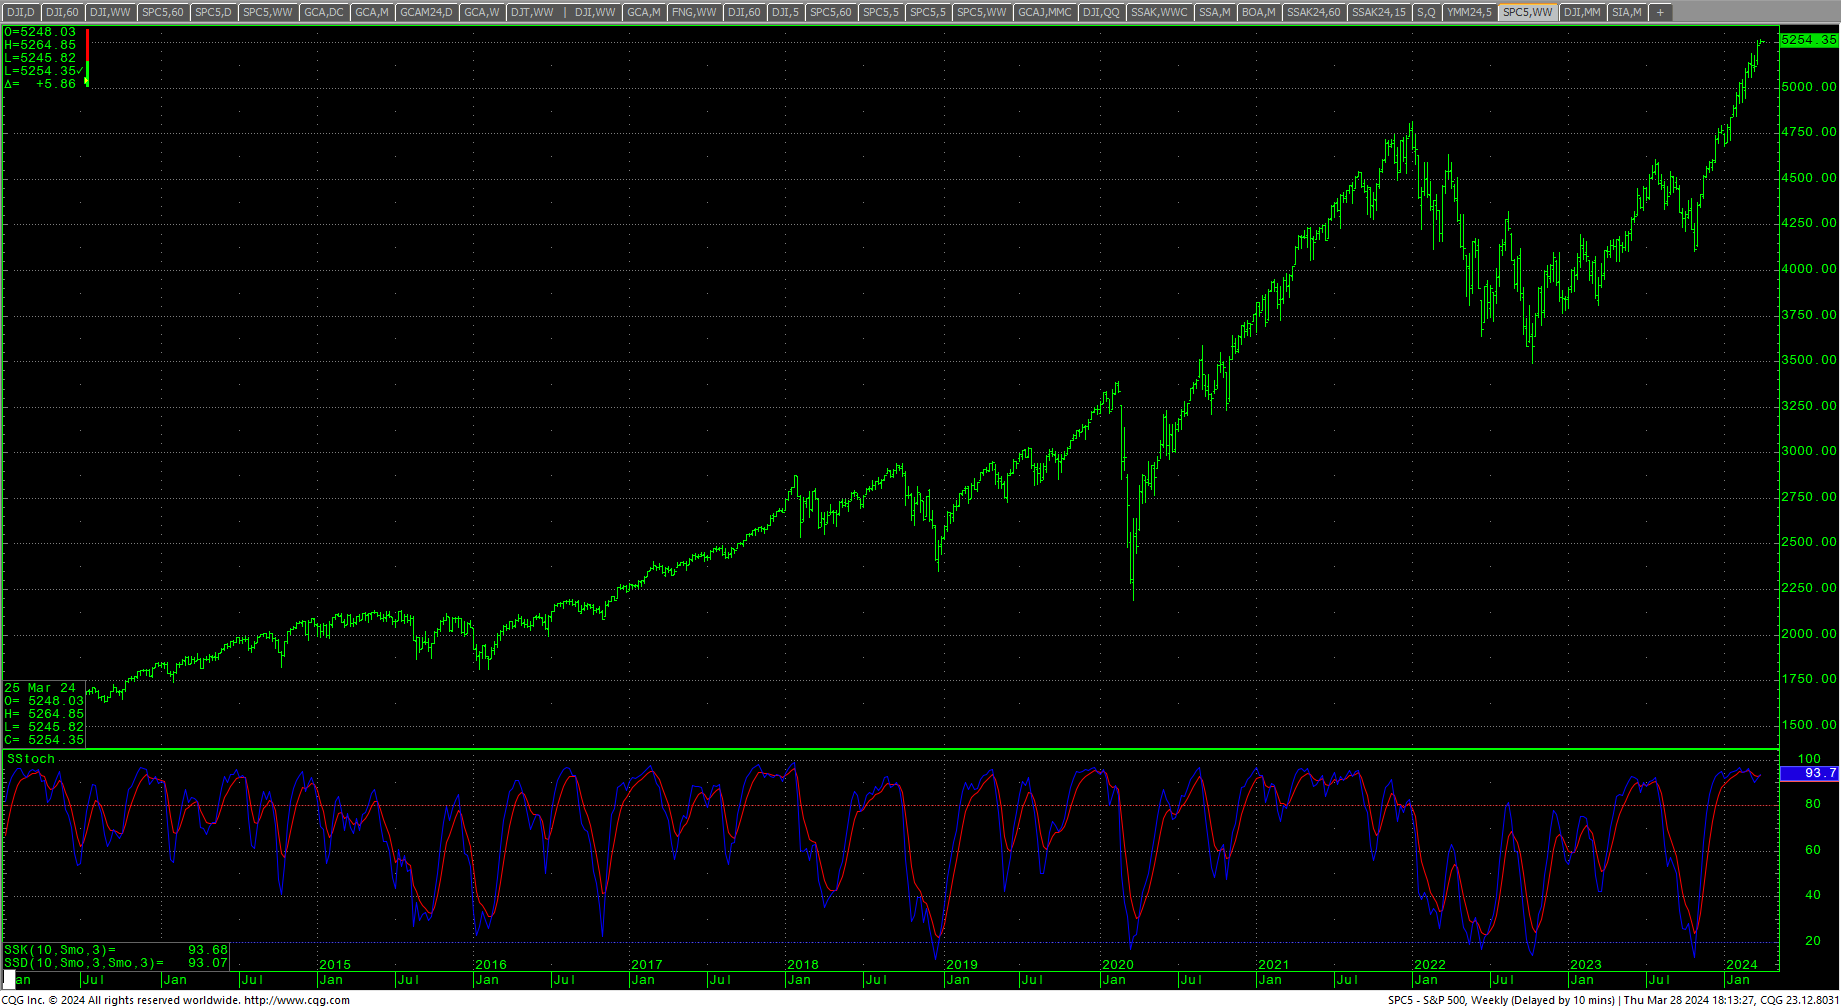 Support is 5212 and 5180. A breakdown under 5180 should test 5155 with potential to pivotal short-term support at 5129/5125. Daily closes under 5125 can carry to 5045/5038 with counts to 4977 and critical short-term support of 4909/4905. A breakdown under 4905 sets up a move to 4587. Closes under 4587 give counts to 4378 with potential to daily support at 4168/4160.
Resistance
|
Support
|
Charts courtesy of CQG, Inc., CNN, Koyfin, Trading View and AAII


