
TECHNICAL ANALYSIS (by Intraday Dynamics)
What Is an Island Reversal?
 S&P 500 Index Hourly HLC
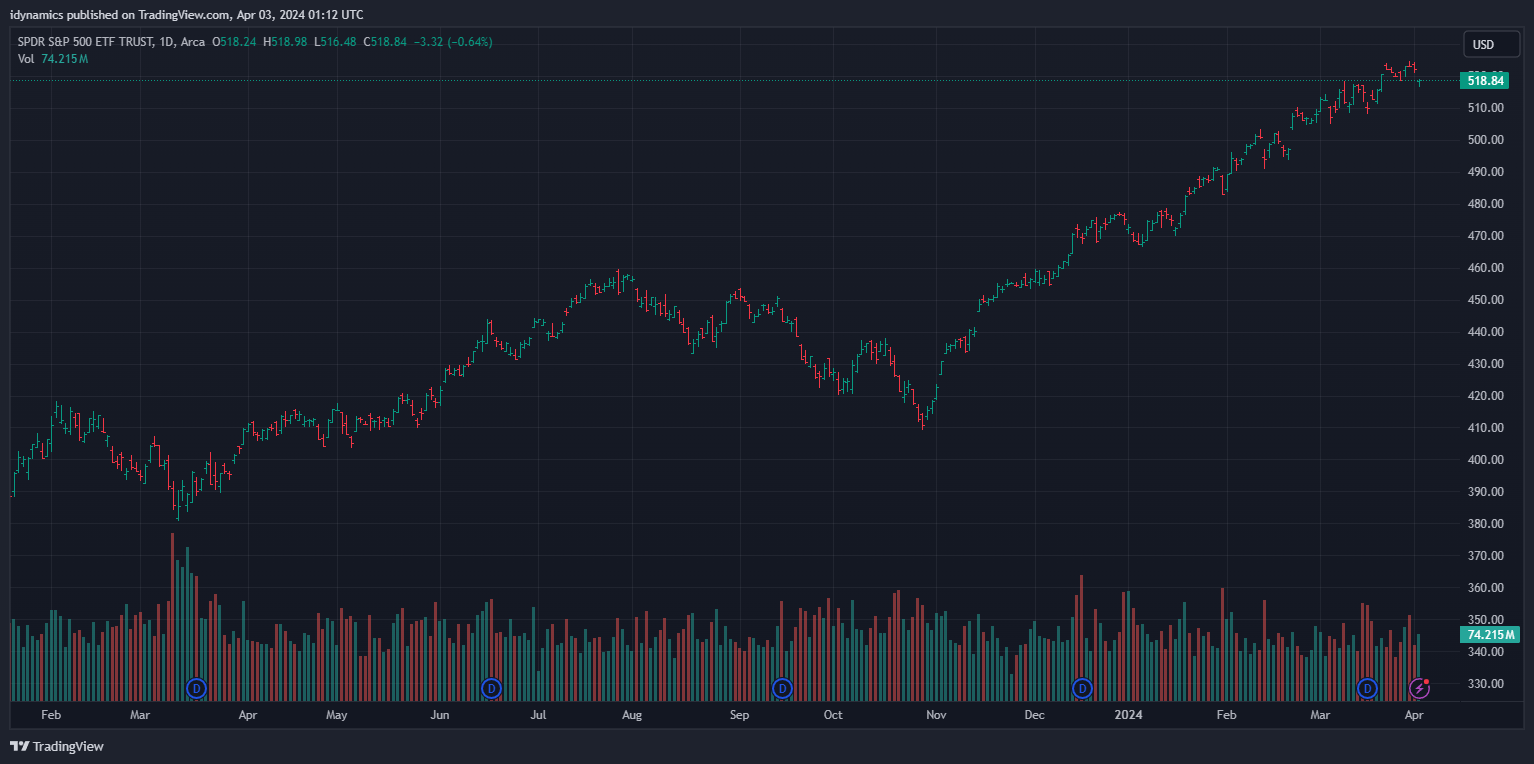
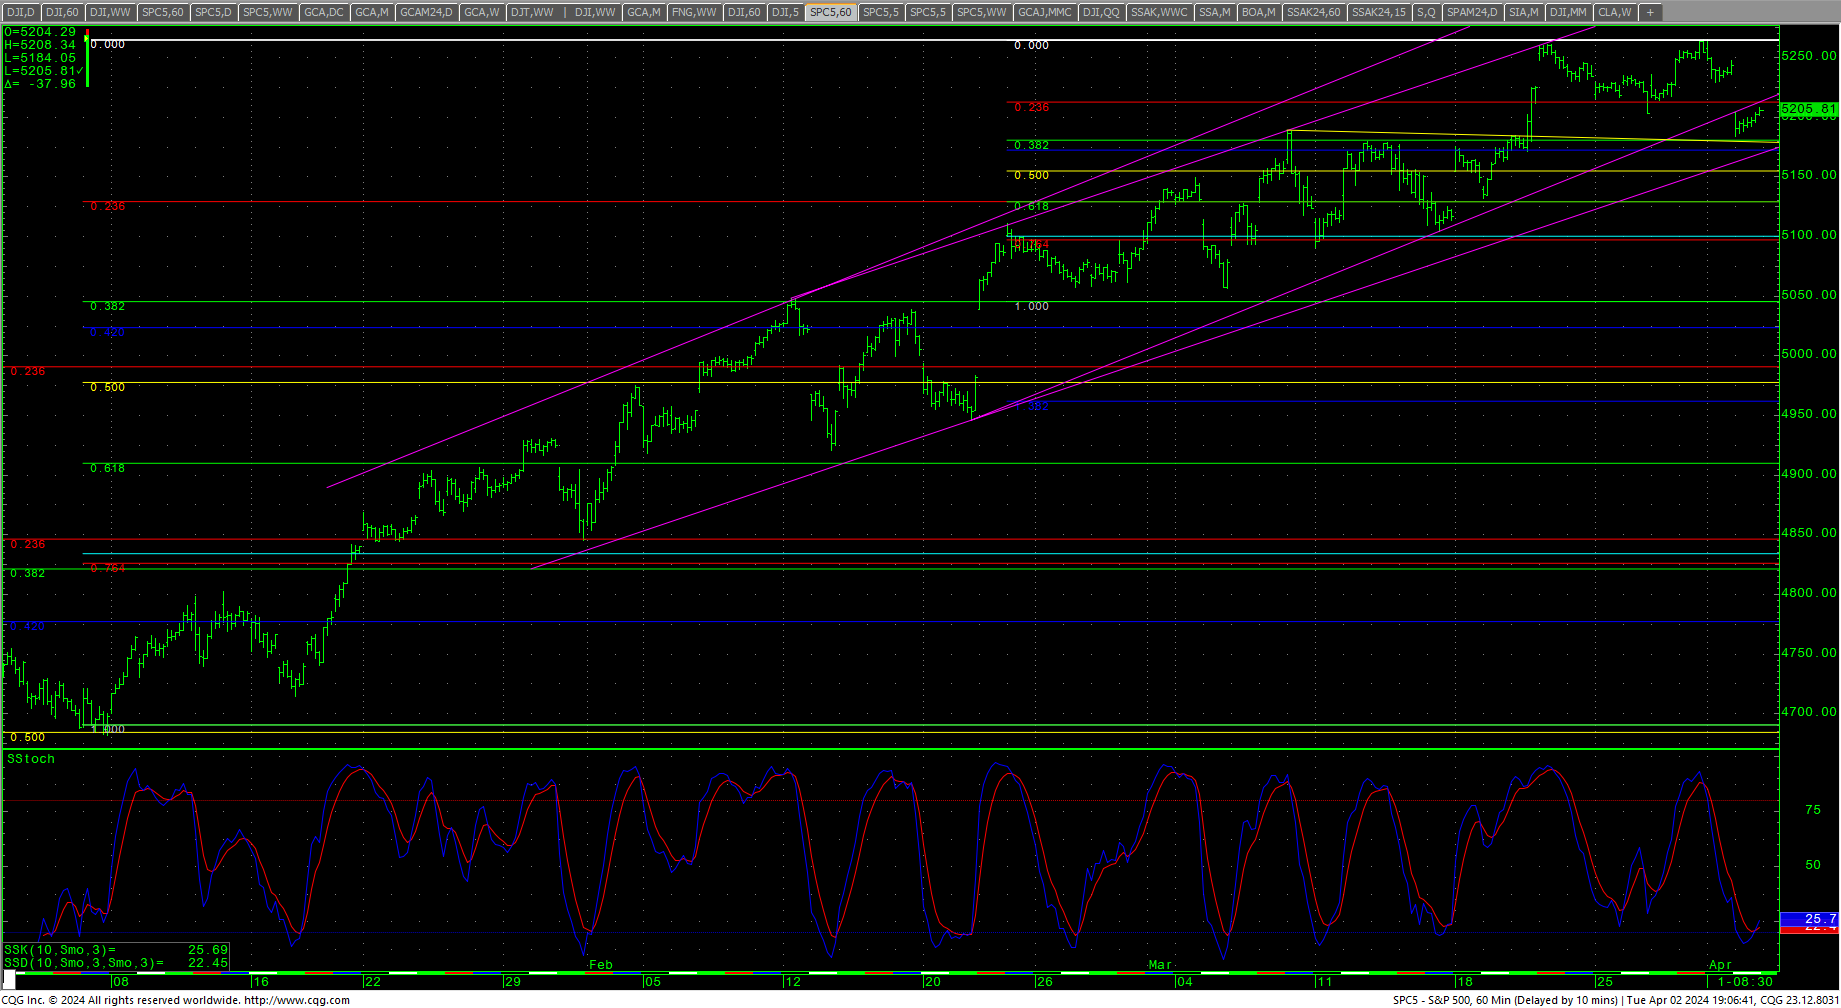 The S&P 500 gapped into lower trade on Tuesday and the cash index now has a large 7-day, island top on the hourly chart. (The daily SPY shows the same large island.) The hourly reached oversold conditions in Tuesday’s trade. Prices gapped under a steep trendline and tested the last breakout area, and pulled up just short of support at 5180. A continued breakdown under 5180 should test 5155 with potential to pivotal short-term support at 5129/5125. Daily closes under 5125 can carry to 5045/5038 with counts to 4977 and critical short-term support of 4909/4905. A breakdown under 4905 sets up a move to 4587. Closes under 4587 give counts to 4378 with potential to daily support at 4168/4160.
SPY Daily H-L-C
 Resistance is 5215, 5224 and pivotal at 5233/5235. Rallies over 5235 should test 5244/5245 and opens potential back to 5264/5265. A drive over 5265 counts to 5288. Closes over 5288 will open counts into the 5432 level. A breakout over 5432 will open potential to the 5576 with counts into the 5720 area. Closes over 5720 offer upside targets at 6000/6008.
Resistance
|
Support
|
Charts courtesy of CQG, Inc., and Trading View


