
TECHNICAL ANALYSIS (by Intraday Dynamics)
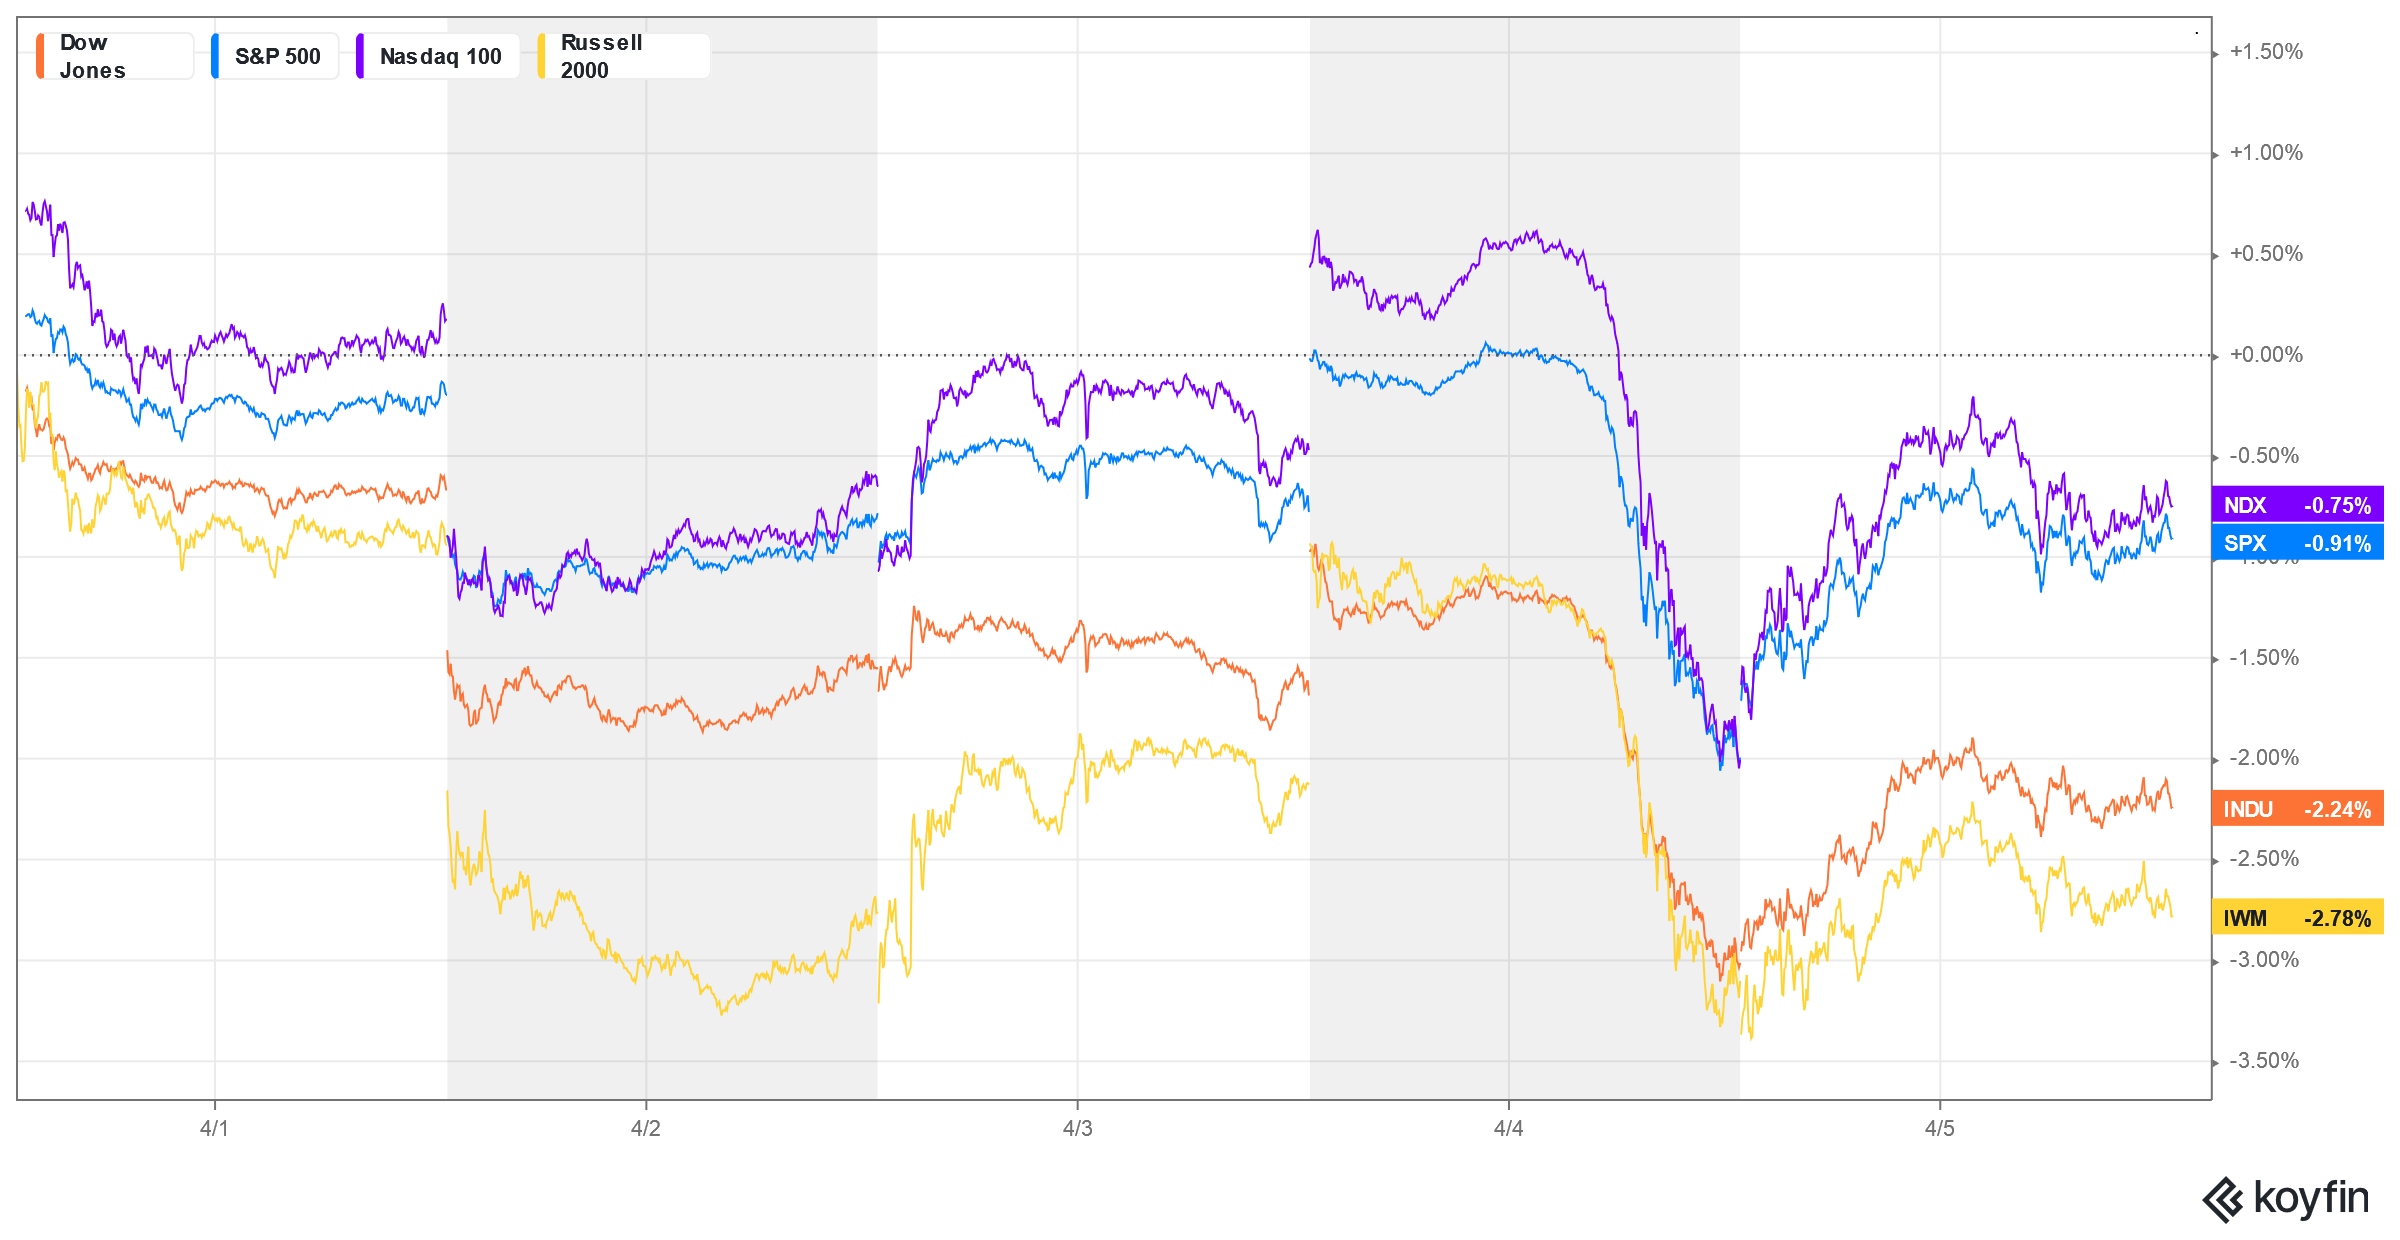
Major Indices Week of April 5, 2024
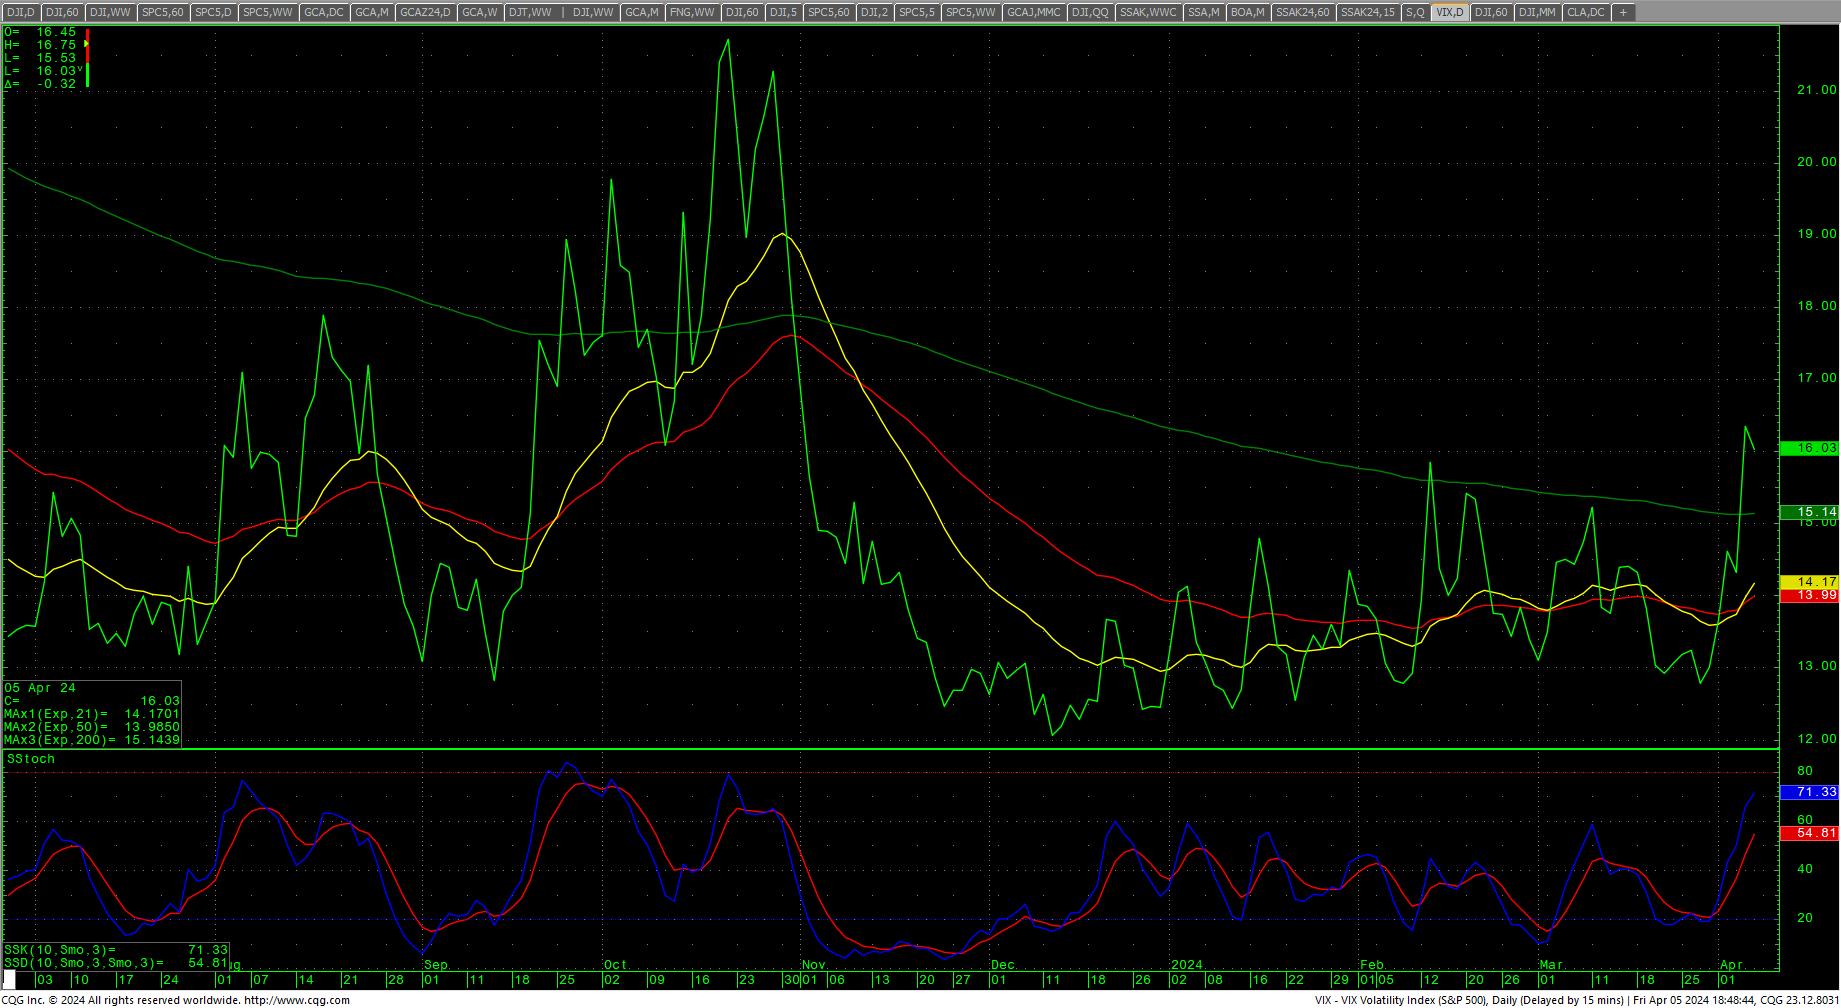
 VIX Volatility Index Daily Close
 DJIA Daily Candles
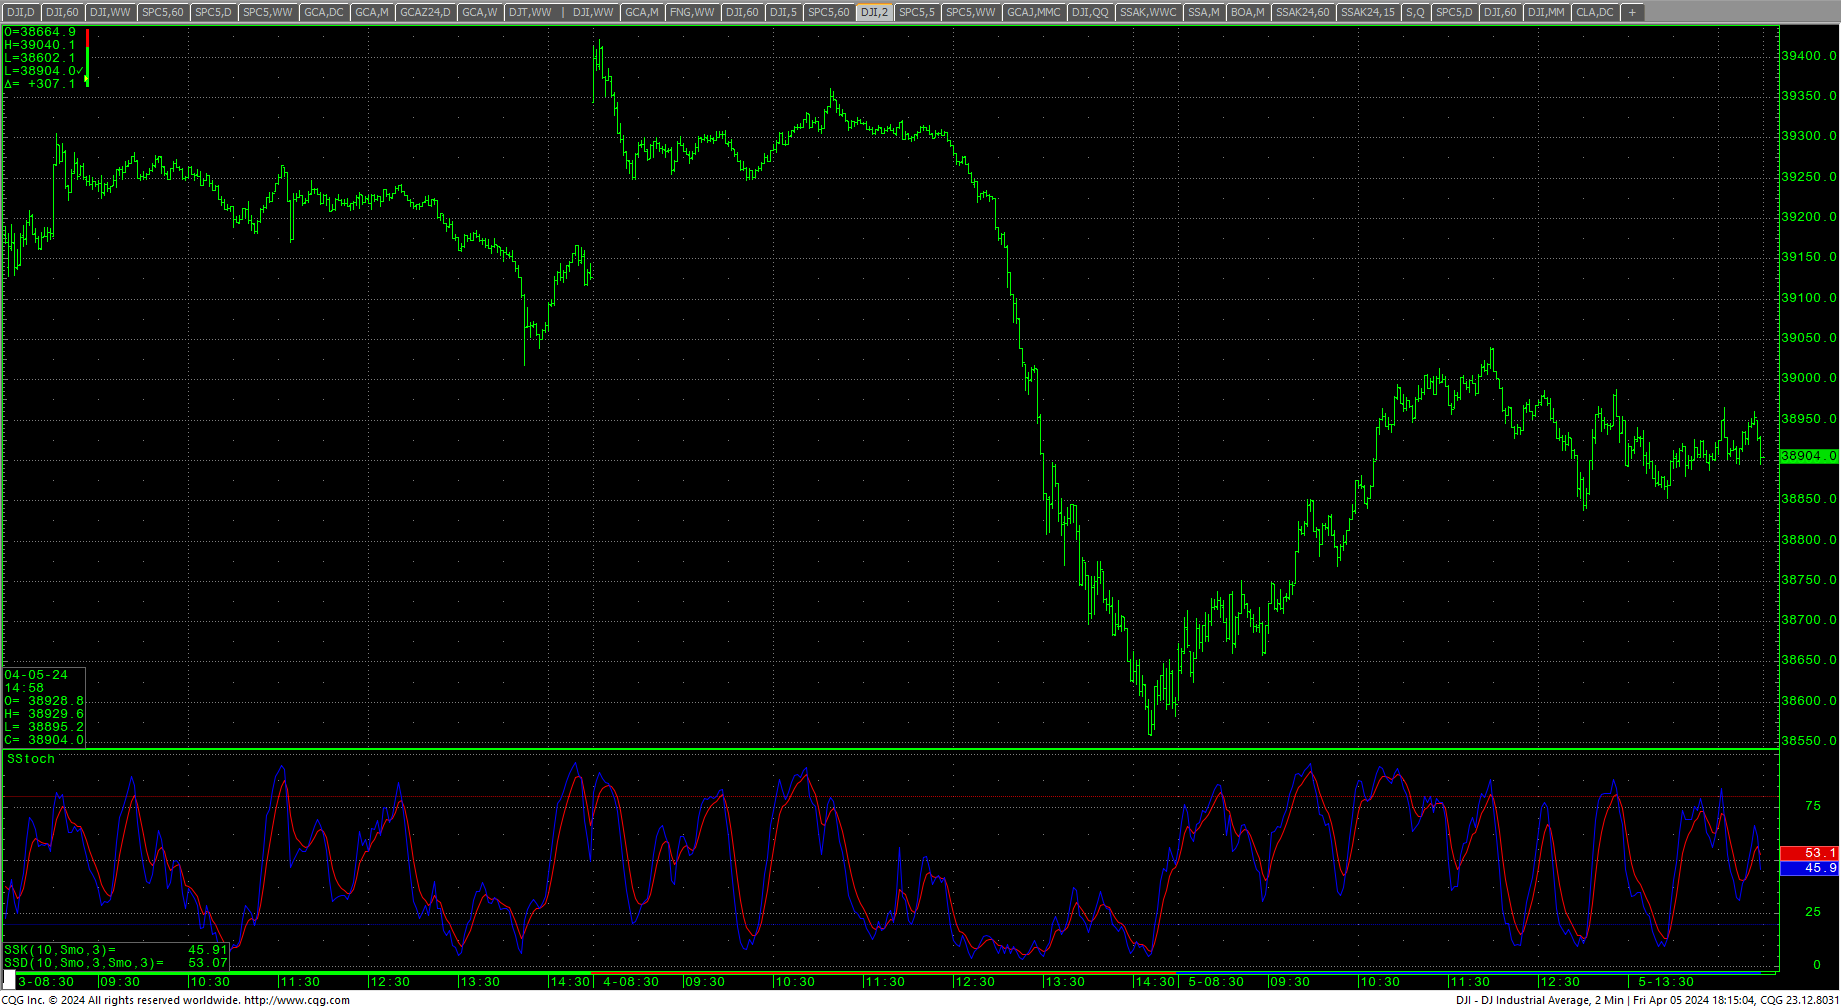
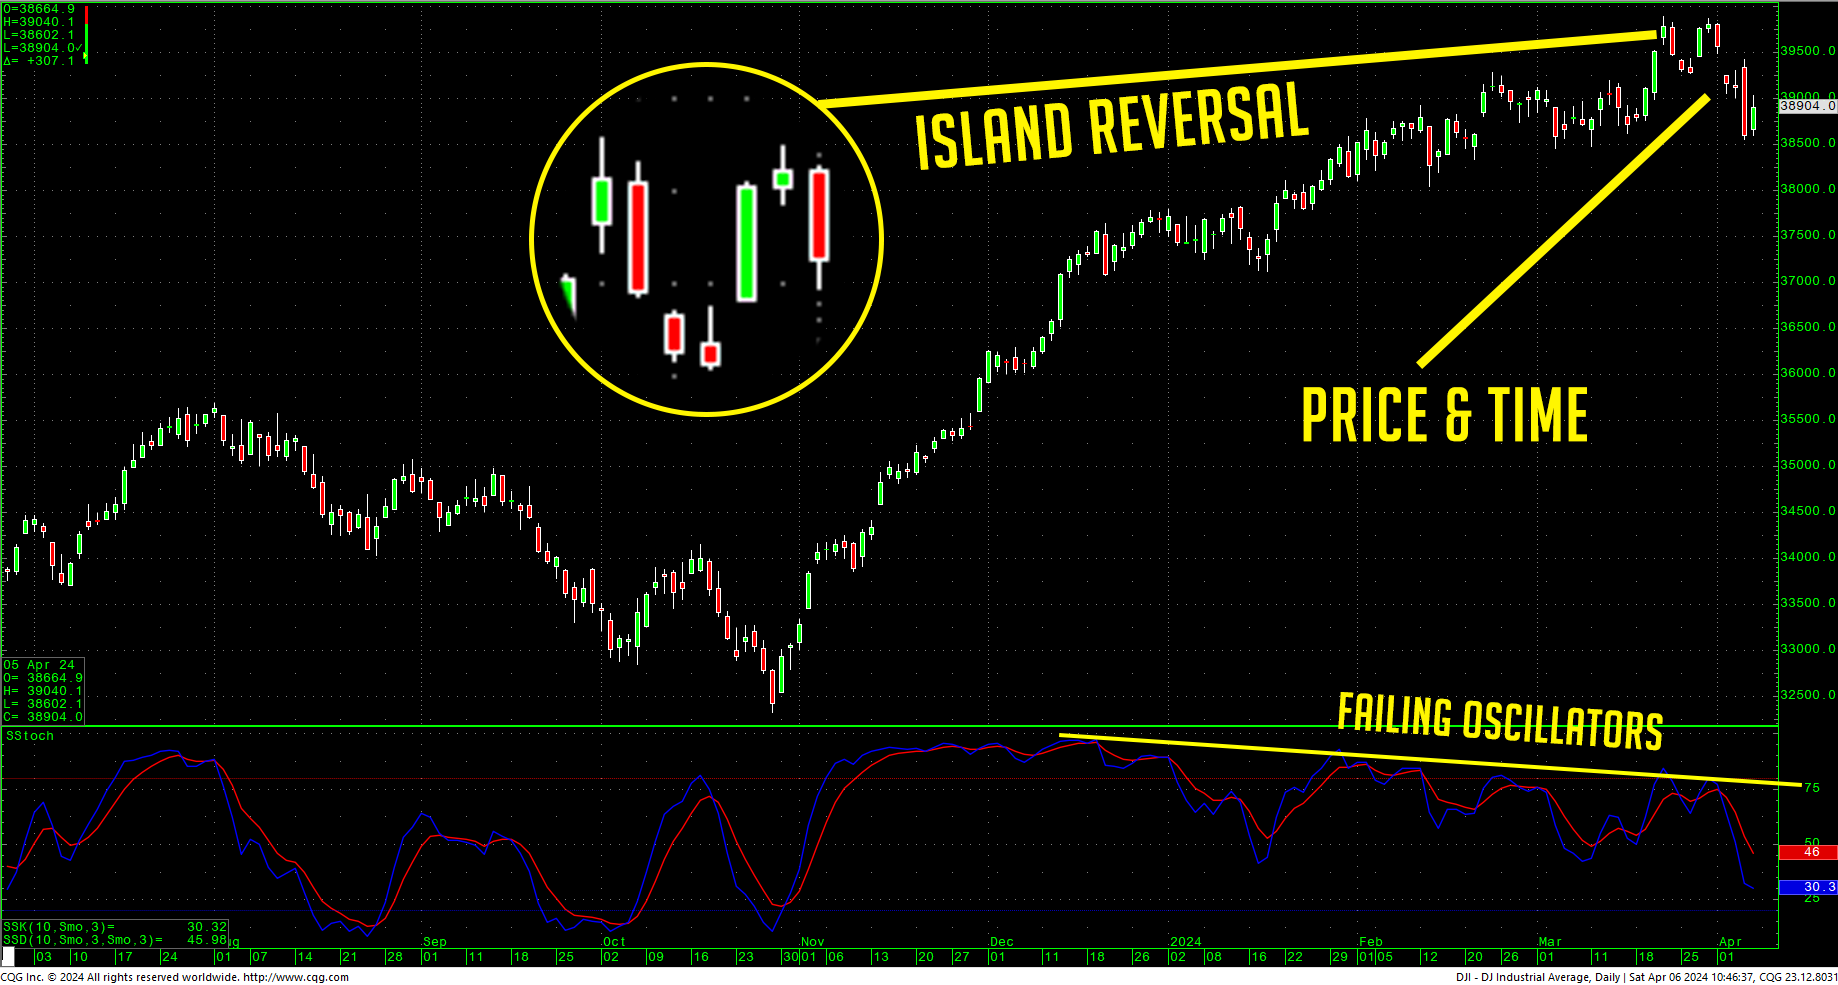 Stocks got a dose of the start of this critical cycle timing window as prices seesawed through some wide ranges in manic trade. Thursday’s timing saw a whipsaw trade of over 2% for the Dow and the S&P and was outlined in the short-term update here. The 2-minute chart shows haw crazy trade was late last week. Both the Dow and the S&P left islands on the charts, the S&P backtracked and filled in the gap, but the Dow still has a gap area left from last weeks trade. As the short-term update pointed out, islands tend to occur more often than not around highs than lows. With sloping oscillators and a significant shift in price and time, the island is a major warning sign…. For now. We still have weeks of extremely critical timing to move through and things can continue to be volatile.
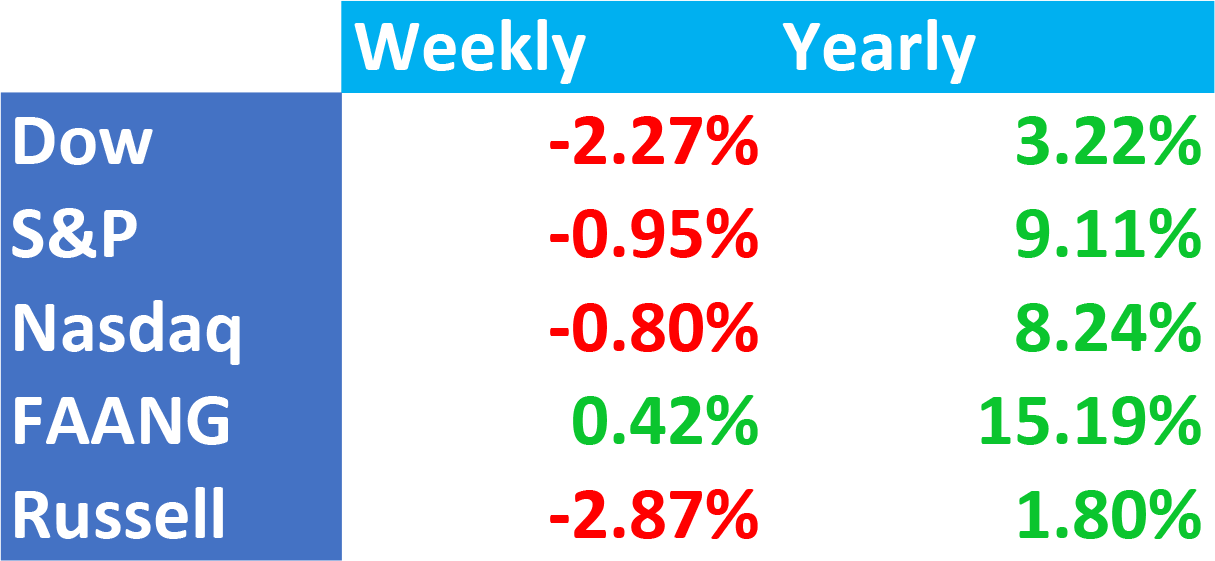
*To continue reading this week’s update, please visit Intraday Dynamics for more information.


