TECHNICAL ANALYSIS
The DJI is attempting a reversal to start the month with prices hanging near the intraday highs at 1PM EST after gapping down this morning.
Dow Jones Industrial Average Hourly
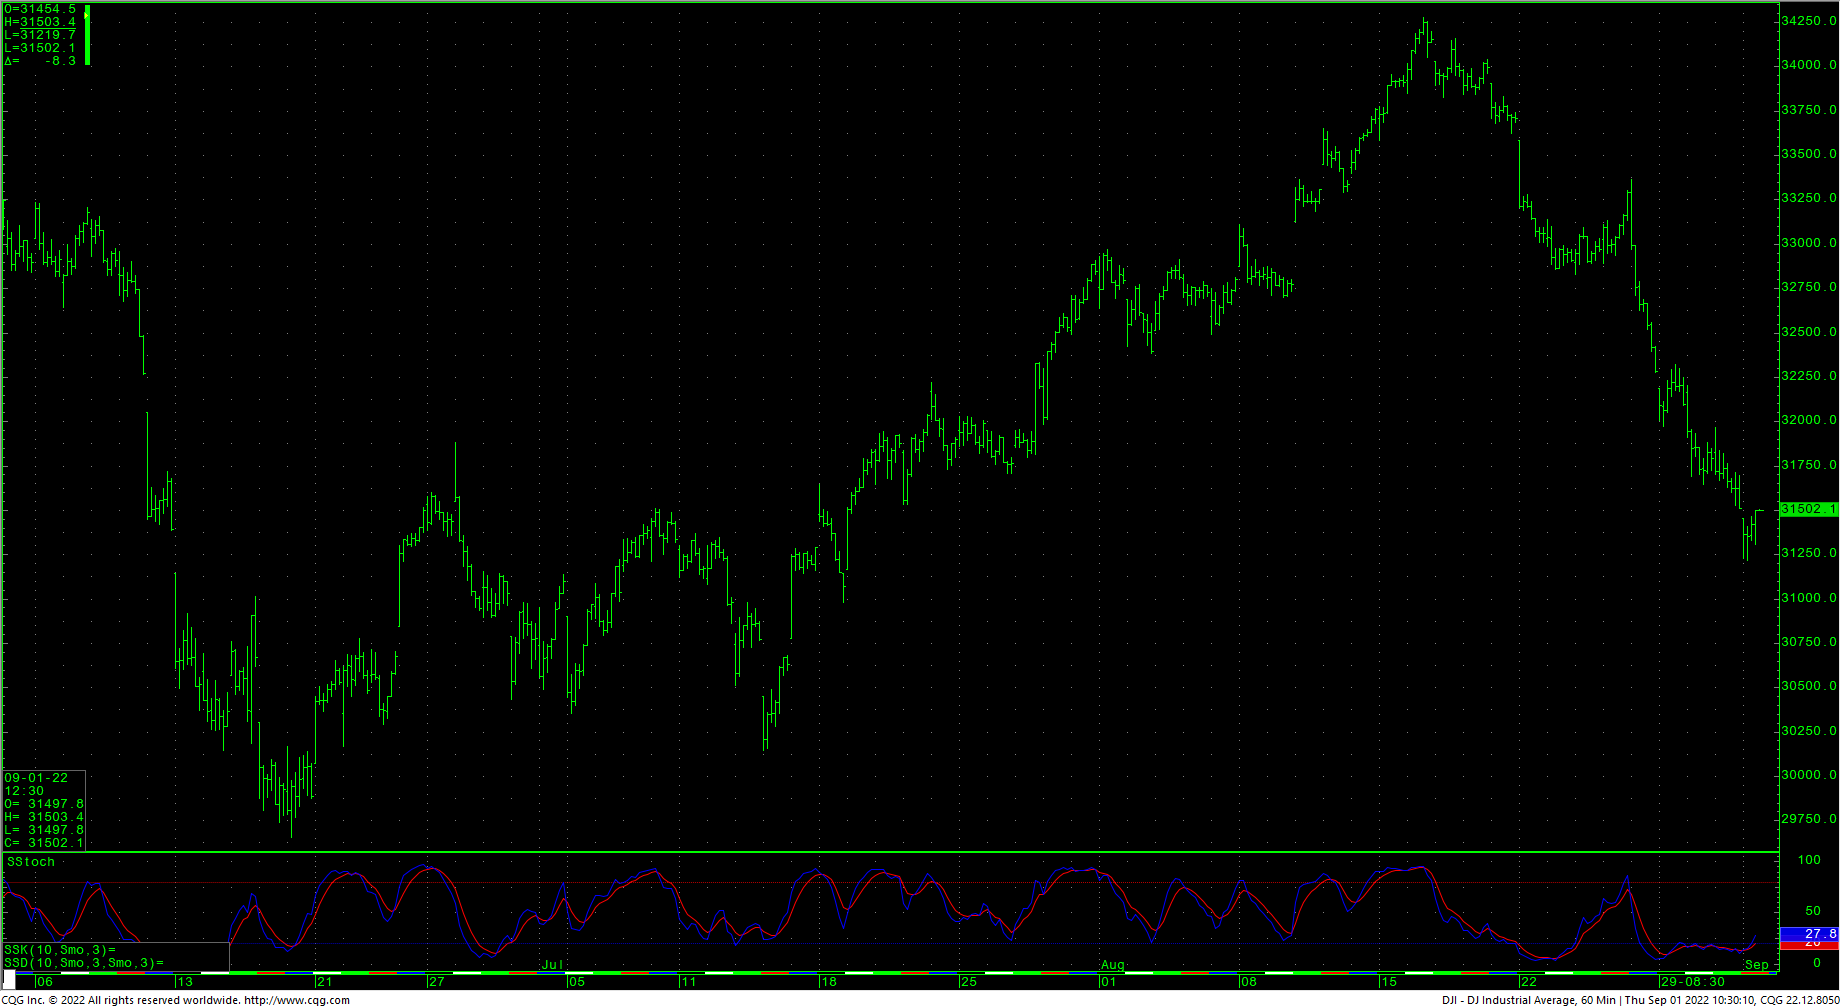
Market enthusiasm was extremely high after prices topped at just above a 62% retracement of the entire downmove in August, only to quickly see a retracement of over 70% of the rally in just a little over two weeks. So, the big picture question remains, are the June lows a new bottom for the beginning of a campaign that will take stock indices to new highs, or are we in the throes of a long-term, secular bear market? The latter scenario is one that very few people alive today have ever lived through. With the exception of the 2008/2009 bear market, there have been no actual secular bear moves in stocks for fifty years.
Right now, technically, if you believe that the Dow is in a bullish retracement, prices need to hold the gap area left on the daily chart at 30775/30680. Major long-term support is now 30810 to 30680 and this would be the area to enter the market long with stops under the June lows.
Short-term, rallies back over 32000 are bullish and would indicate more rallies and buying dips.
Vica Partners Technical Team