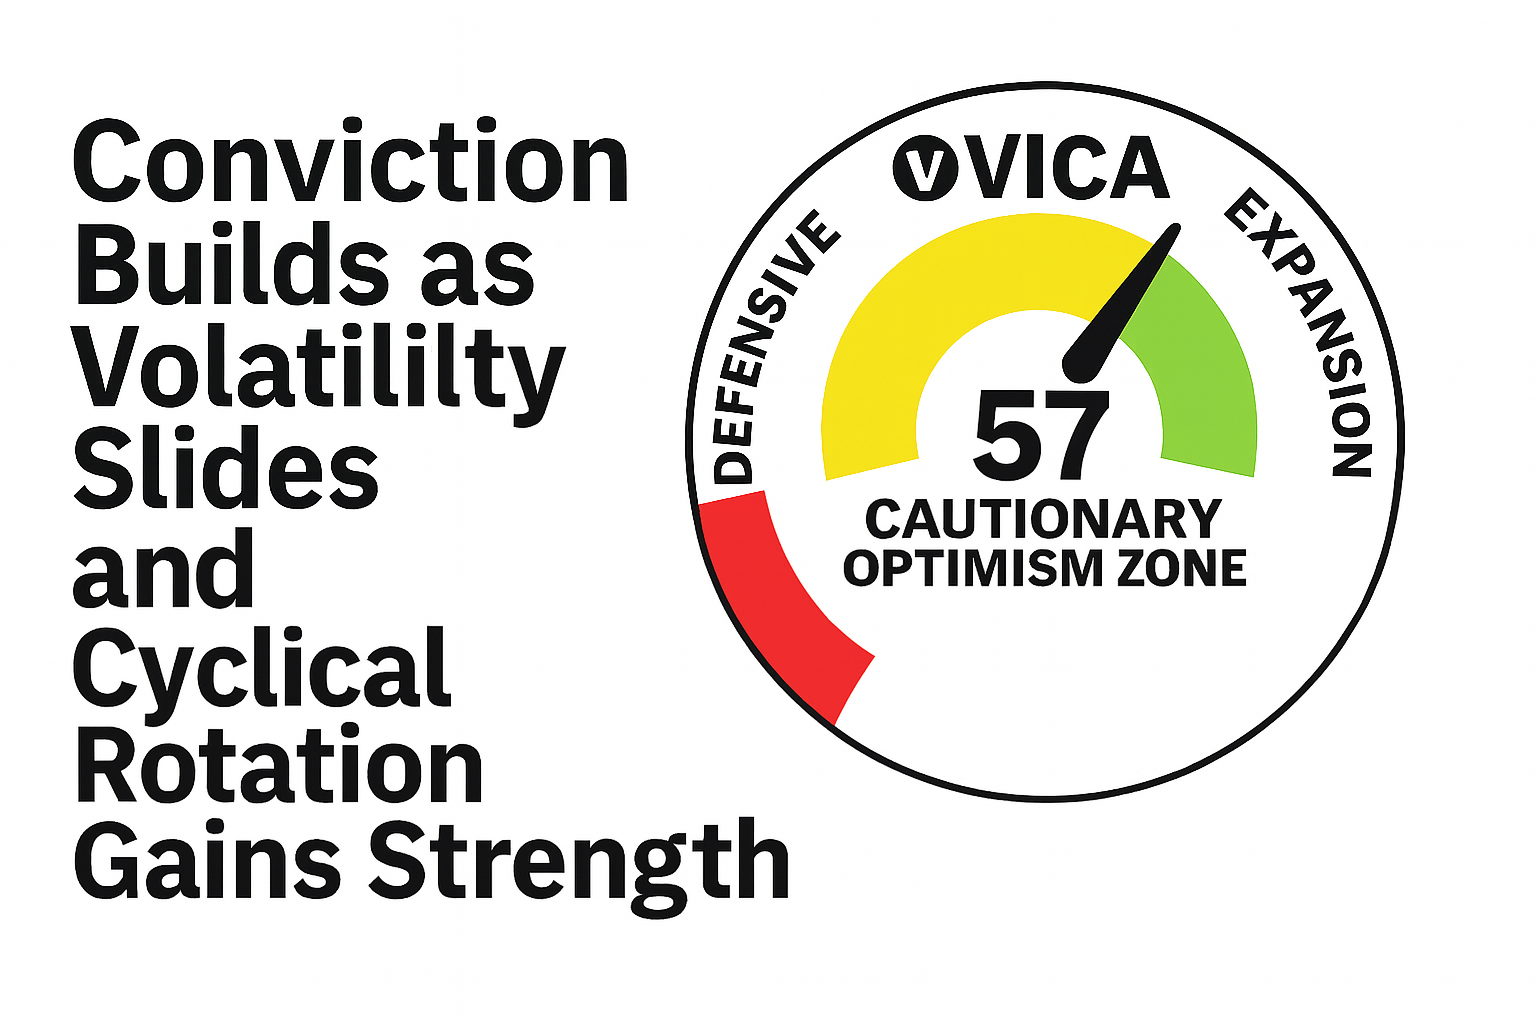
The DJIA staged a large outside day reversal down to close near the lows of the day and a new low close for the current decline. The daily chart has reached deeply oversold conditions and prices still need to hold the last gasp area of support at 30810-30680. This area represents a 75-80% pullback from the initial rally off the June lows and is a must hold for any view that the June lows are an exhaustion low for the bear market that began in the early part of 2022.
Dow Jones Industrial Average – Hourly
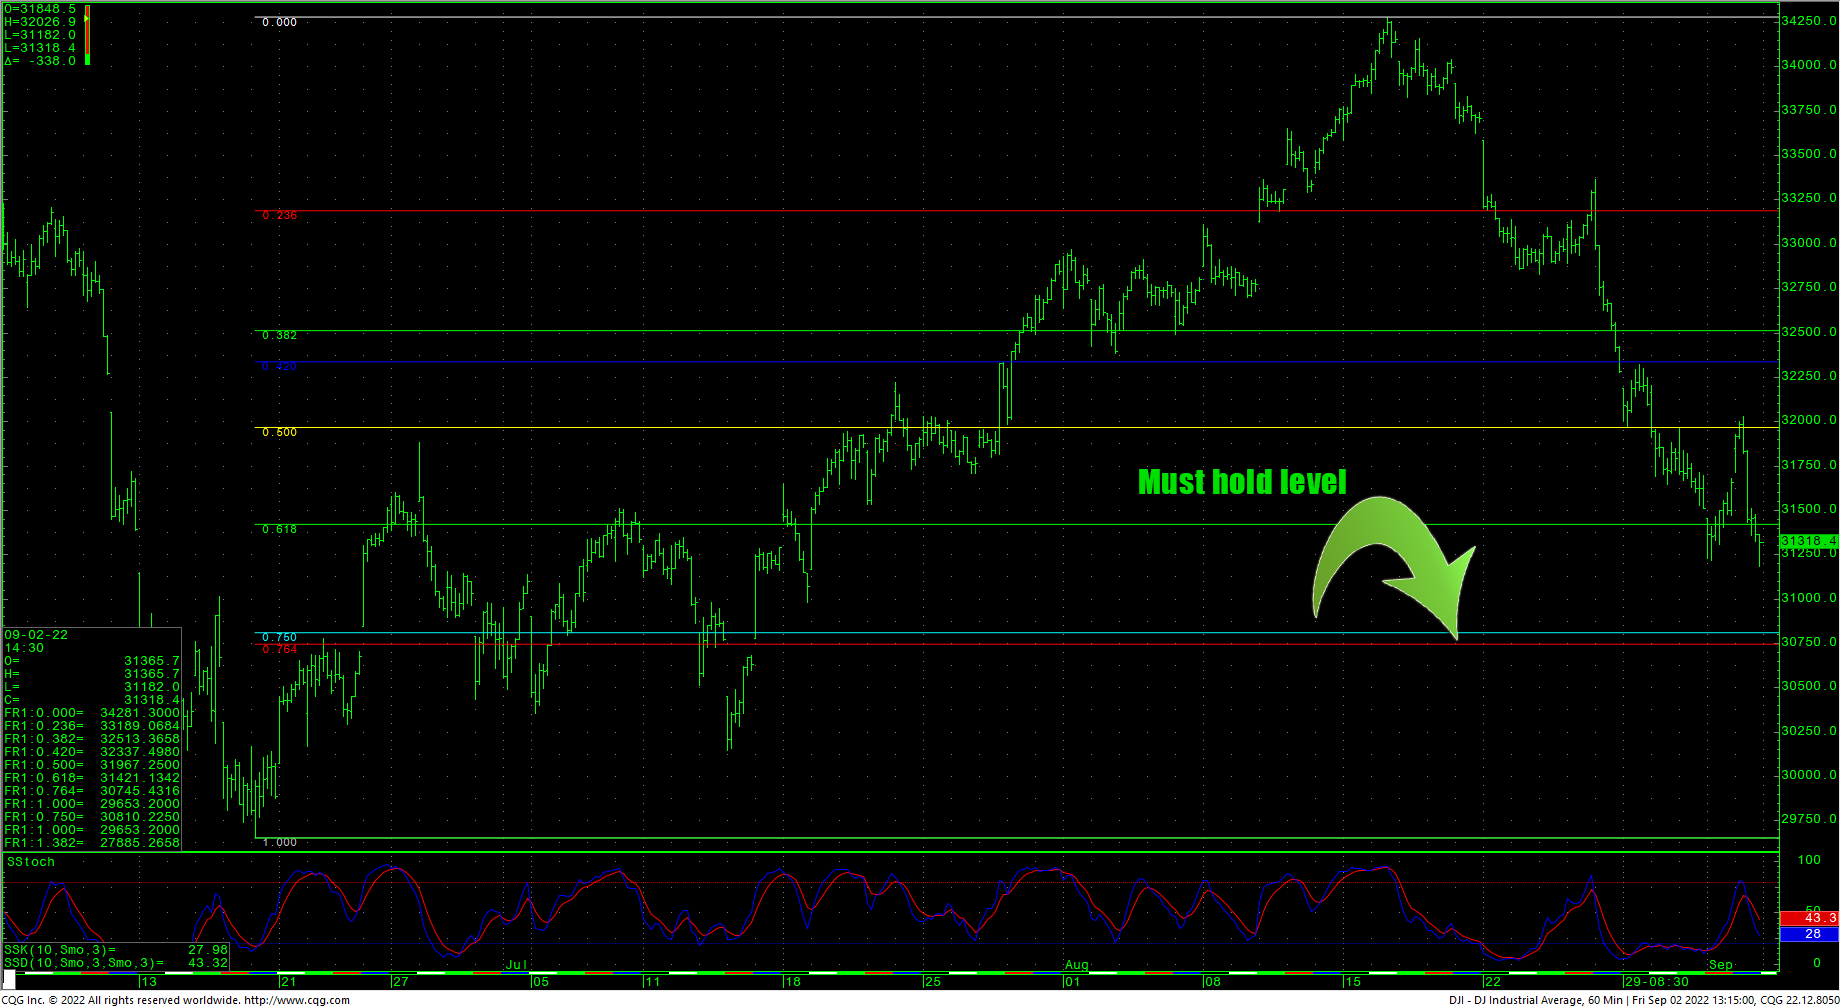 On the hourly chart, the 31116 level is key as it represents a 1.618% move from the initial break off the 34281.3 high set August 16th. The first leg down was 1389.8 points to the 32828.5 swing. Multiply that by 1.618% and subtract from the swing high of 33364.7 of August 26th and that yields a target of 31116 on the hourly chart.
Short-term resistance remains at the 32000 level with key hourly resistance at 32731 and pivotal at 33097-33105.
Early trade next week should offer some strong clues to the intermediate-term direction for the DJIA and offer clues as to whether or not the June lows will hold, or if we are looking at new lows and a deeper (secular) bear market for stocks.
Vica Partners Technical Team