
The US Dollar is now trading at a twenty year high as the monthly reaches some overbought conditions. The market has reached the highest levels since June of 2002 and has tested a long-term resistance level at 11019.
US Dollar Monthly
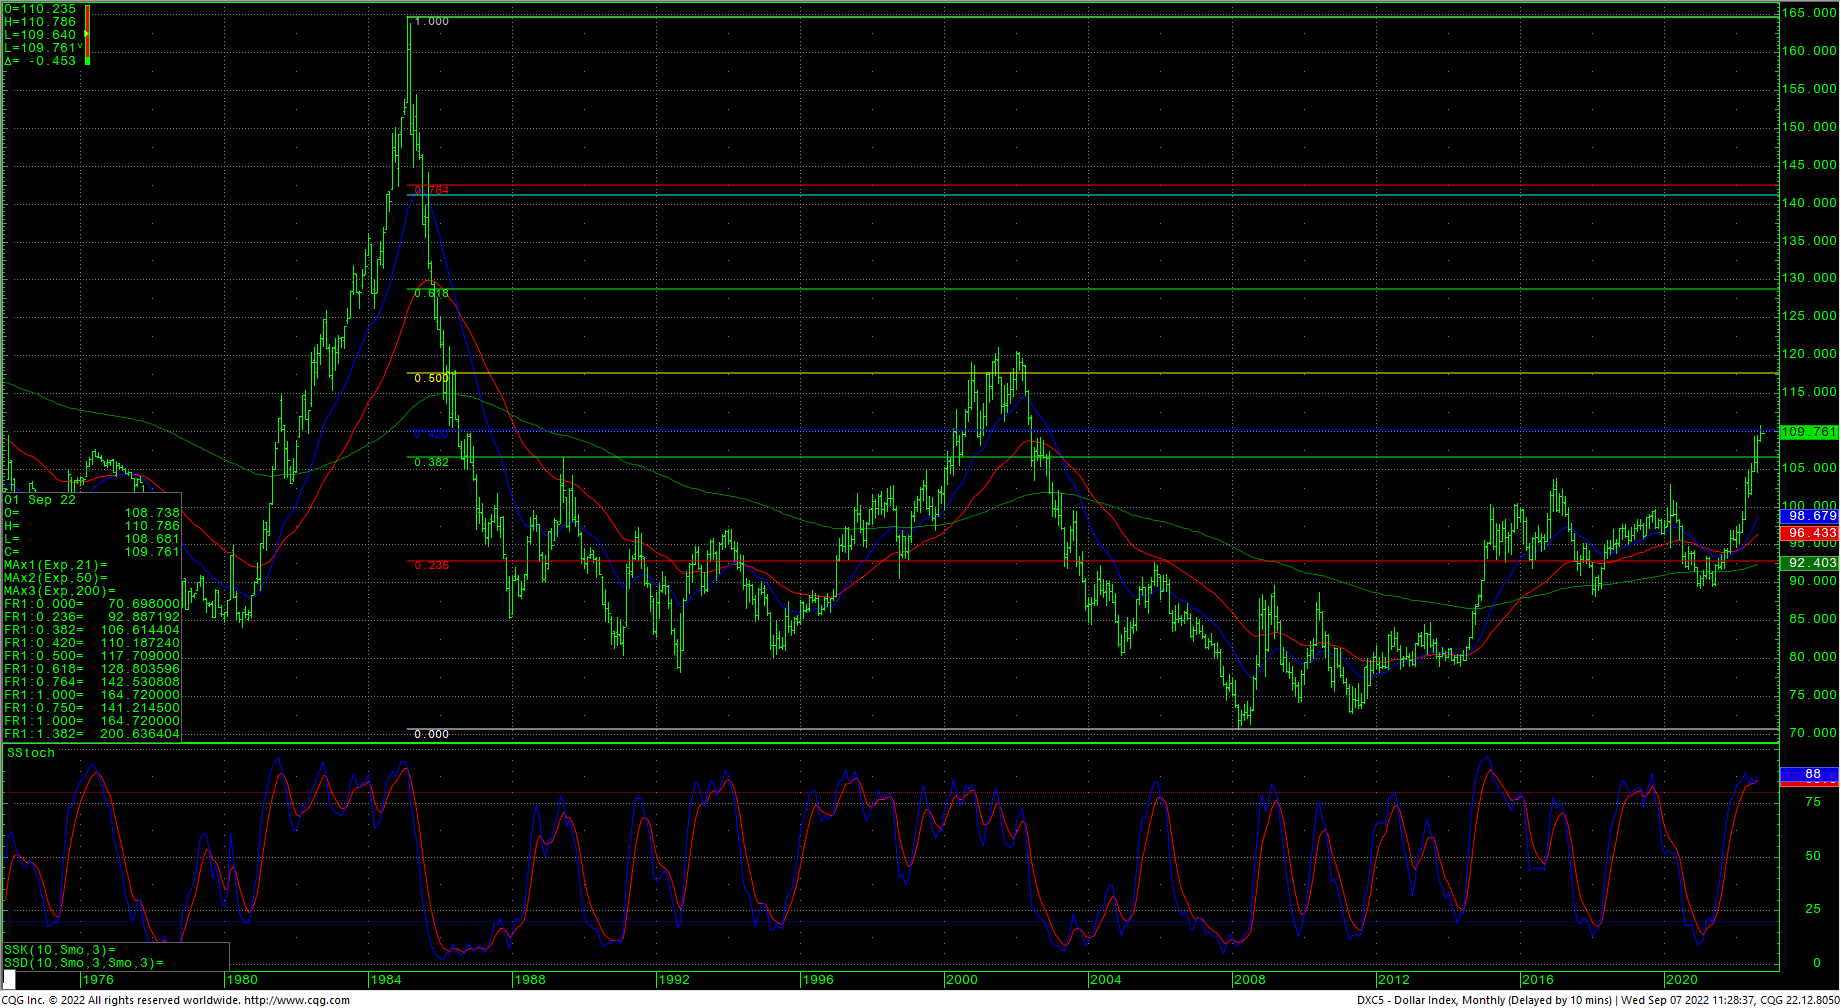
The breakout to new multi-year highs this year has generated targets on the monthly at 11676/11939. A 50% retracement of the entire move from the highs in 1985 to the lows in 2008 is 11770. The high in 2001 was 12102, so massive long-term resistance for the spot cash is 11676/12102.
In the extreme short-term, support is 10843, 10771, and 10698/10680. Closes under 10680 would suggest a short-term high is in, and a test of 10617 with a chance to test the 10463 lows.
The spike into new highs this week has setup a potential bearish divergence on the daily chart with the slow stochastics trailing prices in this drive as they remain quite overbought. Hourly activity is showing the most bearish short-term trade since August 22 when the market started its last sideways trade on the daily.
To summarize. The daily is overbought with a preliminary bearish divergence and the hourly is showing vulnerability which likely will result is some sideways trade over the next week to two weeks. Longer-term, the monthly still has some unmet targets against the 11676/11939 with major resistance at the 11770 level as that represents a 50% retracement of the entire 23-year bear market.


