
TECHNICAL ANALYSIS
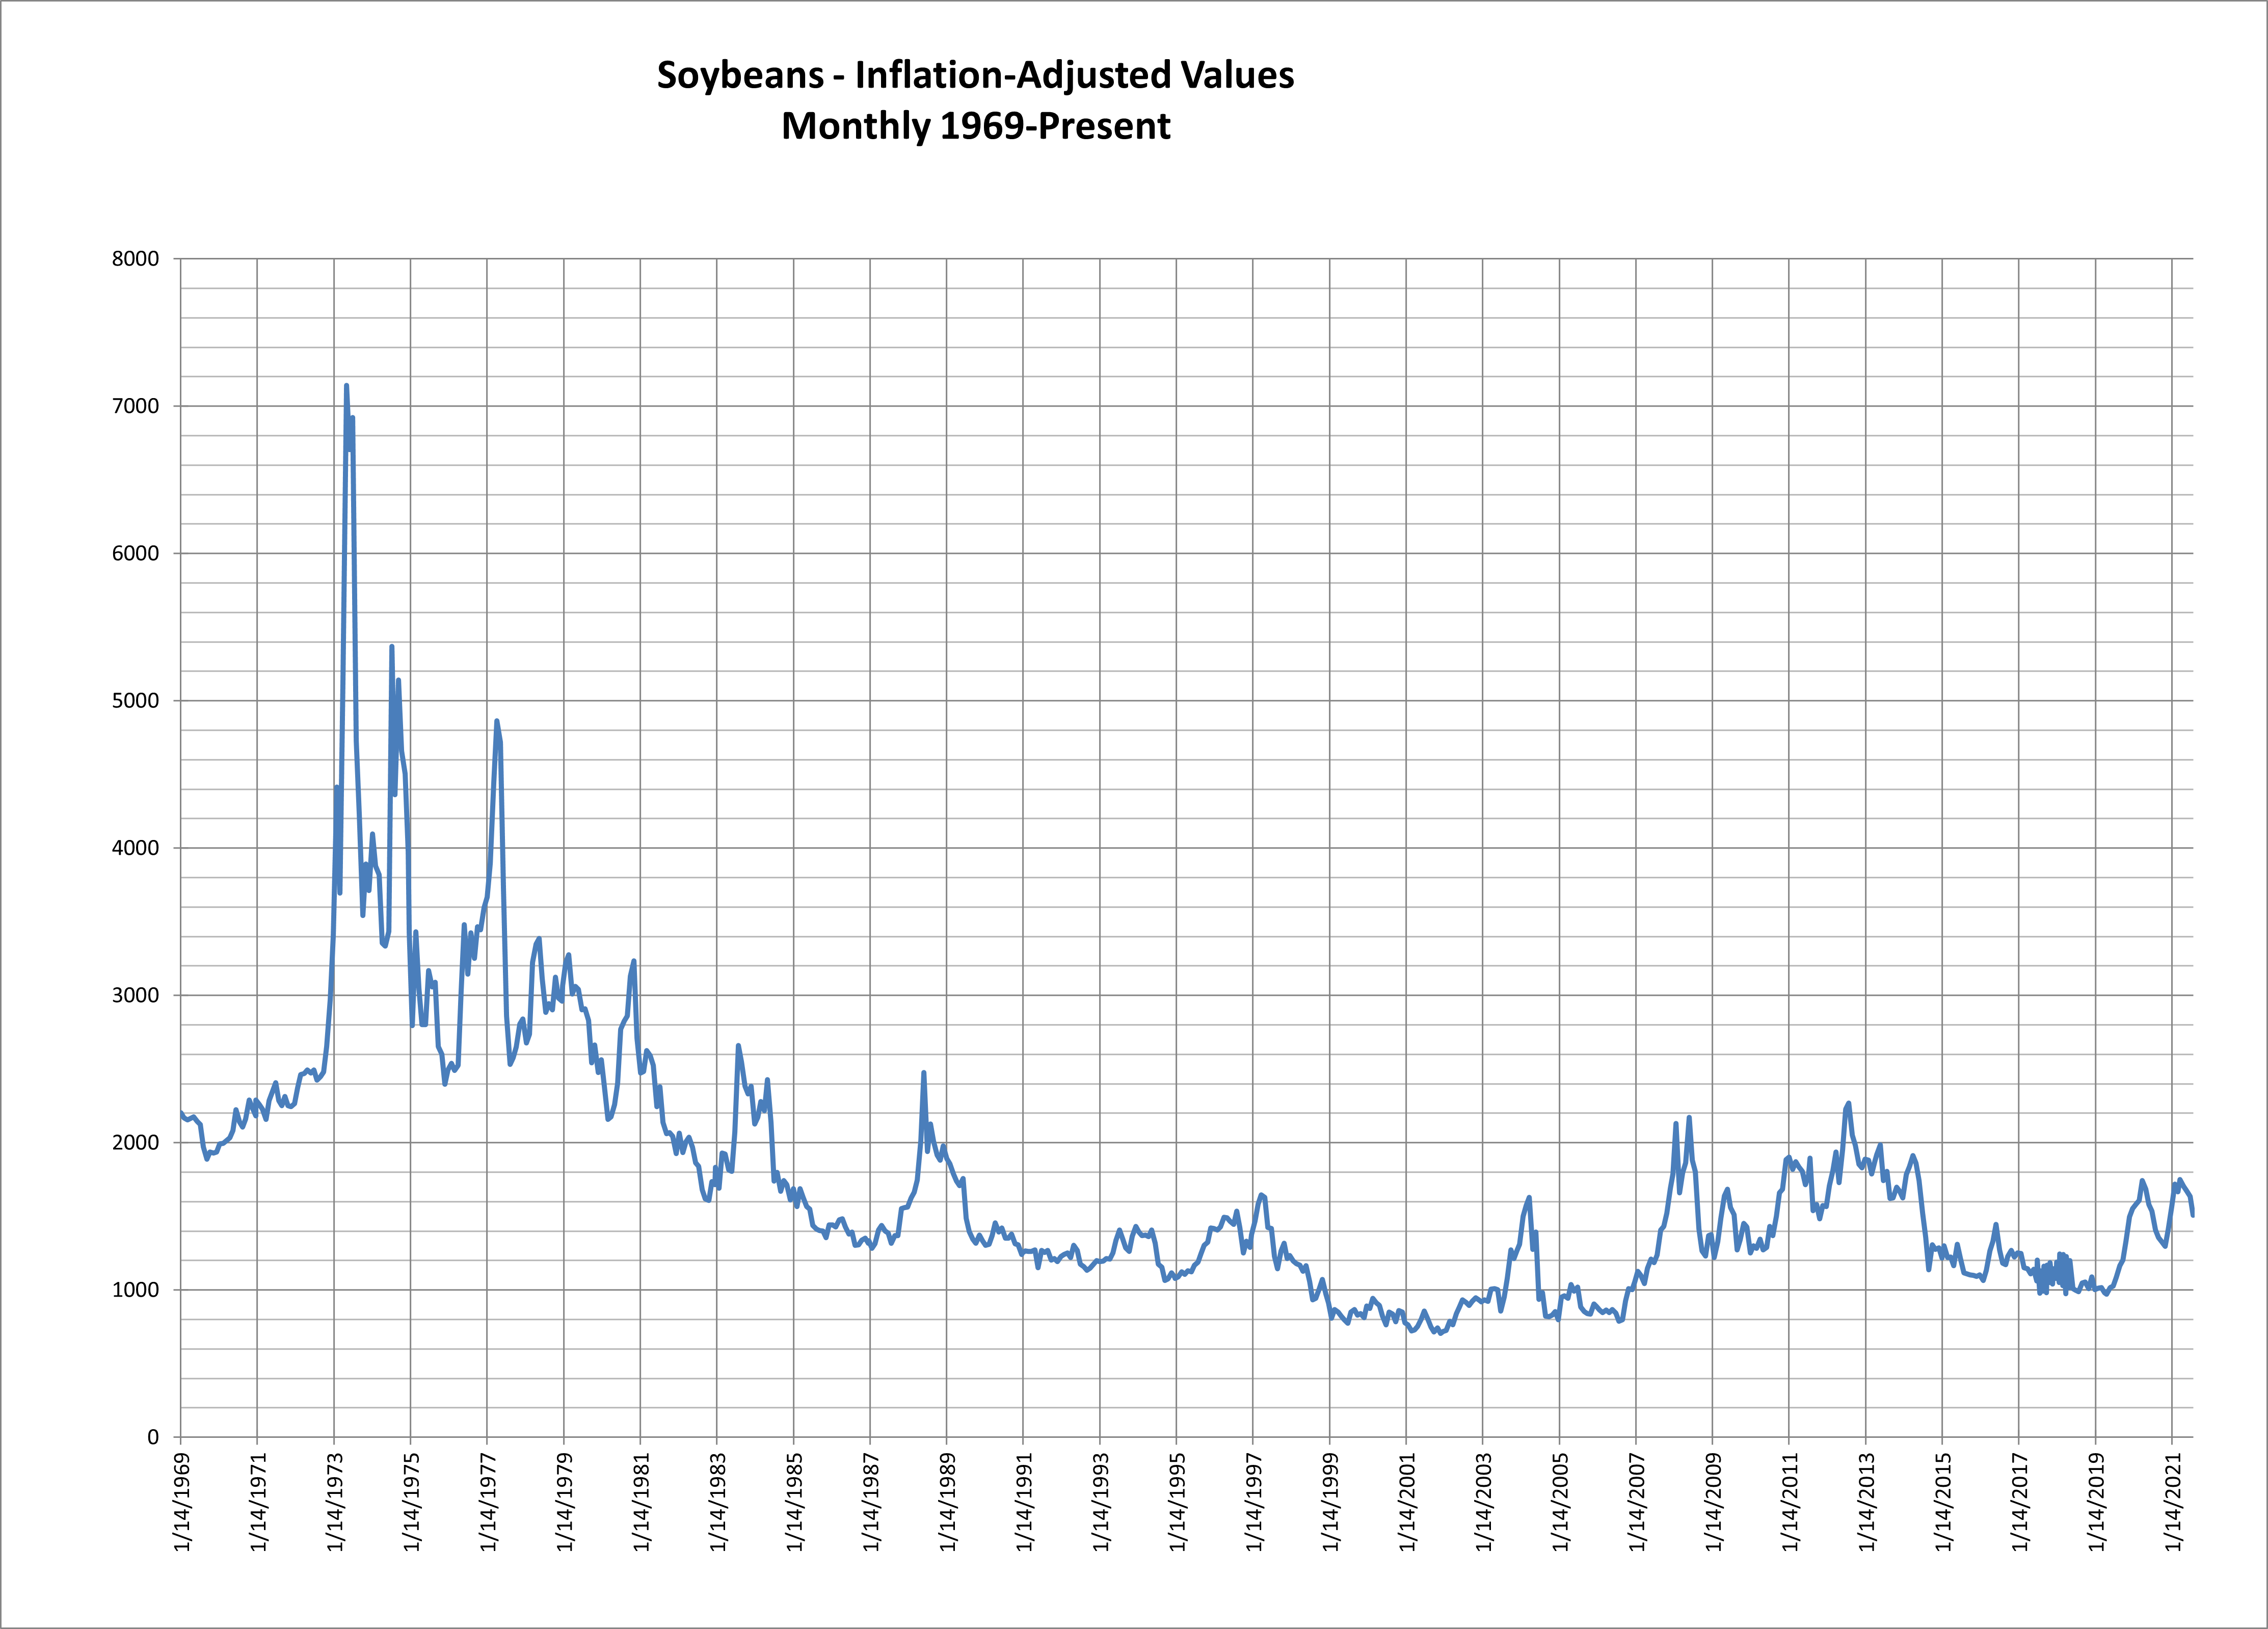
New crop November soybeans are trading to the lowest level in a month on the daily chart as that chart continues to build a large flagging pattern to the right of the highs set in June at 1584.75. The daily oscillators and volume and open interest are all solidly neutral for the market as it maps out this trading range. September soybeans are set to leave the board at roughly a $1 premium to the new crop, which will leave another funky gap on the spot daily chart. Spot prices topped in June at 1784 which was just shy of the all-time record high print of 1794.75 set in September of 2012. It’s important to remember that, in inflation-adjusted terms, the nearby price for soybeans (while dramatic in real-world pricing) is still in the bottom percentile of “costs” over the past fifty years.
Nearby Soybeans Monthly (Inflation-adjusted)
Near-term, November soybeans (SX22) have critical support against the 1365/1360.75 level. There remains a gap on the daily chart that runs from 1360.75 to 1349.25. Should the 1349 level fail, then prices can be expected to retest intermediate-term support against the 1300/1288.5 area (the swing low set in July). There is a major intermediate-term range that runs from basically 1300 through the 1271.5 level. So, if SX22 took out the July lows, it would not necessarily lead to a major flush in prices and caution should be given to expecting a meltdown with a new multi-month low. Should 1271.5 fail, then it opens counts to 1212 with long-term prospects to 1125/1120.
SX22 November Soybeans Daily
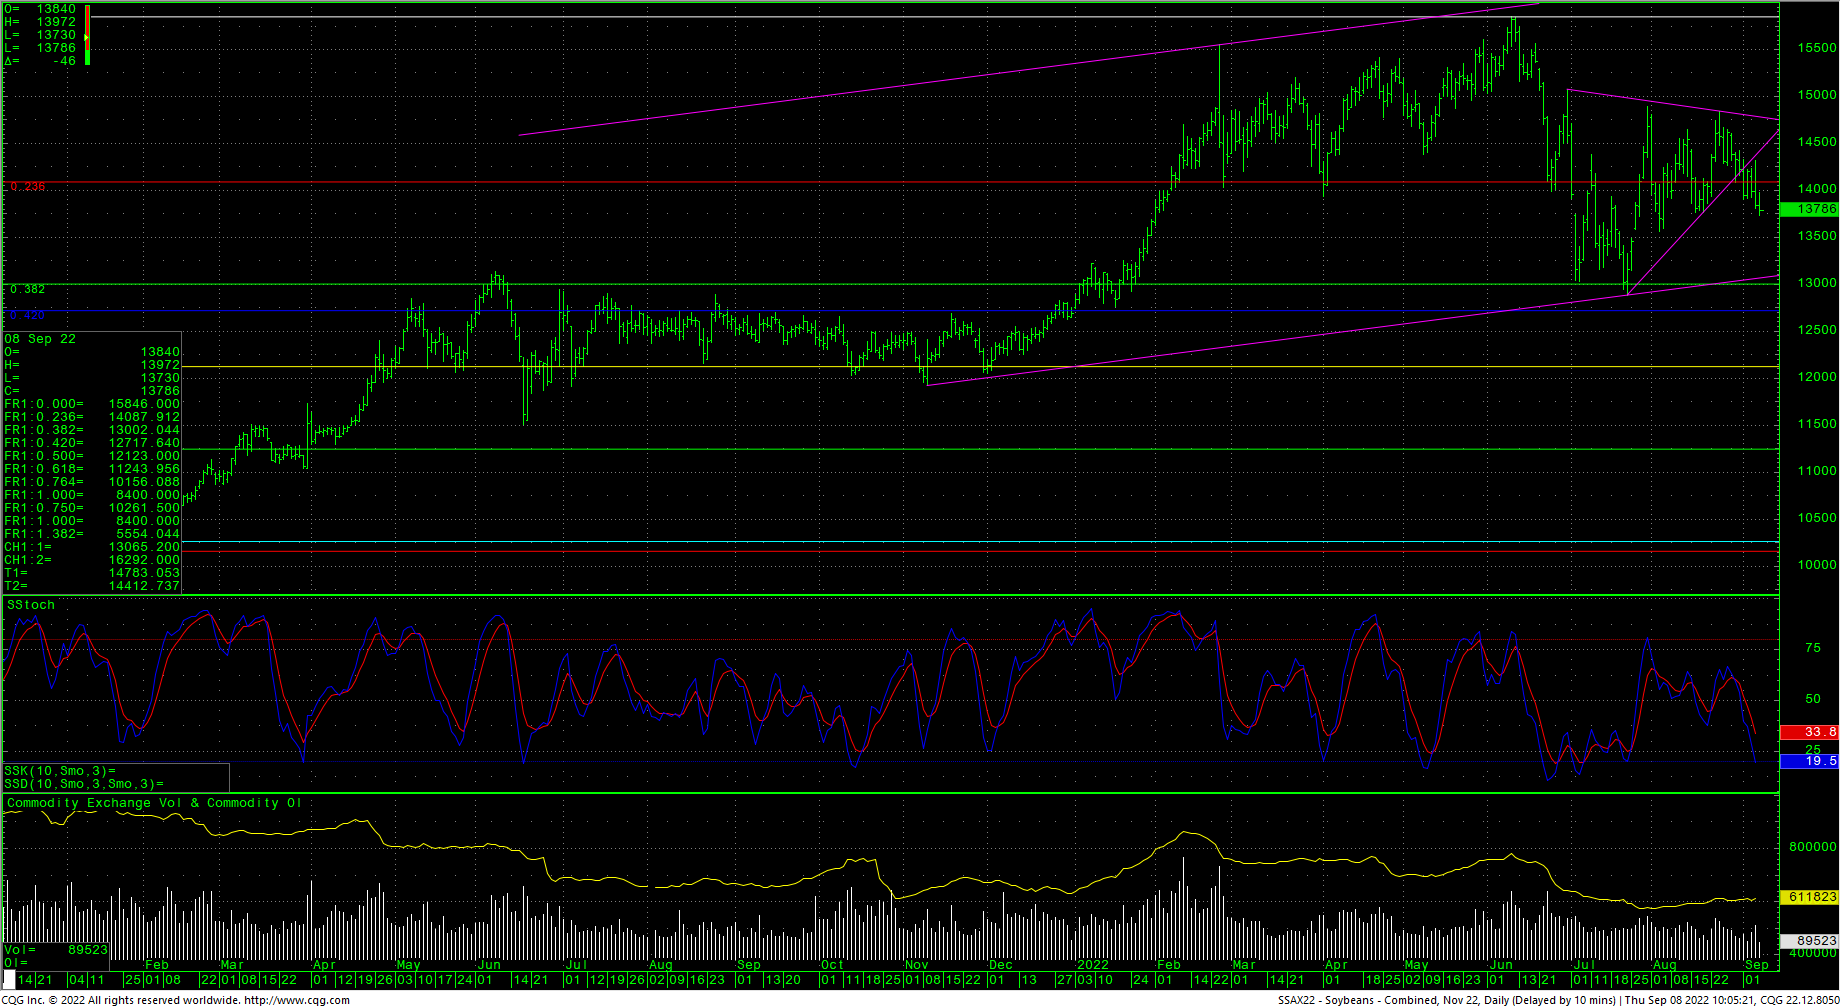
Short-term, resistance is at 1399/1400 and rallies back above 1400 should take SX22 to 1415 with potential to 1429. Pivotal short-term resistance is 1442/1445 and closes over that level will open counts to 1460 and 1484.5/1489 (the current contract high for SX22). As of today at 12:15 CST, the SX22 hourly chart is showing a small bullish divergence on the slow stochastics with prices testing that mid-August intraday low at 1376. Today’s low thus far is 1373. With this pattern, there may be a shift back to the 1394/1396 area with extreme short-term pivot area at the psychological area of 1400.
It is important to note that December Soybean Meal remains much stronger than the November Soybeans and December Soybean Oil. The current Meal/Oil spread mirrors the daily soybean chart with a flagging pattern and extremely neutral technical indicators. We will update the Soy complex again near the end of the month.
Charts courtesy of CQG, Inc.


