
TECHNICAL ANALYSIS
We want to begin this look with a reminder from the last update that this remains a critical timing area for stocks.
The DJIA gapped lower Friday and prices cracked intermediate-term support, setting new trading and closing lows for the bear market move that started in early 2022. The age-old adage that ‘As goes January, so goes the year’ has held with the market trading to the lowest prices since November of 2020. The DJIA ended the week down another 4%, marking two consecutive weeks of 4%+ declines.
DJIA Weekly
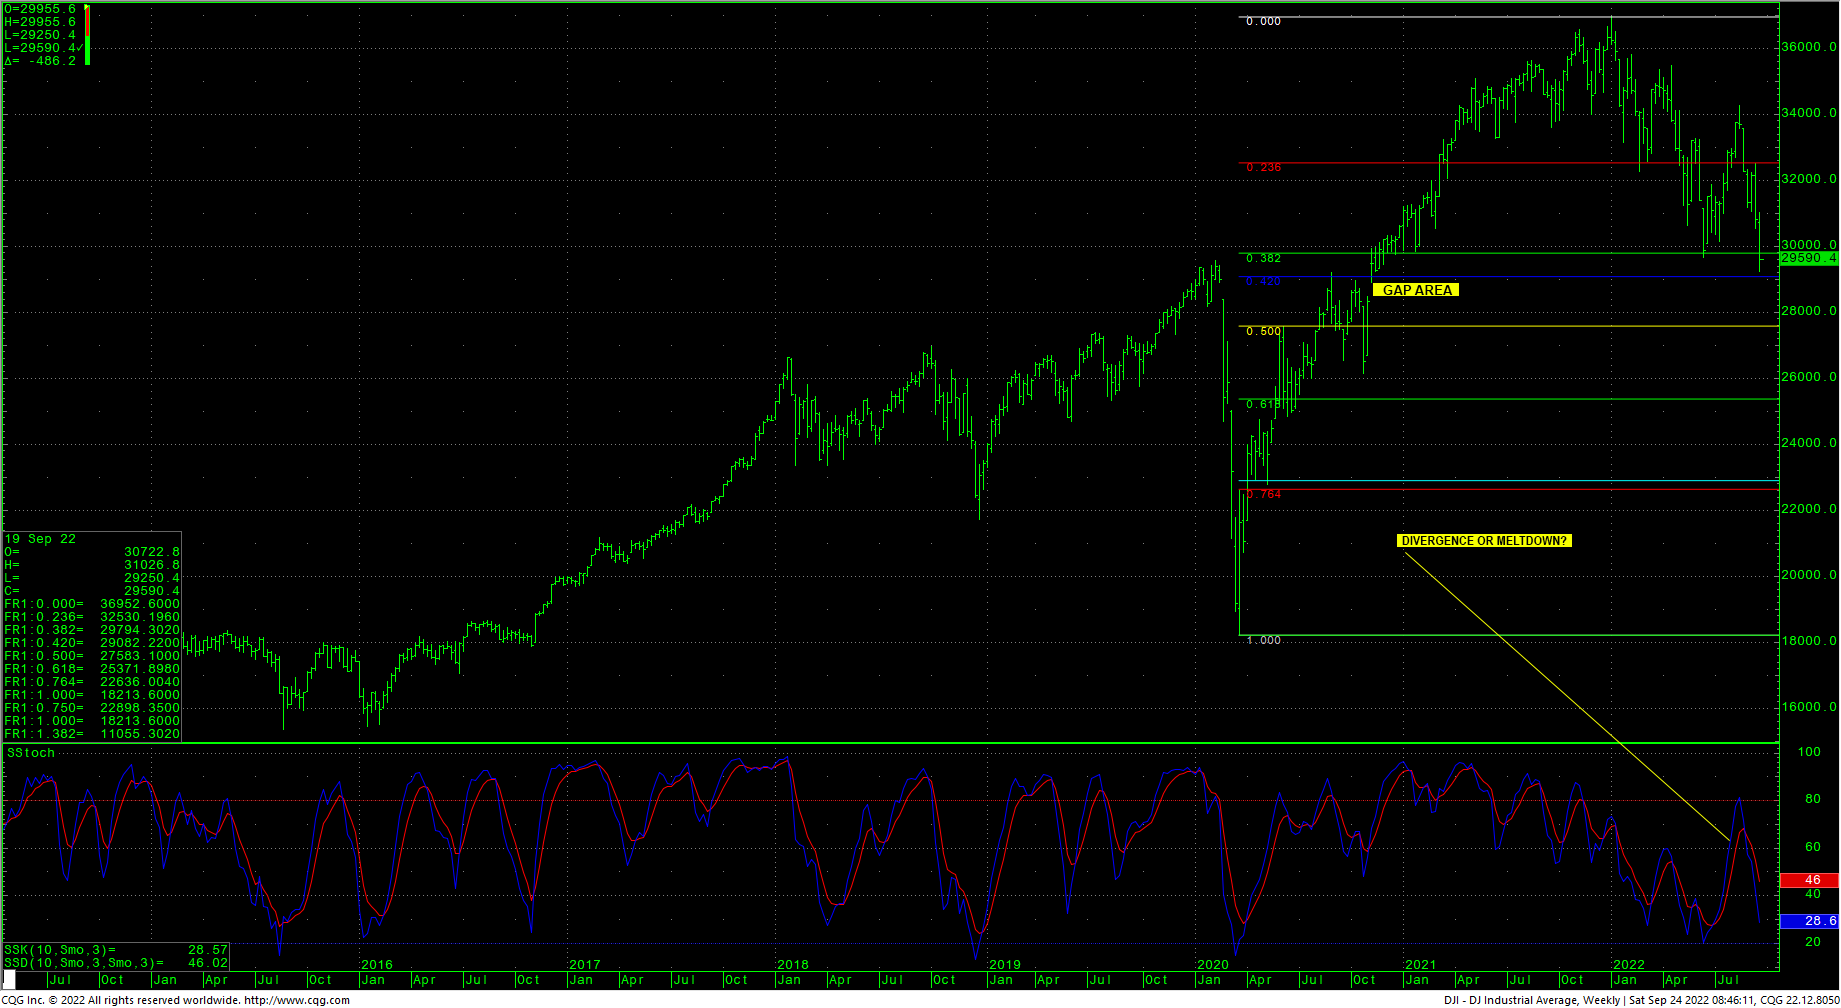
From a technical standpoint, the DJIA cleared significant intermediate-term support against the 30810/30680 level and settled under the psychological level of 30K for the lowest weekly close since 11/23/2020. The weekly close under 29794 is a sign of weakness and now the DJIA is looking at the gap area on the weekly that runs from 28902 to 28495. The stochastics are hooking lower and, granted, the chart looks pretty bearish with the weekly action. Dow :Theory” is mixed with the Transportation average crashing to new lows but the Utility average remains in the upper end of its recent wide trading range.
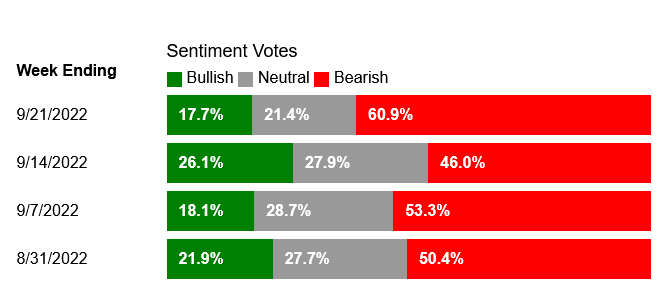
AAII Investor Sentiment Survey
S&P Mini Commitment of Traders
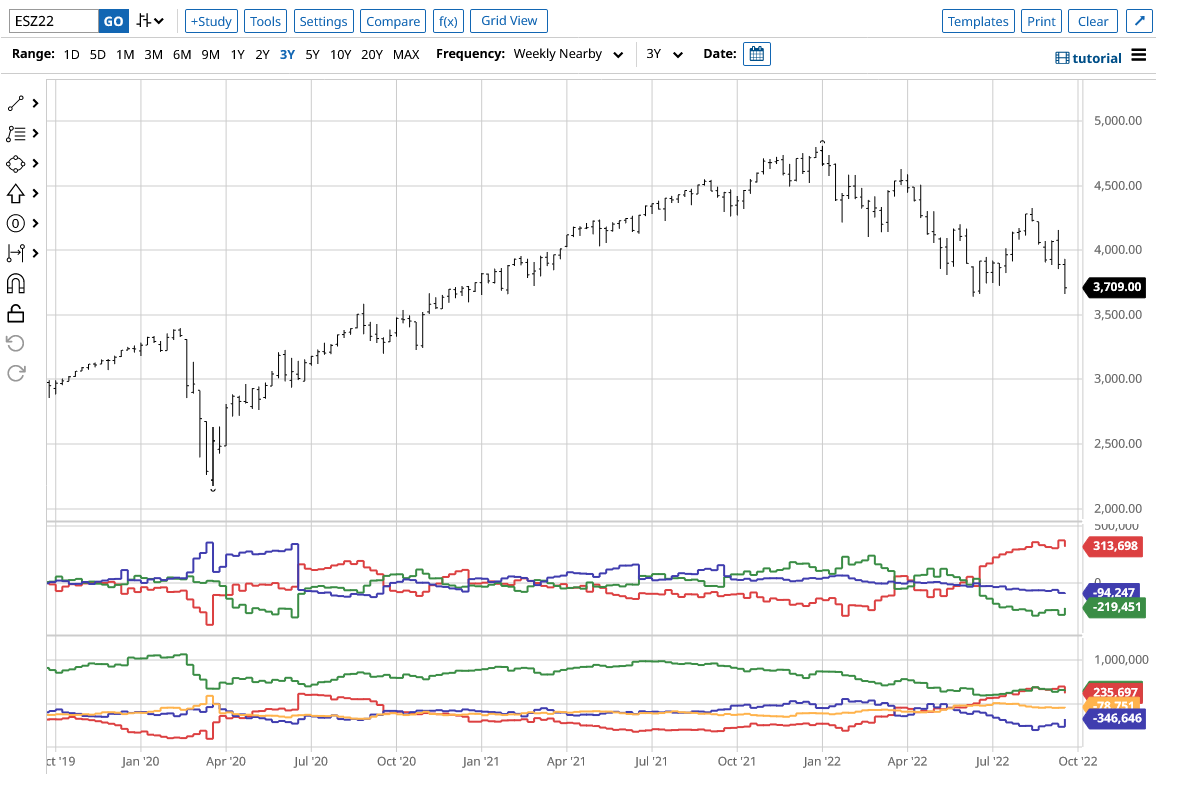
Near-term indicators, which might support the critical timing point here, are the facts that the S&P500 average did not break the June lows (trading) and managed a close above the current 2022 weekly low close of 3690.75. The other secondary markets also remain above the current June lows. The Nasdaq, the Russell and the FAANG all remain above the June lows, however the FAANG did set a new weekly close last week. Other, ‘potential,’ divergences with the new 2022 lows in the DJIA are the fact that sentiment is quite bearish and the latest Commitment of Traders seems to show retail investors fleeing and commercials are shorting.
That said, there is no denying the fact that the price action alone is bearish and there are now open targets on the weekly chart at 26982. Support, short-term, is at 29250 and 29082. A breakdown under 29082 sets up a test of the weekly gap area at 28902 and 28495. Long-term support is 27583 and closes under that area will open counts to the intermediate-term target area at 26982.
Short-term resistance is 29984 to 30018. Prices need to clear 30018/30020 to setup a test of 30448 with swing resistance at 30302. Pivotal hourly resistance runs from 30448 to 30494. Closes over 30494 would suggest a short-term low and set up a test of 30616 with counts toward key hourly resistance 30877/30890. Critical resistance is now at 31172/31270 and closes over that area would be a bullish signal for the DJIA.
DJIA charts courtesy of CQG, Inc.