
TECHNICAL ANALYSIS
November soybeans (SX22) took a dive late last week to carry the contract to the lowest levels since early August. As the now lead contract on the weekly continuation, SX22 has taken spot prices to the lowest levels since mid-January of this year. The sharp breakdown on the weekly spot chart is opening some bonafide counts for spot prices to much lower levels. A case can be built now suggesting that spot beans will trade under $11 based on the breakdown of the weekly and monthly spot continuation charts. The recent weakness in Soybean Meal has precipitated the move in Soybeans and spot meal taking out the May lows at 39720* would likely confirm long-term highs in the complex…which could be read as a signal that the entire soy complex will see substantially lower prices.
Spot Soybeans Weekly
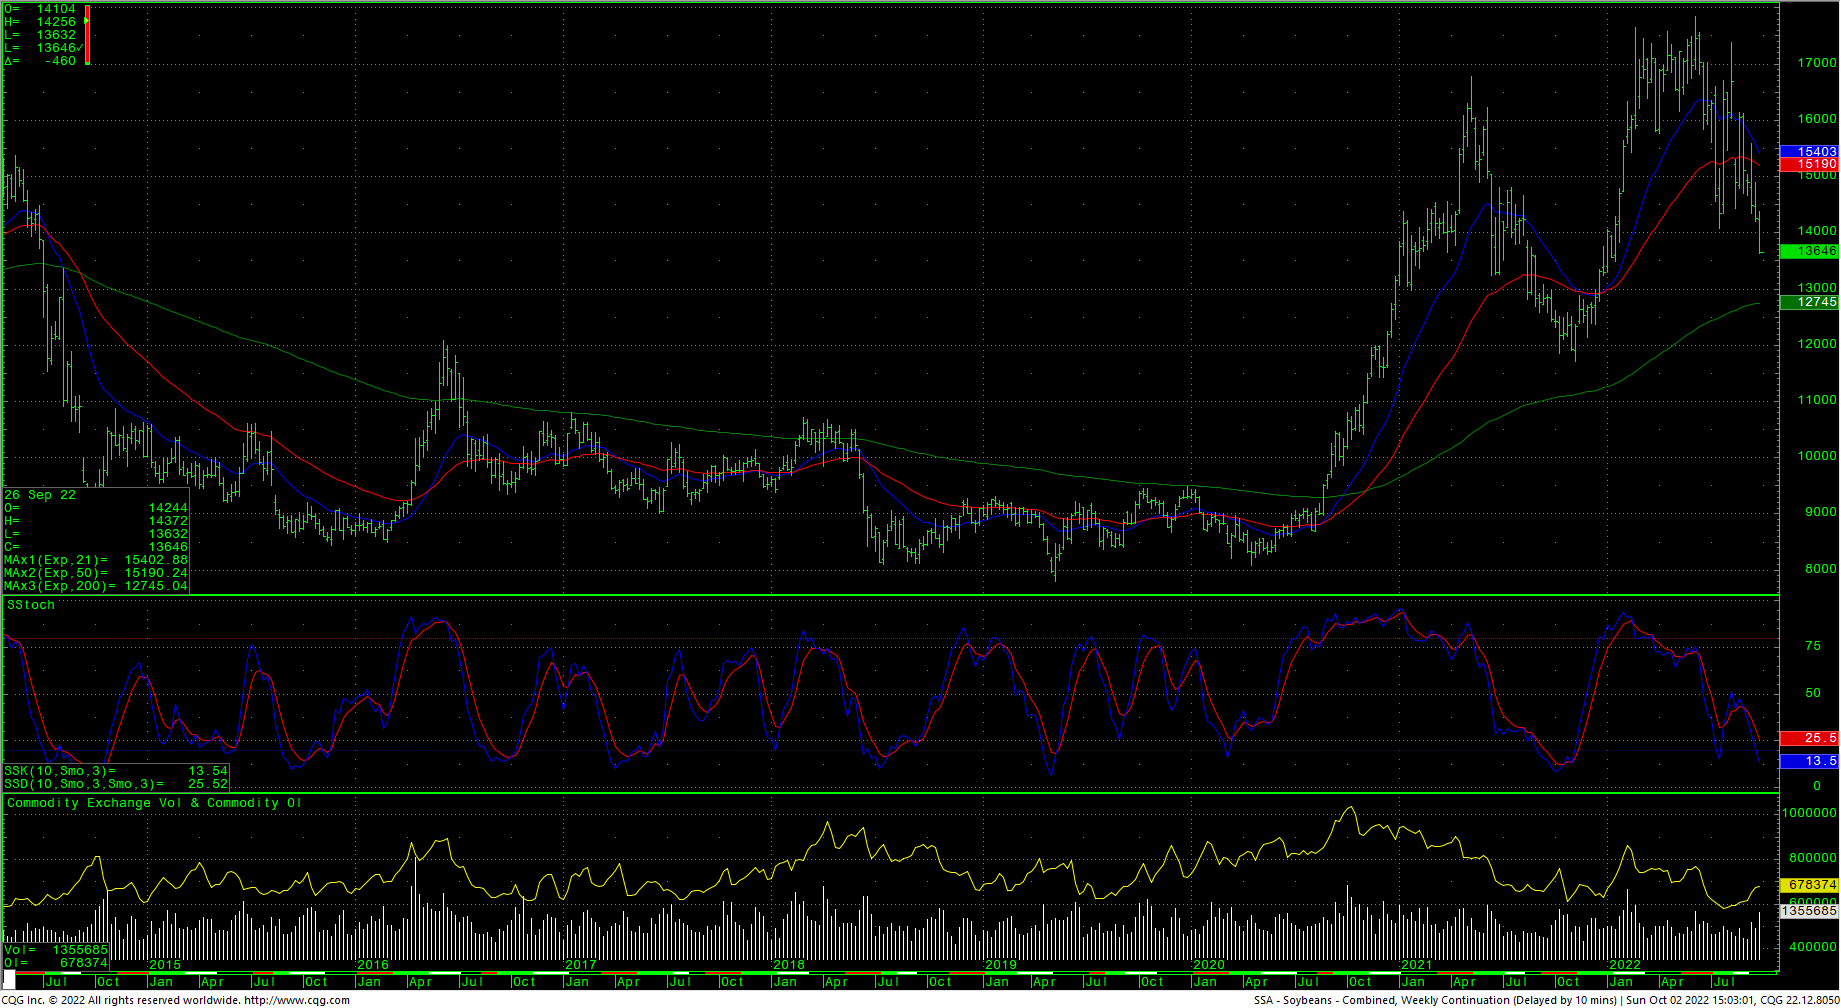
The close last week is bearish and minimally suggests that SX22 can trade to the 1325 area with support at 1349. The 1282 level is now a short-term target for spot futures and represents key weekly support. Closes under 1282 will open counts to 1214 with long-term critical support now at 1171/1160. There are monthly targets now in the 1080/1075 level on the spot charts.
The short-term charts are not flashing any divergences or strong signals right now. Resistance is at 1380.5 and 1391.5. Rallies back over 1391.5 should test 1400 and 1408/1409 through 1418. Closes back over 1418 in SX22 are near-term friendly and set up a test of 1436 while opening counts into the 1453/1455 area. Daily closes over 1455 are bullish and suggest a key short-term bottom while opening counts to 1490 to 1508.
CRB Index
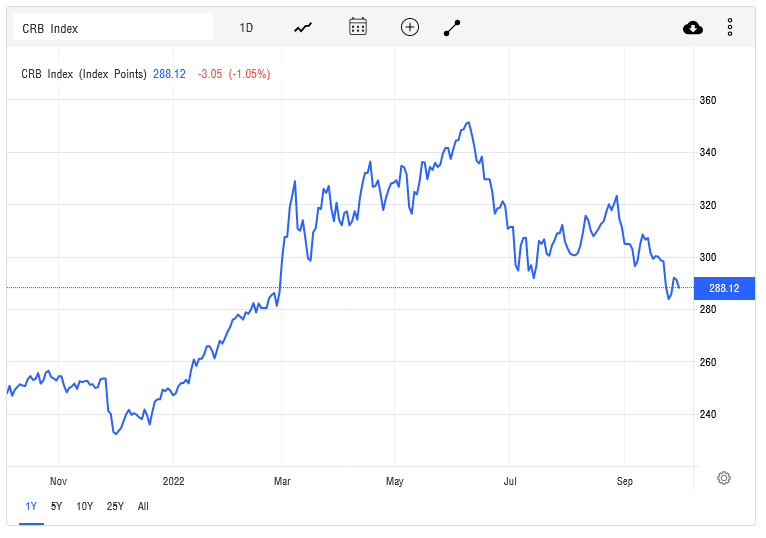
*Items of note, DEC meal (SMZ22) has spot weekly support of 39720…however, the daily SMZ22 chart has corresponding lows at 39550. Thus, SMZ22 would need to clear 39550 with closes to likely accelerate bearish trends in the overall soy complex. Another indicator is the current breakdown in the CRB Index under the July 2022 lows. Should the CRB hold this ‘breakout’ on the chart, it is an indicator that general commodity prices are heading lower near-term.
Charts courtesy of CQG, Inc.


