TECHNICAL ANALYSIS
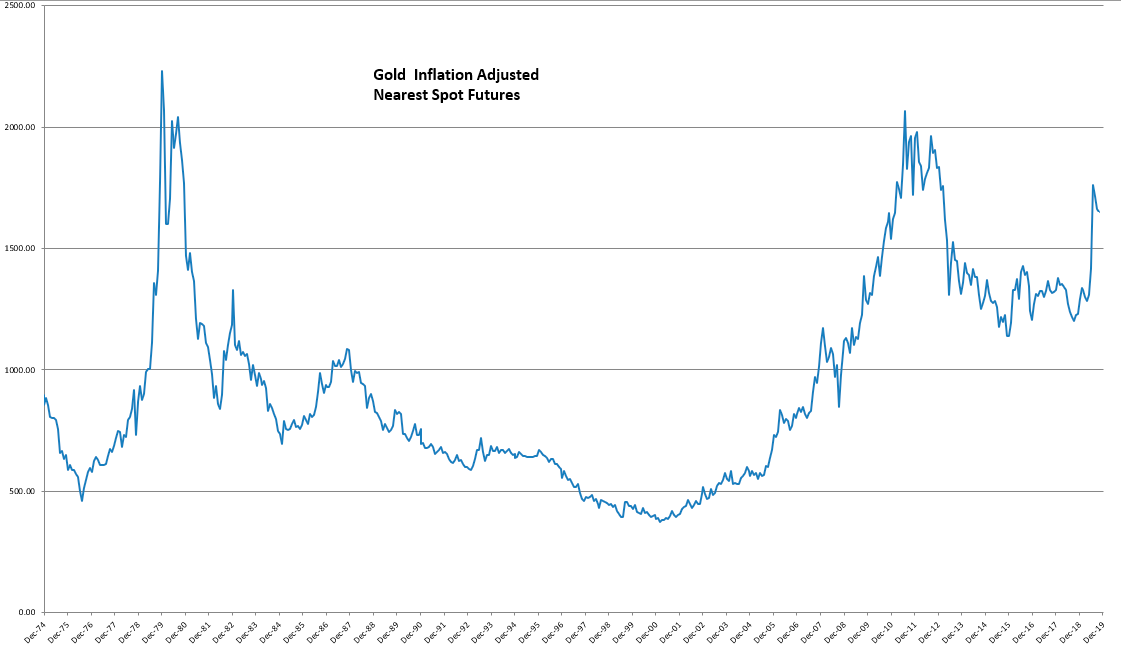
Gold futures collapsed in September, hitting the lowest levels since April of 2020…breaching months of lows that stood in the 1675 level. Since breaking that critical support, futures have had one sharp bullish reaction to 1725 and then drifted once again to the lower half of the recent trading range. The market is languishing on the daily chart with nearby futures sitting right around the 1650 area and testing hourly support. The hourly oscillators are neutral right now. The monthly is slightly oversold after failing miserably on the new record highs set in March at 2078.8. Volume and open-interest have continued to decline with prices while the commercials have built up substantial short positions. The weekly gold futures is flashing a preliminary bullish divergence with the most recent declines to new lows. As mentioned in previous updates, the price of inflation-adjust gold remains far below the record highs.
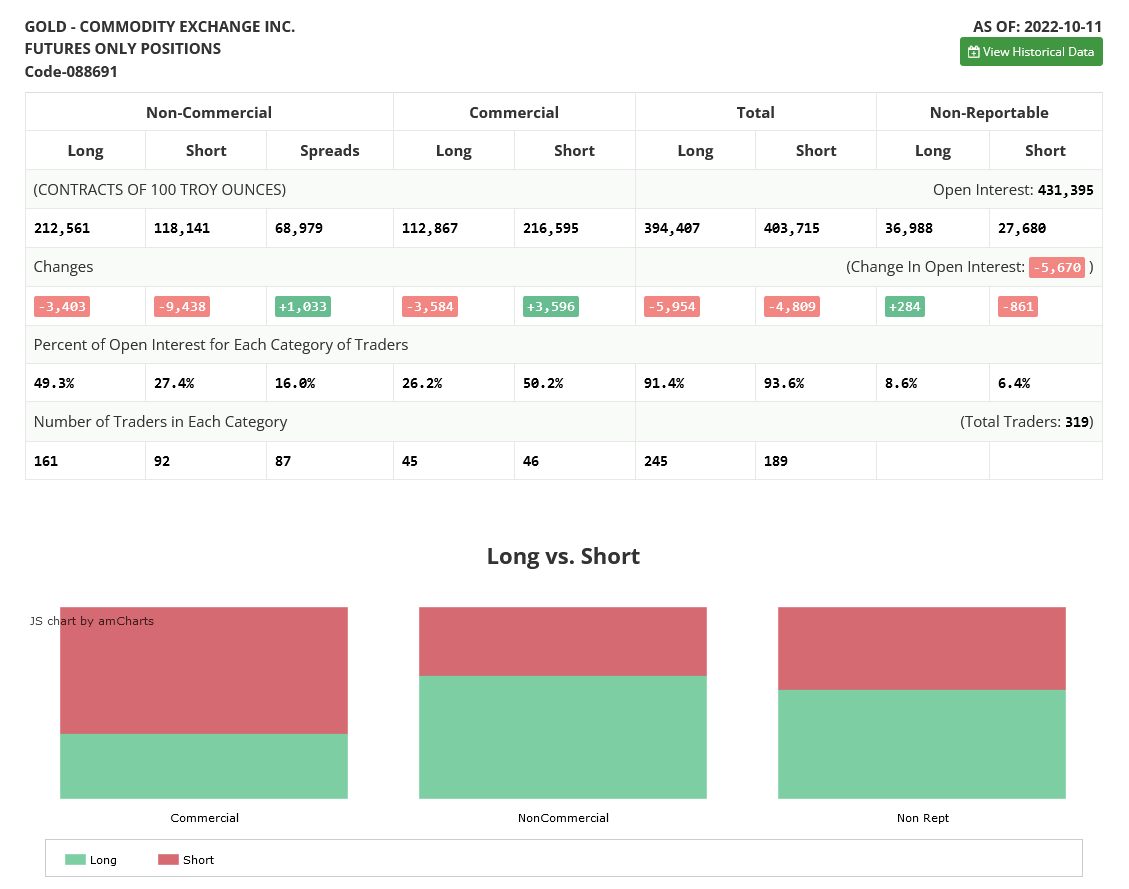
Gold Commitment of Traders Report
Support, basis the DEC (GCZ) contract remains pivotal at 1649.3/1646.6. If the GCZ begins trading under this support, it sets up a retest of the recent trading lows at 1622.2. Closes under 1622.2 will open bearish counts into the 1562.5 area. Such a move would also open substantially lower counts on the monthly. Closes below 1562.5 will suggest a test of critical support of 1440.6/1435.0 with a long-term shot at the 1380.0 level. These are all long-term, monthly targets for nearby futures.
Nearby Gold Futures Weekly
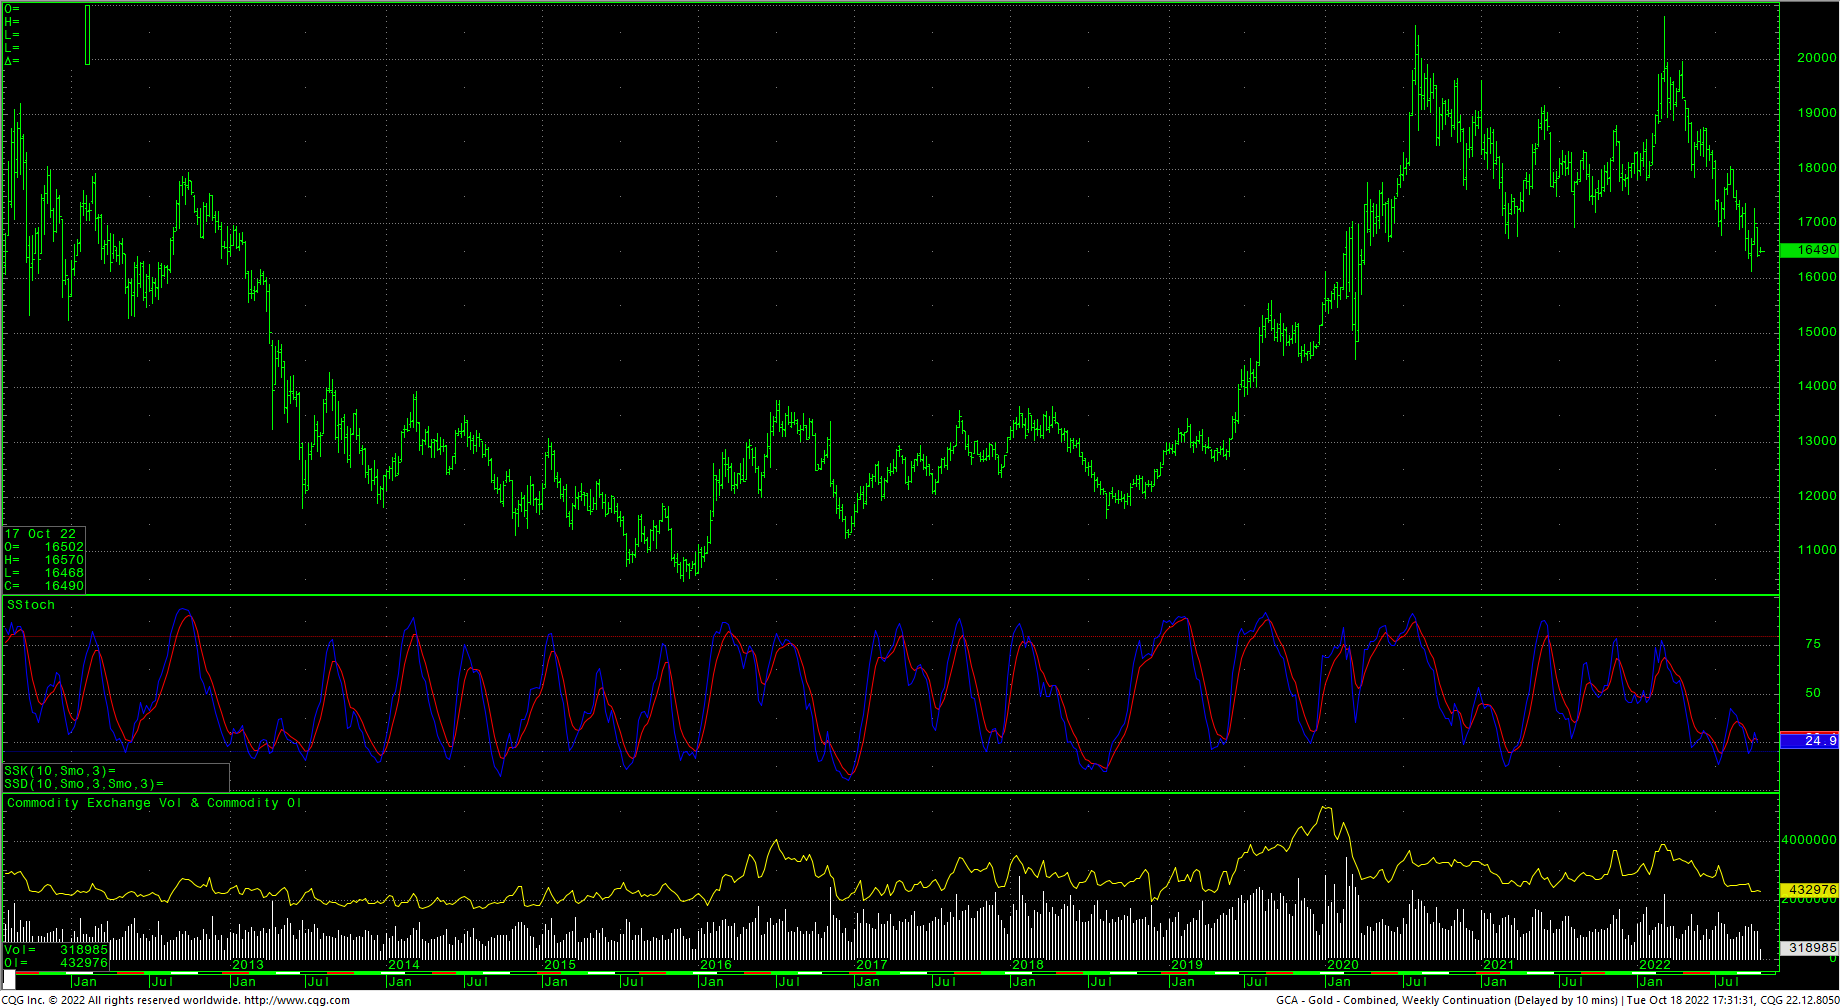
Resistance, short-term, is 1681.0 and a drive back over that area should setup a retest of the 1722.9/1728 level with resistance from there through 1733.9/1736.4. Closes over 1736.4 count to 1757 and will open potential counts to pivotal daily resistance at 1791/1793. Daily closes over 1793 are bullish and will set up 1809 with counts to 1846. Closes over 1846 suggest critical daily resistance at 1901/1904.
Gold Futures Inflation-Adjusted Monthly
Charts courtesy of CQG, Inc.