
TECHNICAL ANALYSIS (by Intraday Dynamics)
Follow Intraday Dynamics on LinkenIn
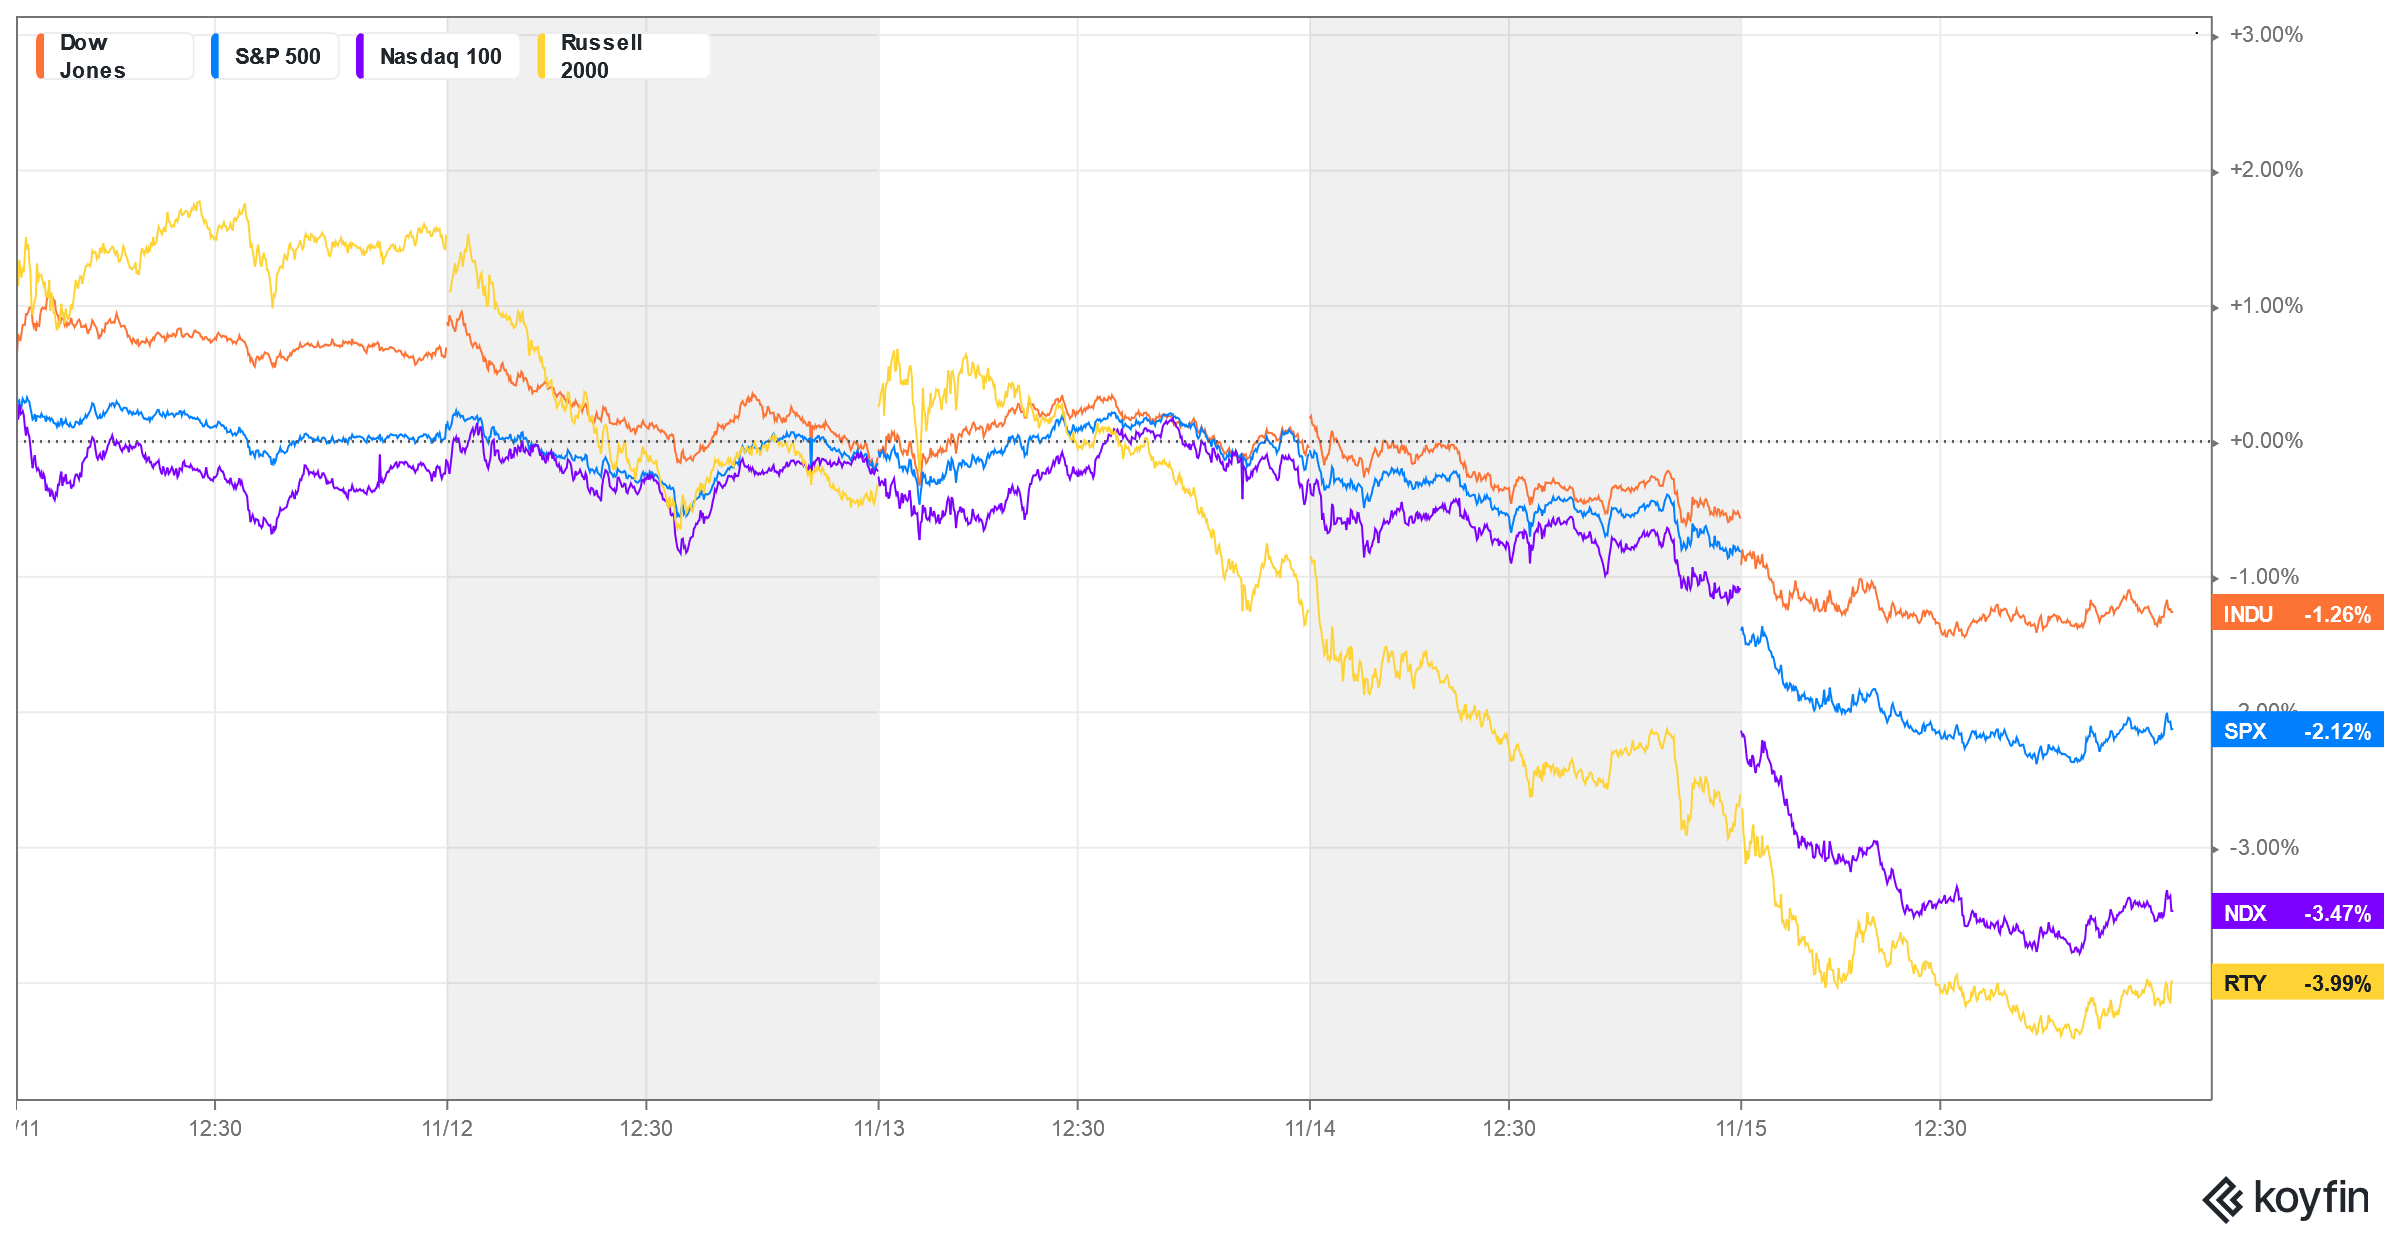
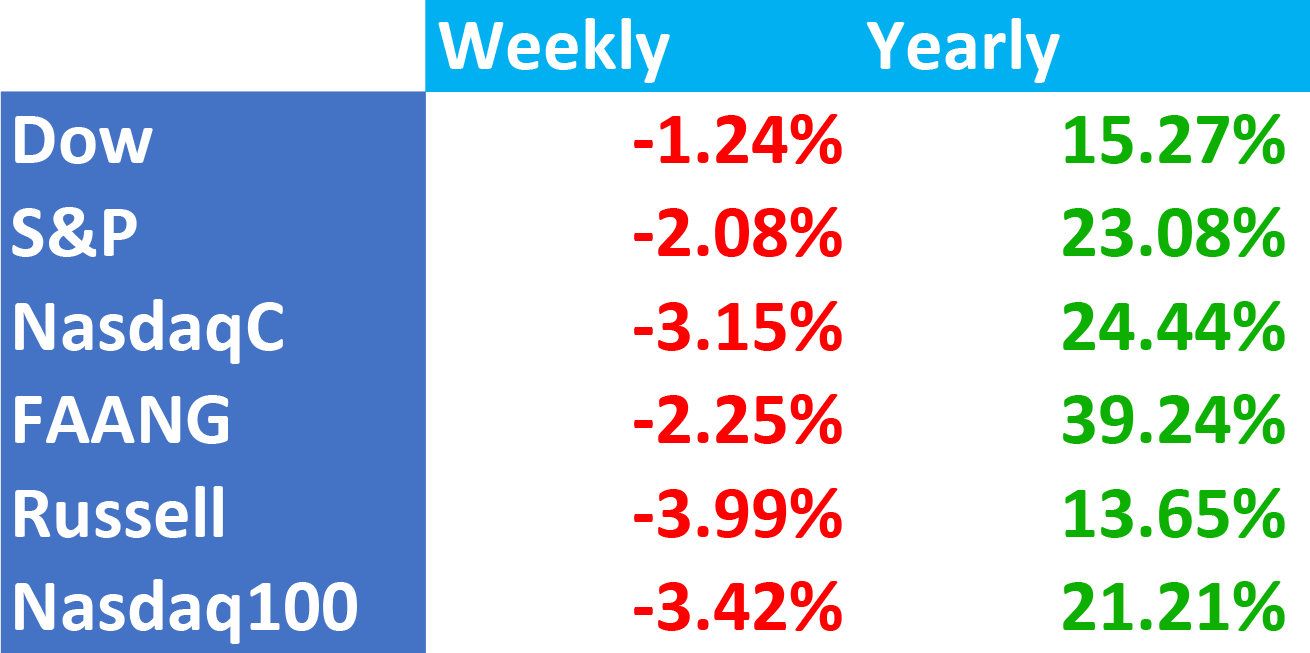
Major Indices Week of November 15, 2024
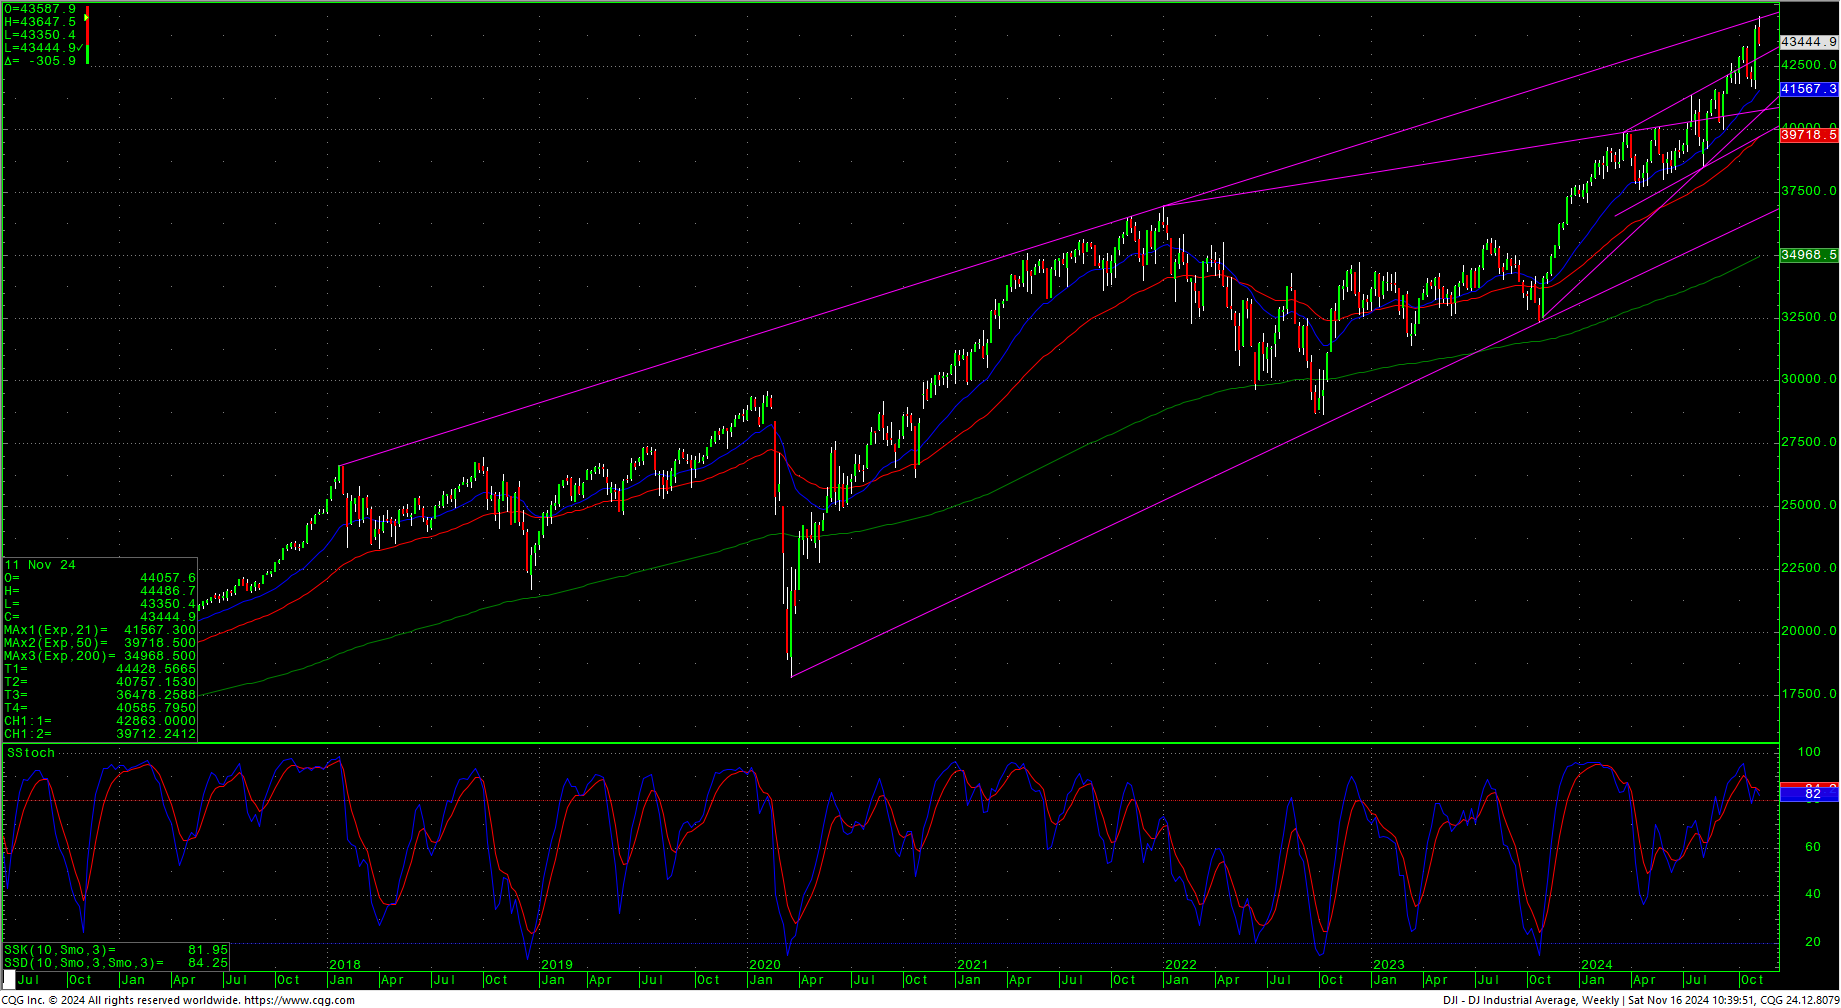
 Dow Jones Industrial Average Weekly Candles
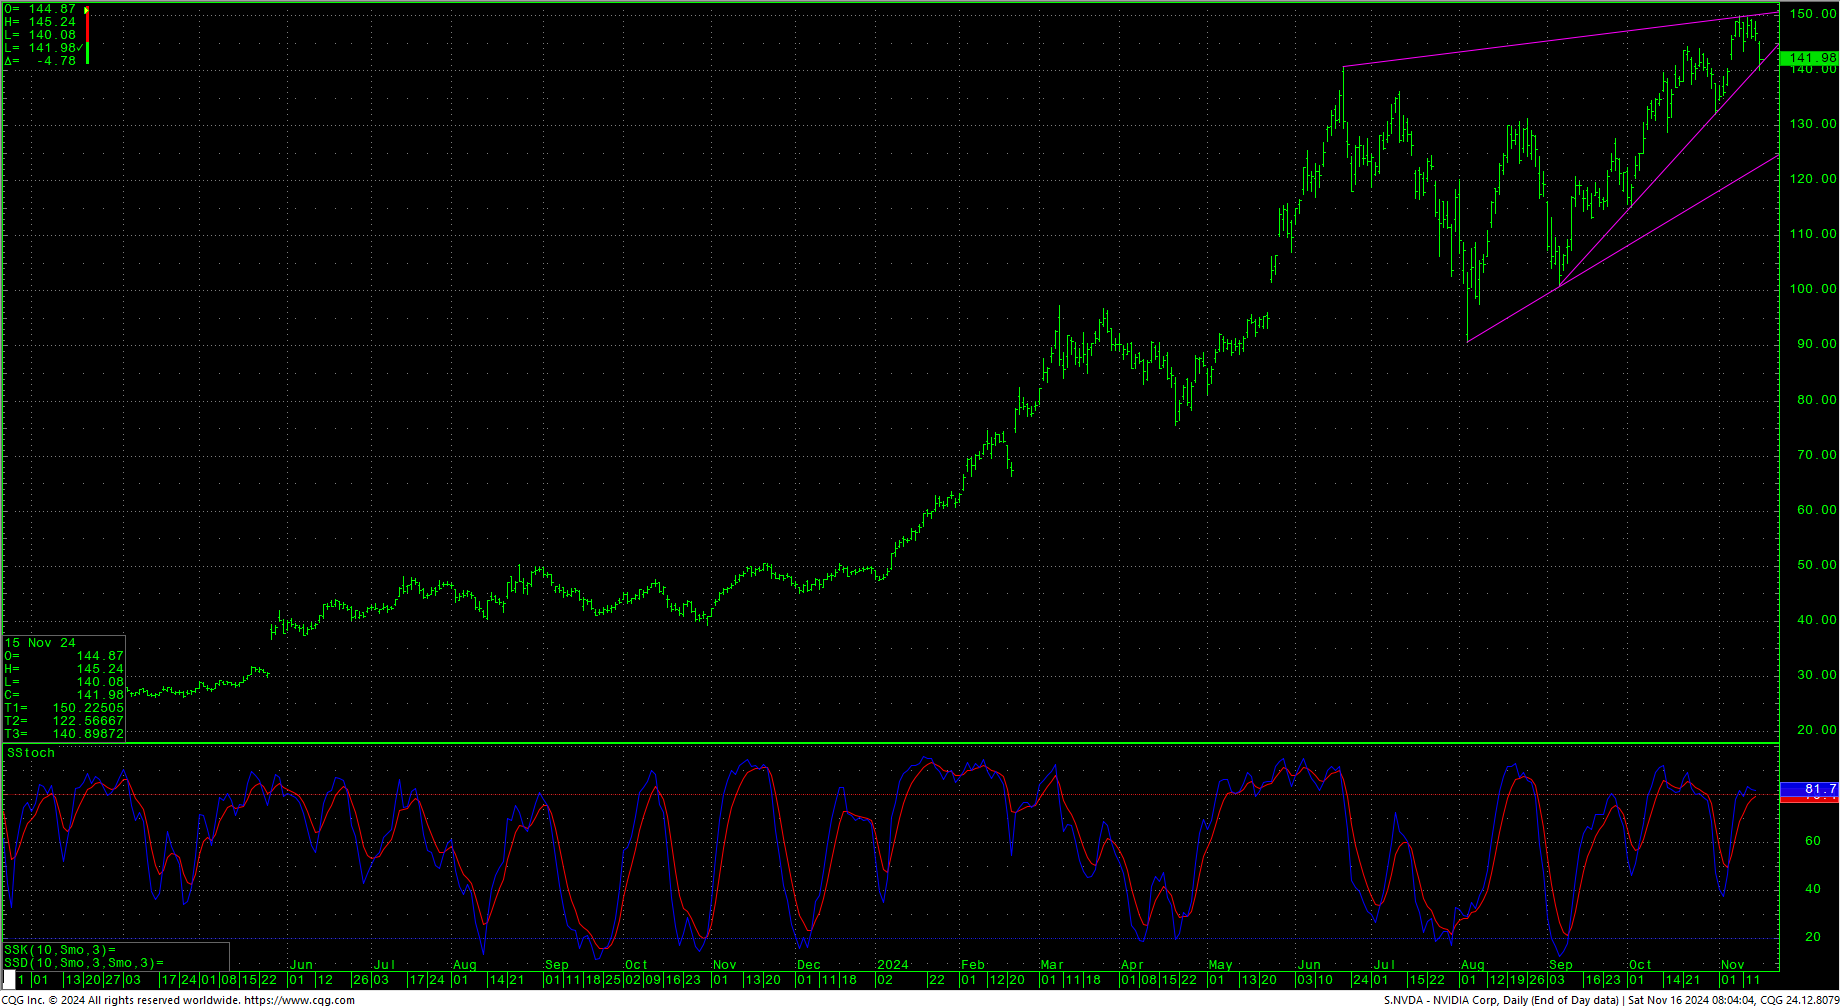
 Stocks sold off most of the week with prices setting highs in Monday’s minor timing and accelerating in Friday’s cycle timing. The high-flying Russell led the way down with tech just behind. NVDA has a large pennant/cone pattern on the daily and tested a steep trendline Friday with the stochastics threatening to hook lower. Commodities also took a hit with Gold and Crude Oil selling off. The US Dollar rallied sharply with bonds taking a hit and yields rising to July 2024 levels.
We posted some short-term updates on LinkedIn, talking about how the S&P 500: “As last night’s post noted, last Thursday’s gap likely could be an exhaustion gap and a gap lower today might leave an island top on the daily with the stochastics looking to roll over. On Monday the S&P set a Bearish Evening Star on the candles. Prices have taken out the first key level at 5894 and now targets 5856 and 5819/5816. “Friday marks some moderate cycle timing and we may see increased trade during the session.” Note: The ‘breakaway’ gap begins at 5864 and runs through 5783.”
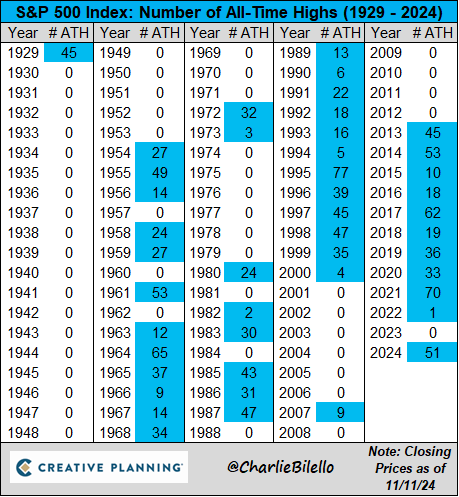
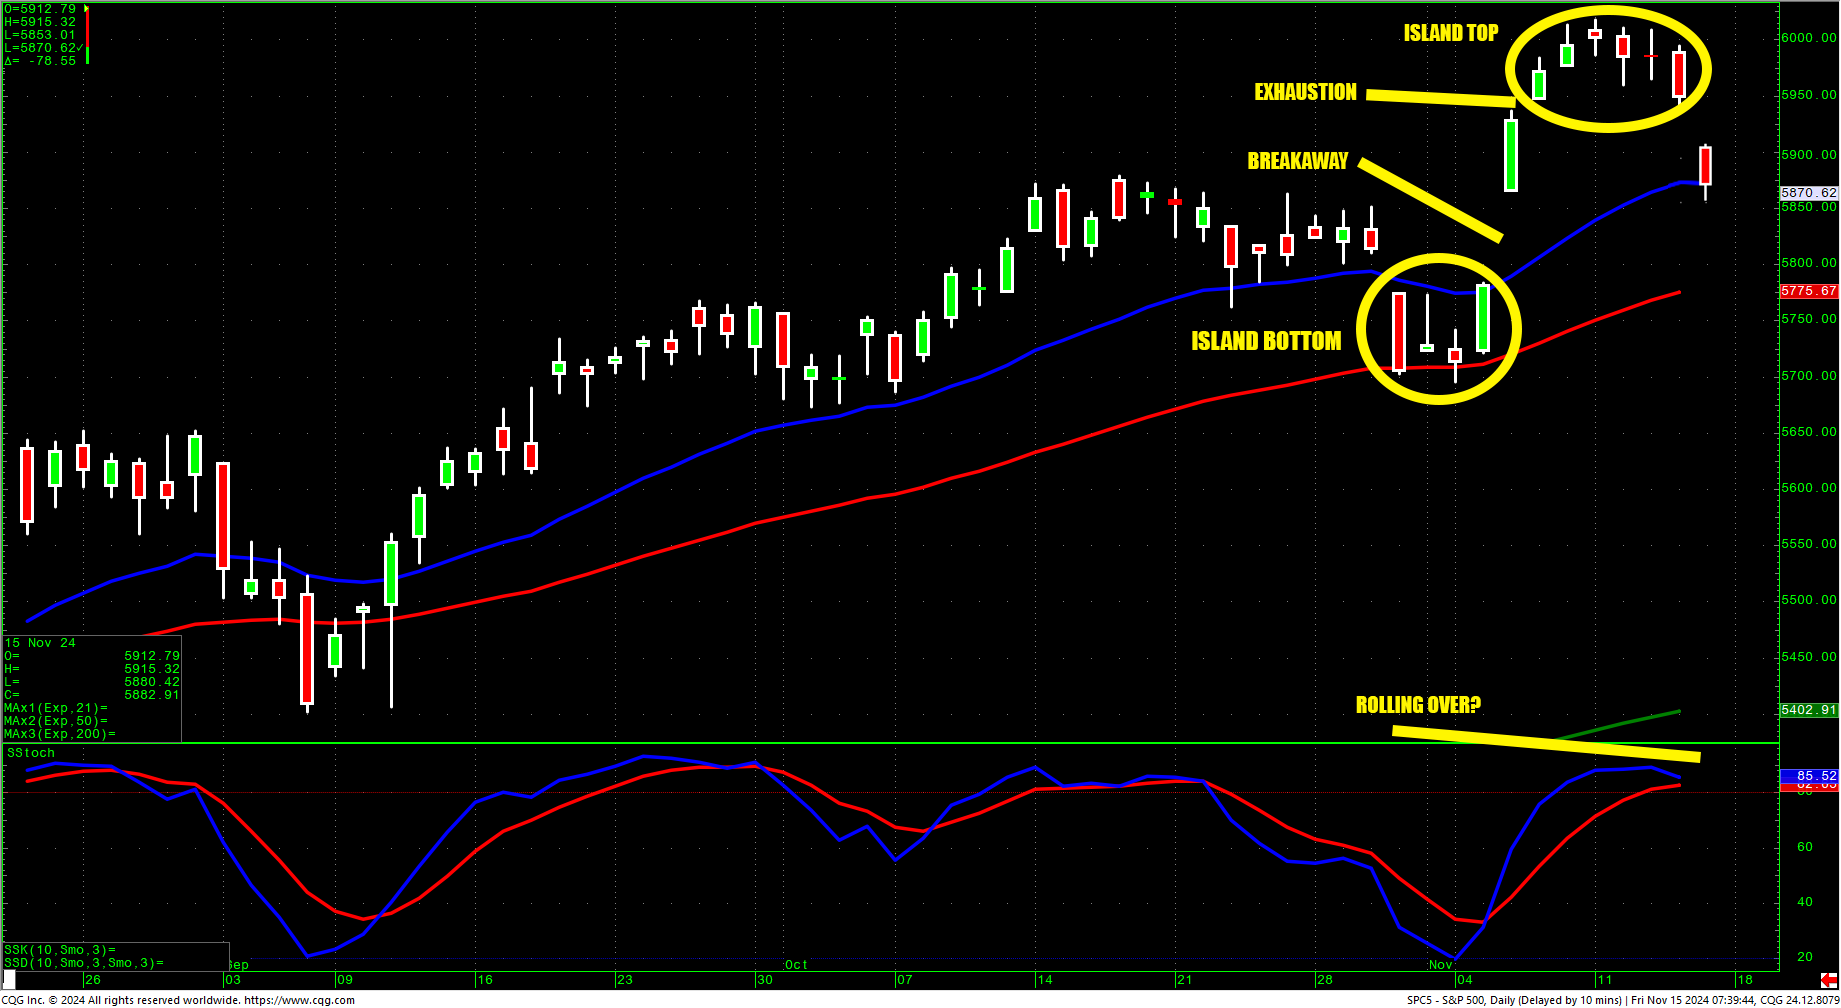 The S&P now has a very unusual pattern of trade over the past three weeks with an island bottom in early November, a “breakaway” gap and then an island top over the past week. Suffice to say, this 300-point trading range now most likely defines intermediate-term trends on a breakout one way or the other. As Charlie Bilello has noted: “The S&P 500 has already hit 51 all-time closing highs, the 7th most in history.” Prices ended 17+ points off the low on Friday, but there remains a larger gap on the daily. Gapping away from this island would create one of the most unique patterns, technically, to ever develop.
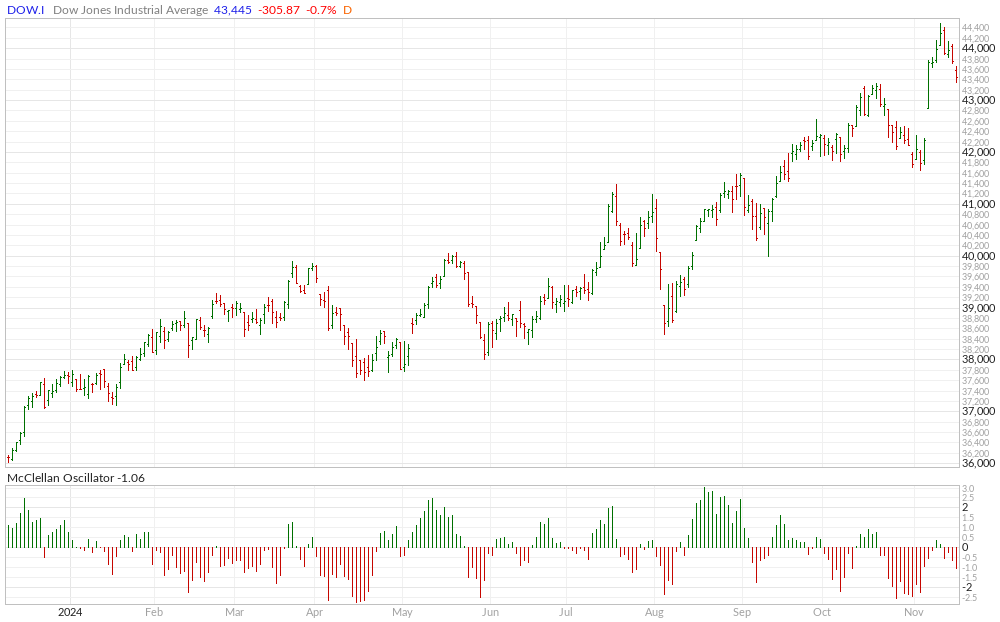
 The Dow reversed lower on the week after prices hit the upper channel line as outlined in last week’s update. That is a channel line from the 2019 tops through the late 2021 tops. Last week, we pointed out that “…there are a few significant divergences occurring in breadth, total new highs in the Dow and 52-week highs, those indicators are leaning toward fear with all the frothy sentiment.”
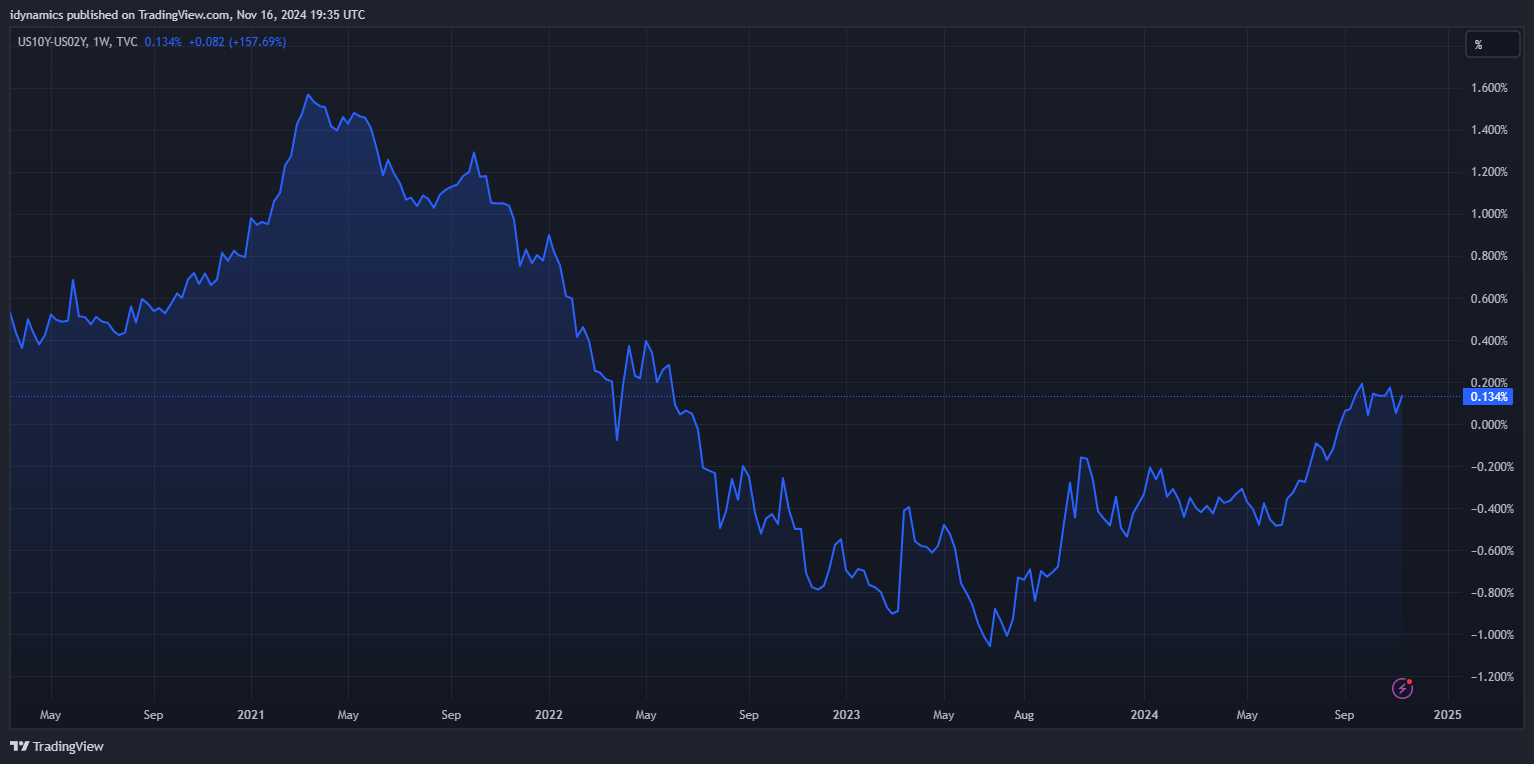
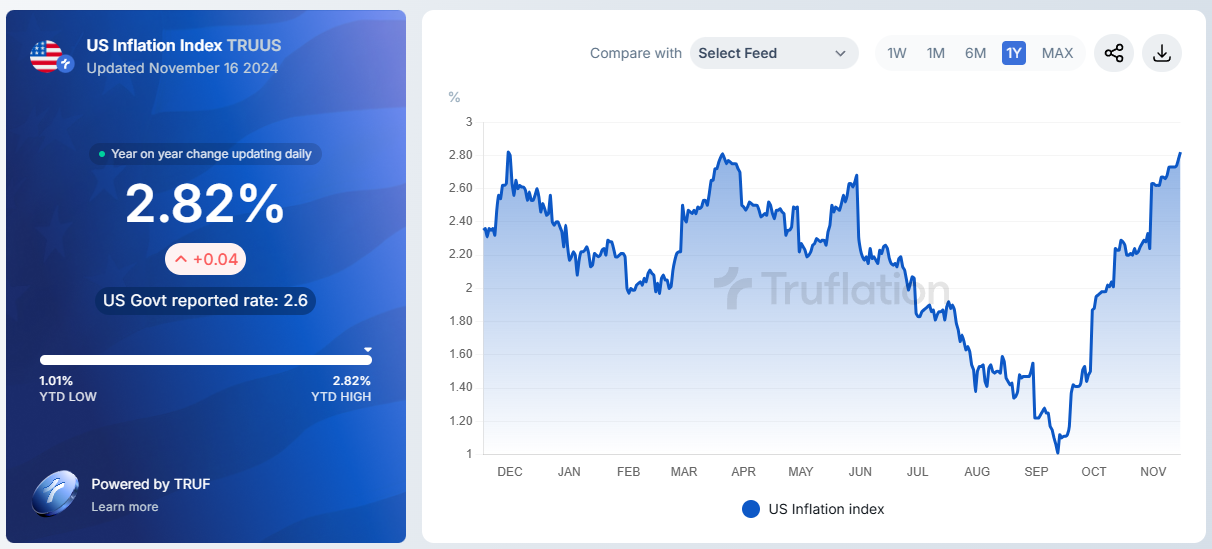
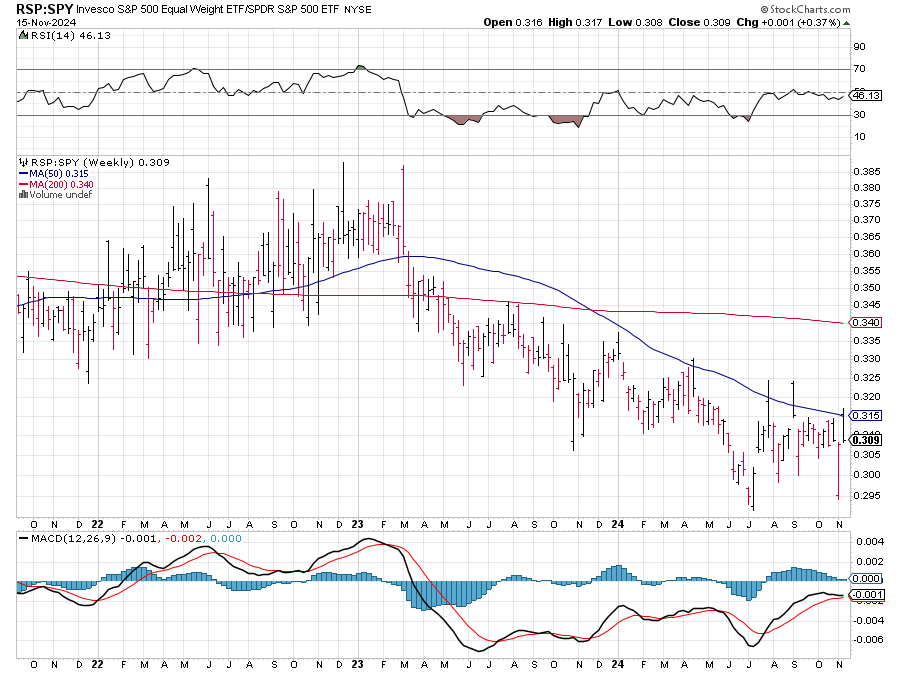
The RSP:SPY remains in a total sideways trade since August. Bonds moved to the lowest levels since July. The MAG7 sold off in a reversal from record highs. McClellan Oscillators are validating the action. Sentiment remains mixed with some indicators (the diverging ones) showing extreme fear. The 10YR-2YR Yield Curve remains slightly in positive territory. Truflation continues to move higher toward the 2024 summer tops.
10YR-2YR Yield Curve Weekly
 VIX Weekly H-L-C
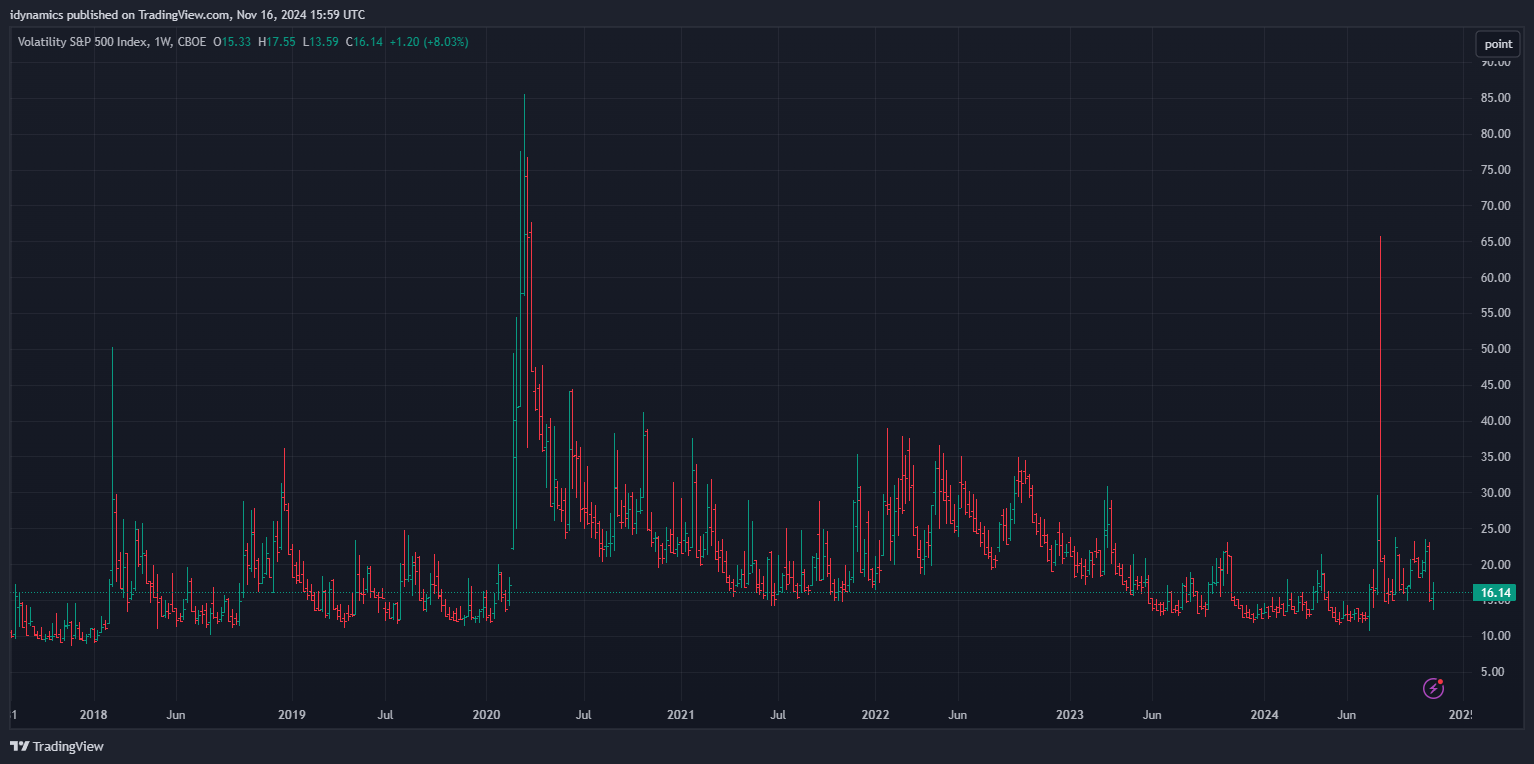
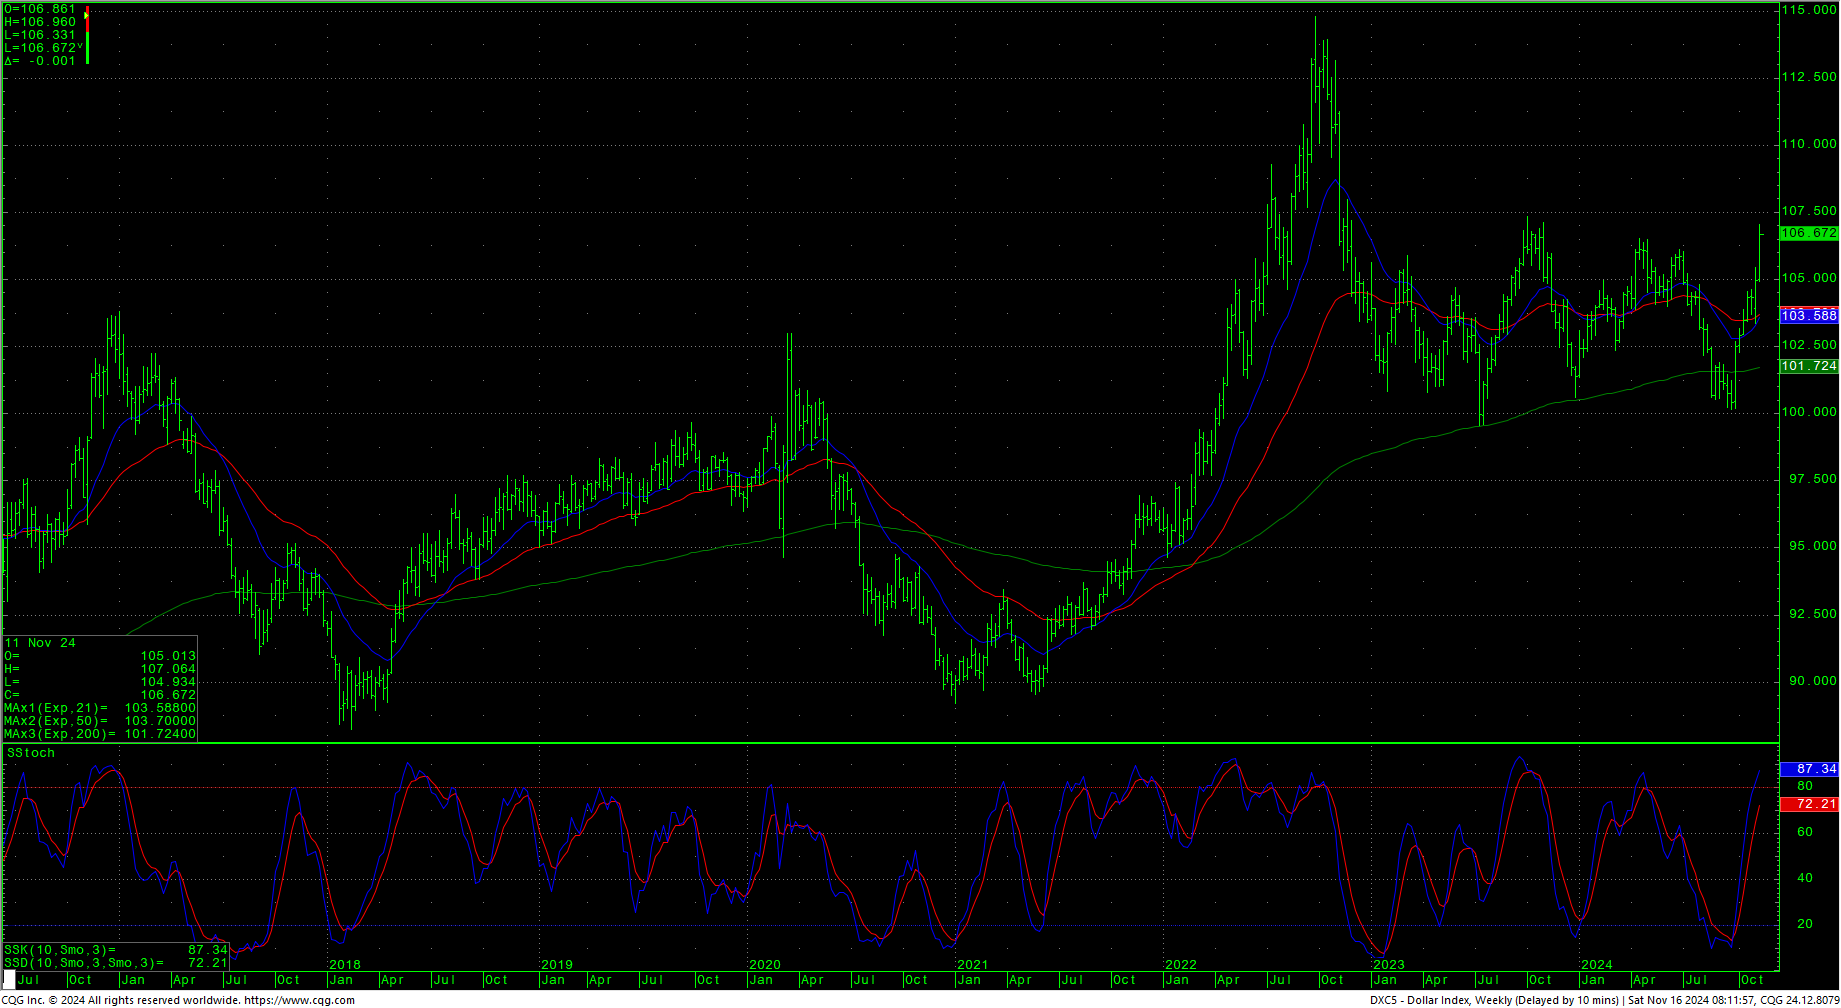
The VIX jumped on Friday and entered the gap area left last week. The US Dollar rallied to a one year high with Thursday’s close the highest daily close since 1 November 2023.
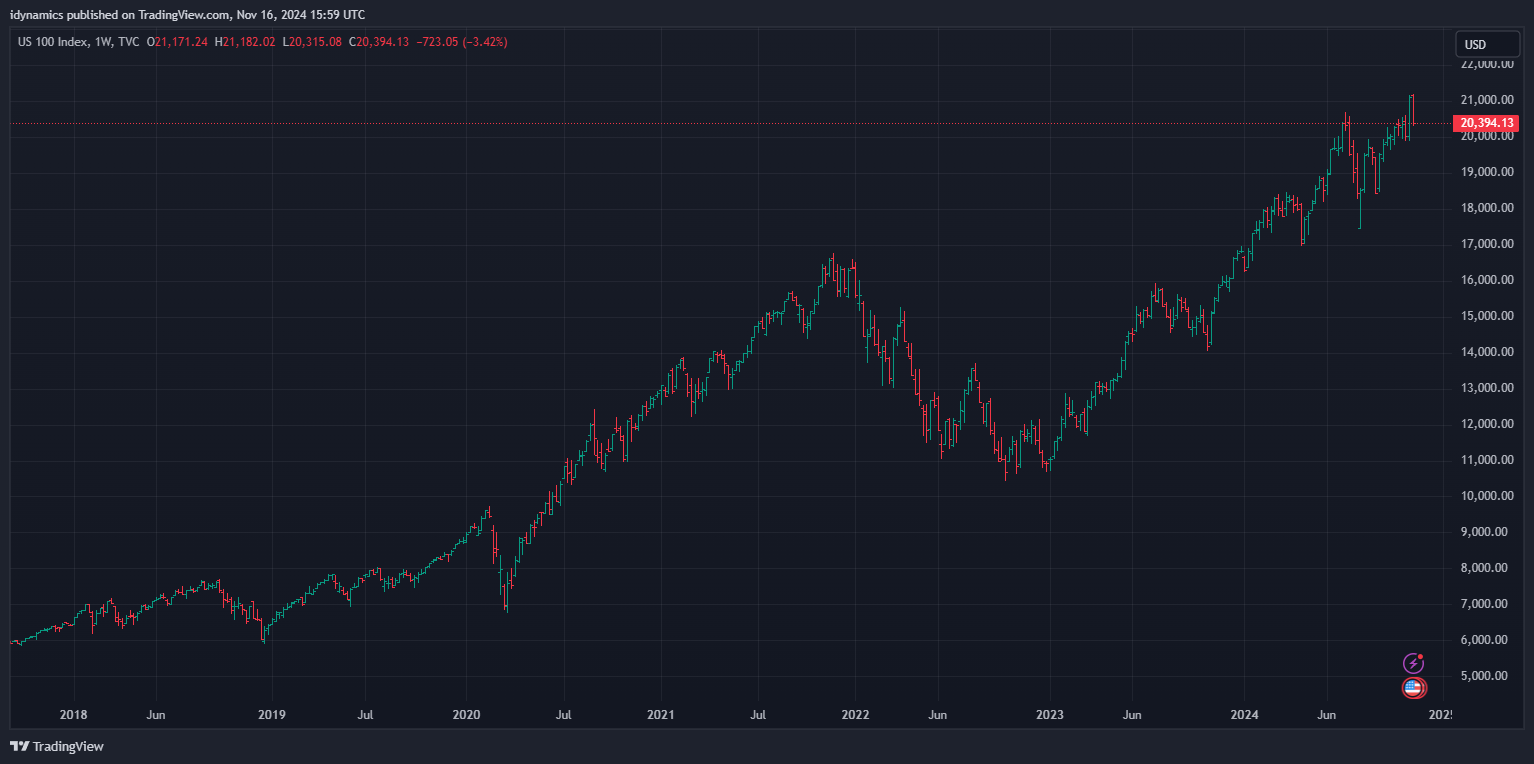
 Nasdaq 100 Weekly H-L-C
 52-Week A/D Line
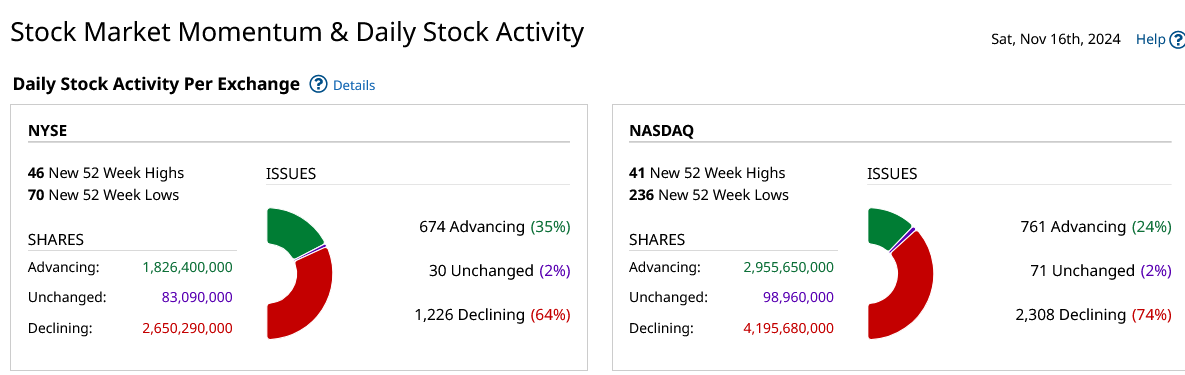
Breadth remains weak and diverging and represents extreme fear.


