TECHNICAL ANALYSIS
VIX Volatility Index Daily Candles
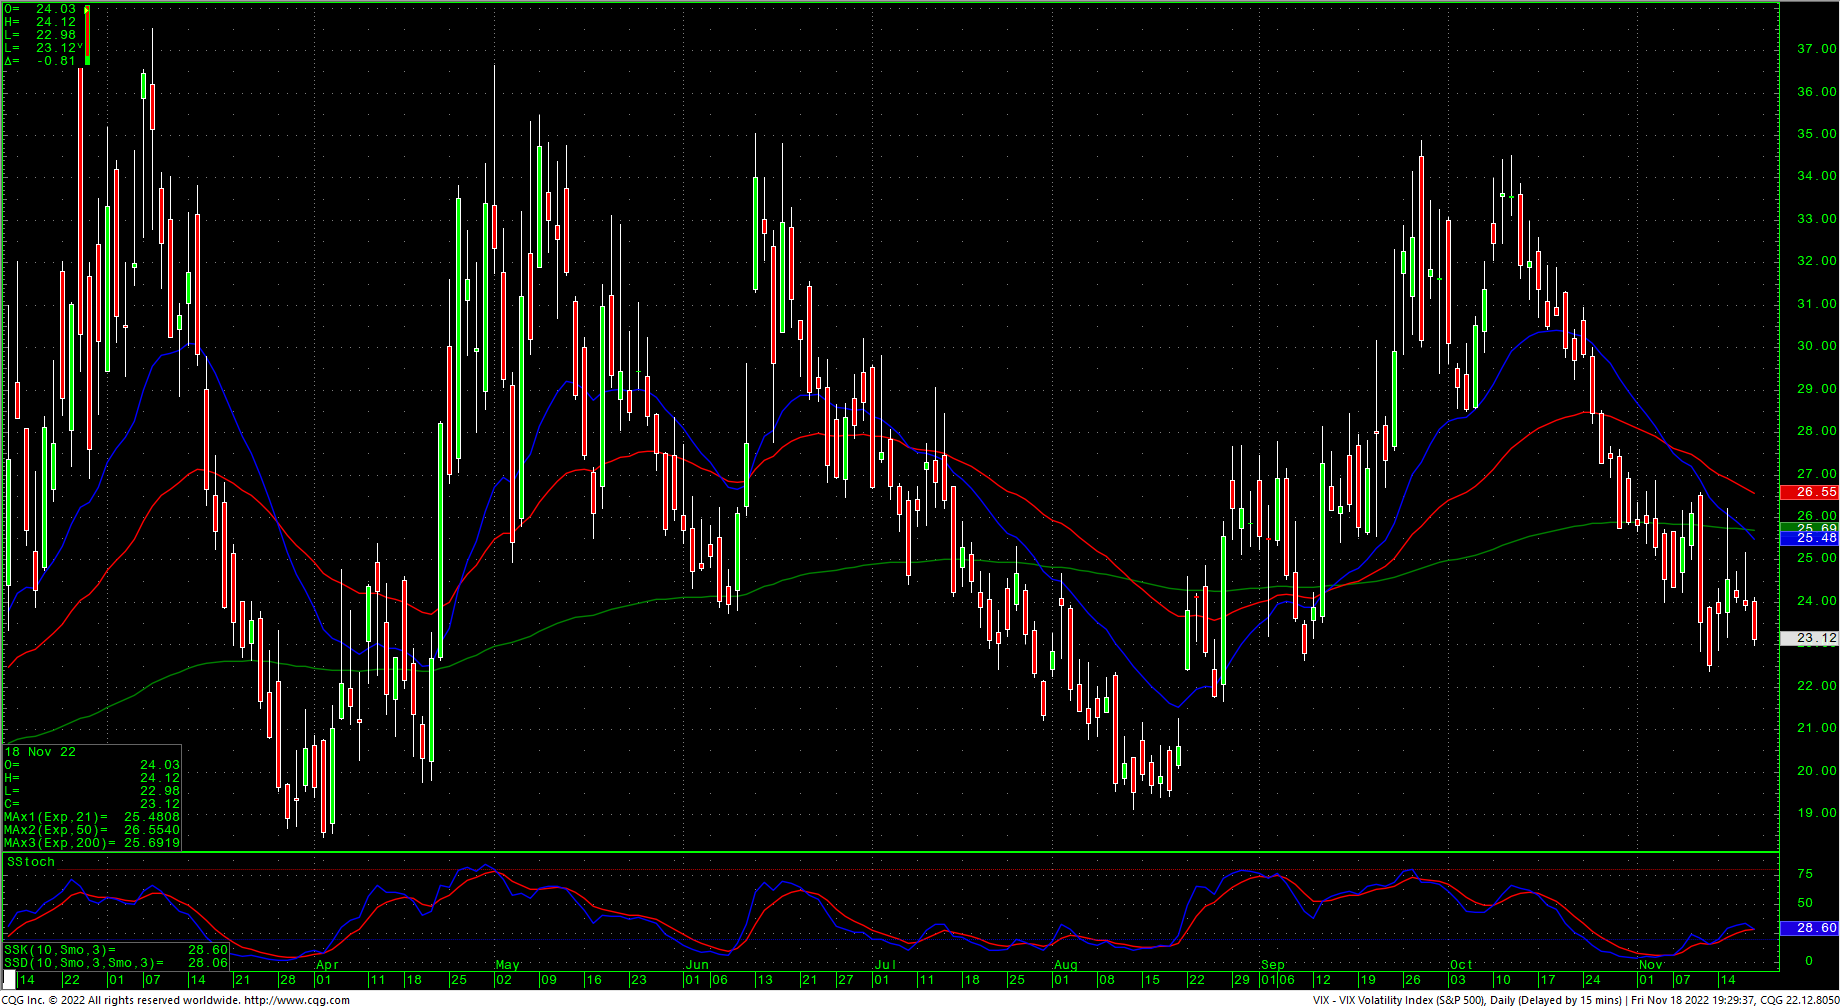
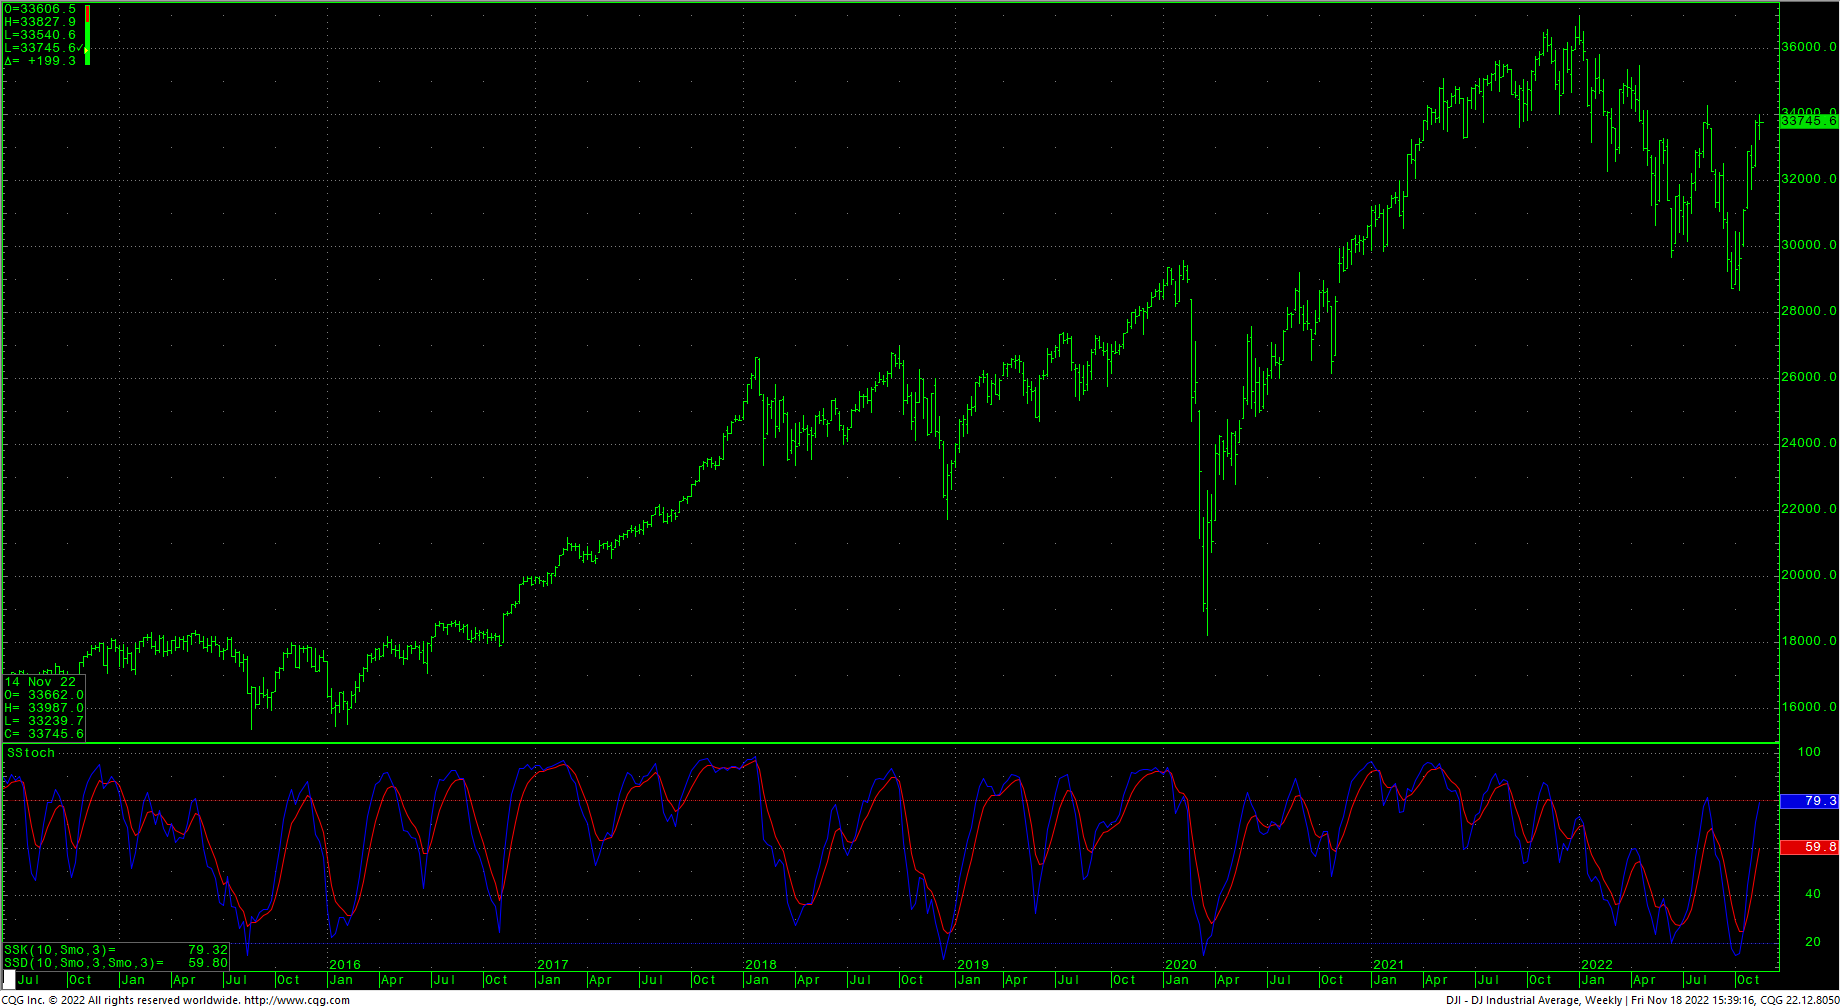
The DJIA closed up 200 points on Friday to end the week a couple of points lower, just off the current closing high on the daily chart, set last Friday the 11th, at 33747.8. This area represents a 62% retracement of the entire bear move in 2022. The weekly held to a very tight range overall and managed a bullish candle for the close. The daily is slightly overbought and a continued rally would potentially setup a small bearish divergence on the daily oscillators. Sentiment remains mixed with the VIX trending back toward a two-month low. Fund managers continue to hold cash, betting on a slowdown in 2023 with a decidedly bearish bias.
AAII Investor Sentiment Survey
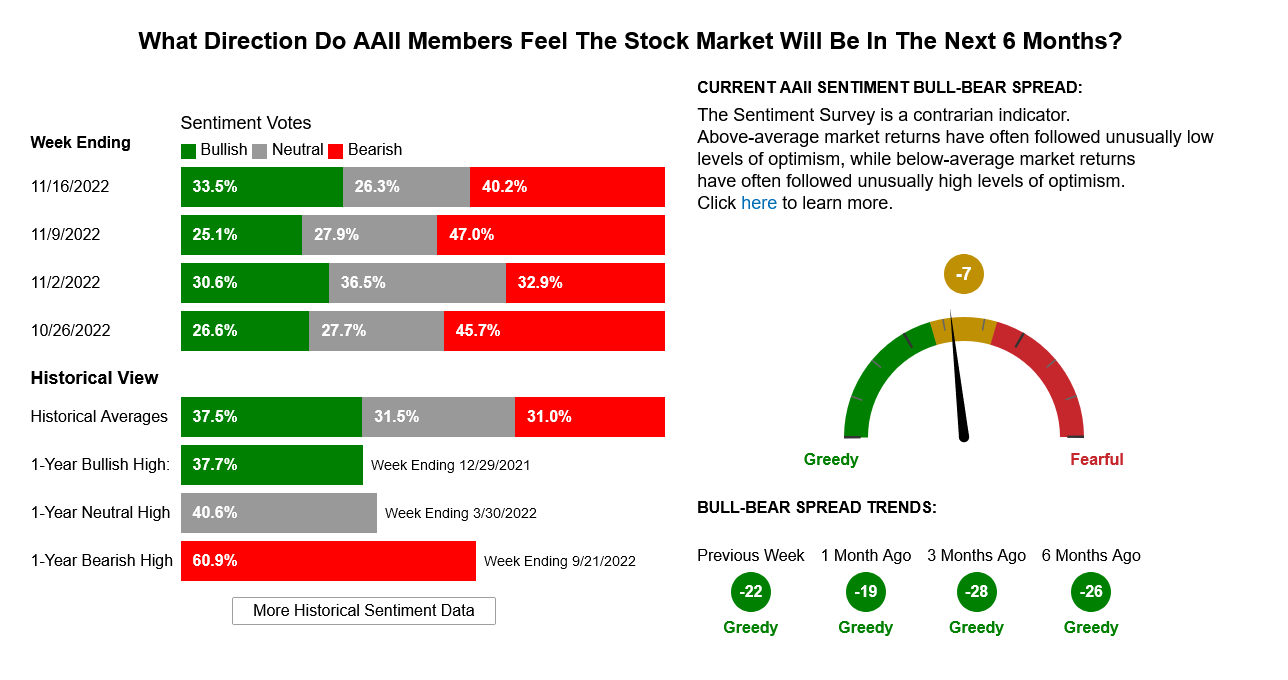
CNN Fear & Greed Index

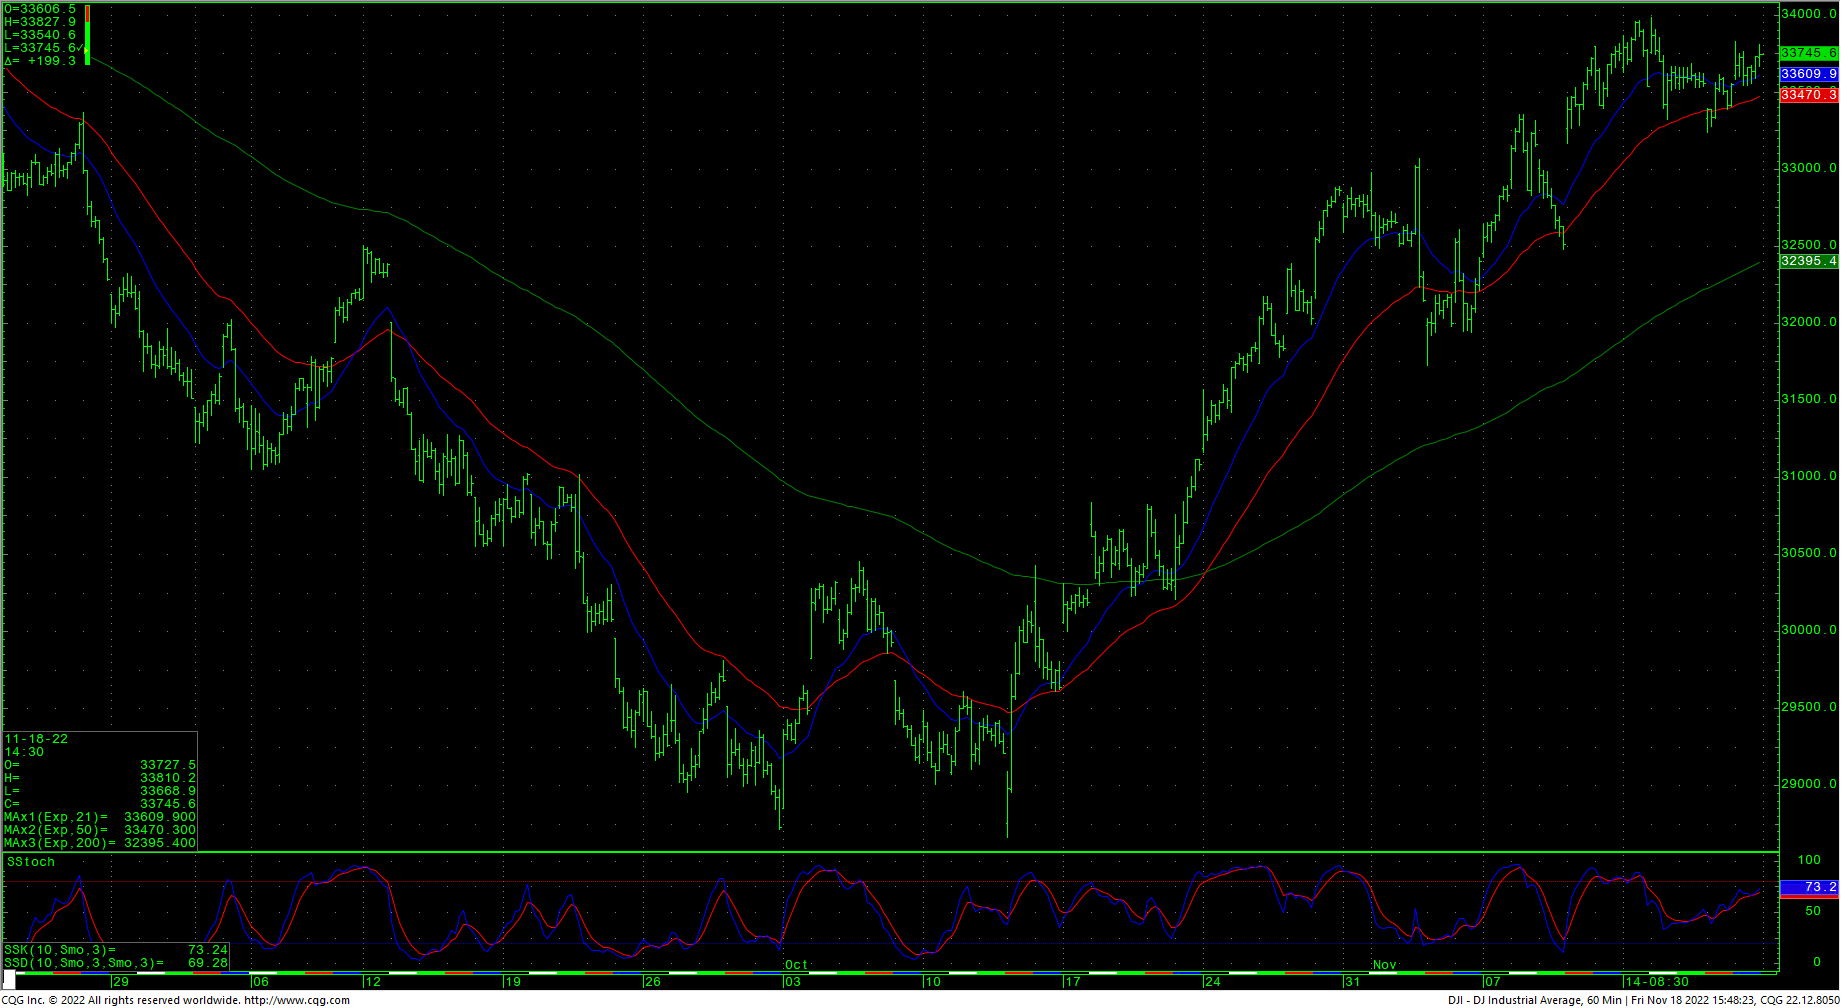
At this juncture, prices are bumping up a last-gasp area of hourly resistance 33800/33810. A continued drive through this resistance should test the recent swing high at 33987 with a shot to the August highs at 34281. Closes over the 34281 level should carry to the absolute last-gasp area on the daily for the bears at 34879/34995. Closes over 34995 suggest a test of the April high at 35492. A breakout over 35492 will setup a test of the February highs at 35768/35824 with a shot at the 2022 highs of 36952.
Dow Jones Industrial Average Weekly HLC
Support is at 33540 and 33453 with short-term pivotal support at 33167 through 33123. Closes under 33123 suggest 32857 with potential to critical short-term support against the 32590/32580 area. Closes under 32580 are bearish and should test 32478 with counts the 32292/32260 level. 32260 represents the last-gasp support area for the short-term hourly outlook and a breakdown under that support should test major hourly wave lows at 31938 and possibly 31727.
Dow Jones Industrial Average Hourly HLC
Resistance
- 33800/33810 *** ↑
- 33987 **
- 34281 ** ↑
- 34879/34995 *** ↑
- 35492 ** ↑
- 35768/35824 ↑
- 36952 (record highs)
Support
- 33540 **
- 33453 **
- 33167/33123 *** ↓
- 32587 **
- 32590/32580 *** ↓
- 32478 **
- 32292/32260 *** ↓
- 31938 ***
- 31727 *** ↓