
TECHNICAL ANALYSIS (by Intraday Dynamics)
Happy Thanksgiving Week!
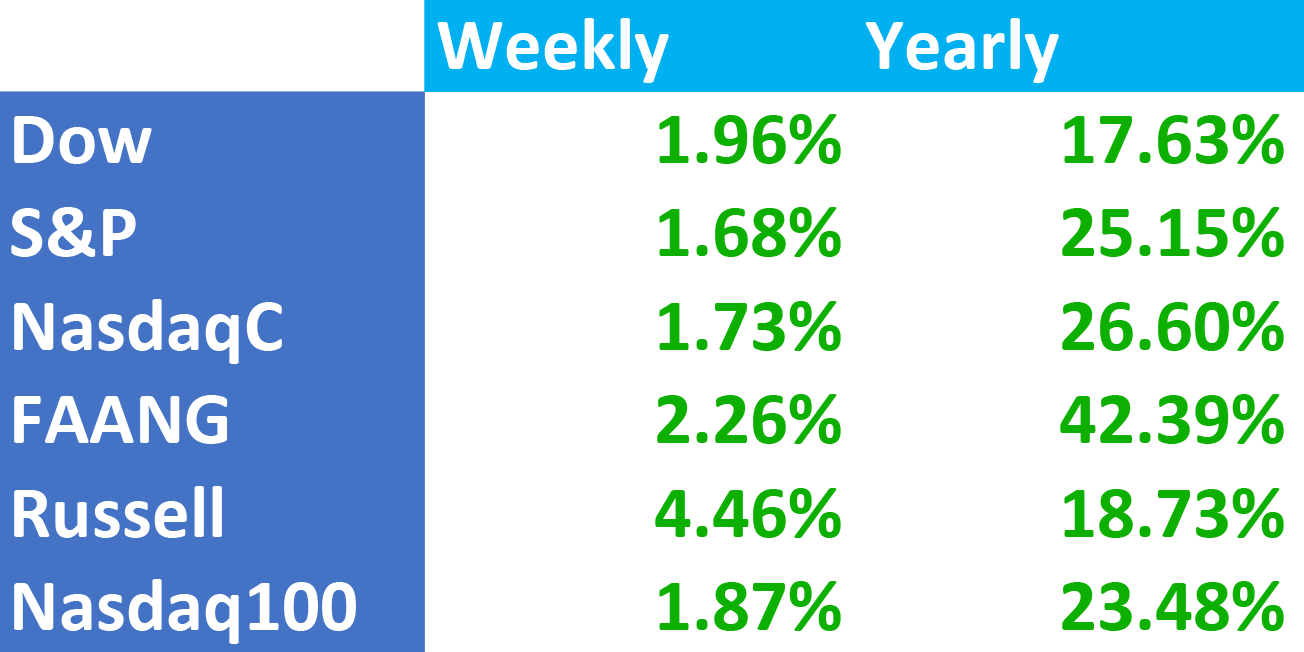
 Major Indices Week of November 22, 2024
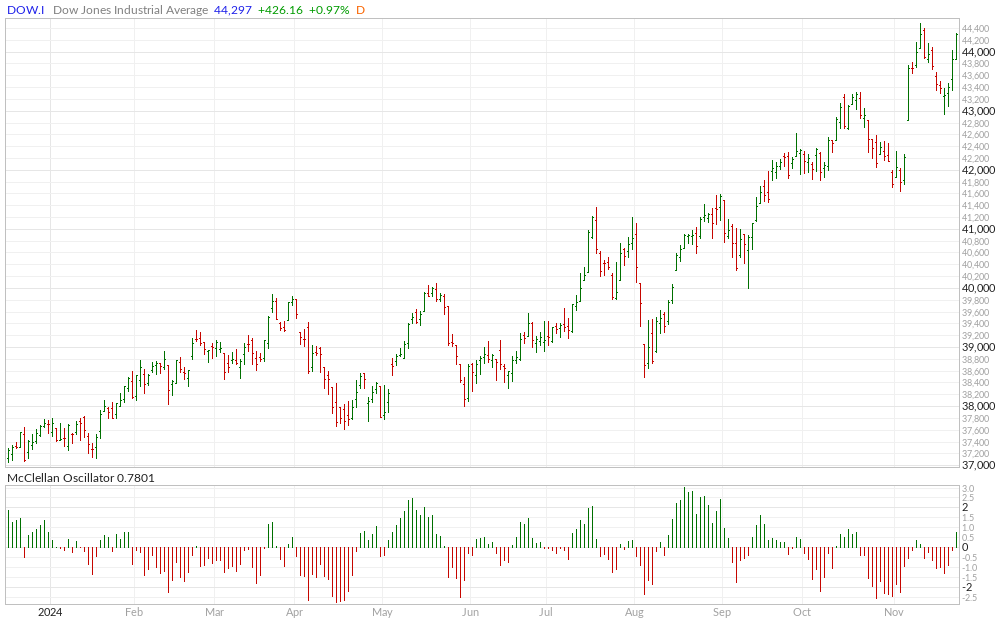
 Dow Jones Industrial Average Weekly Candles
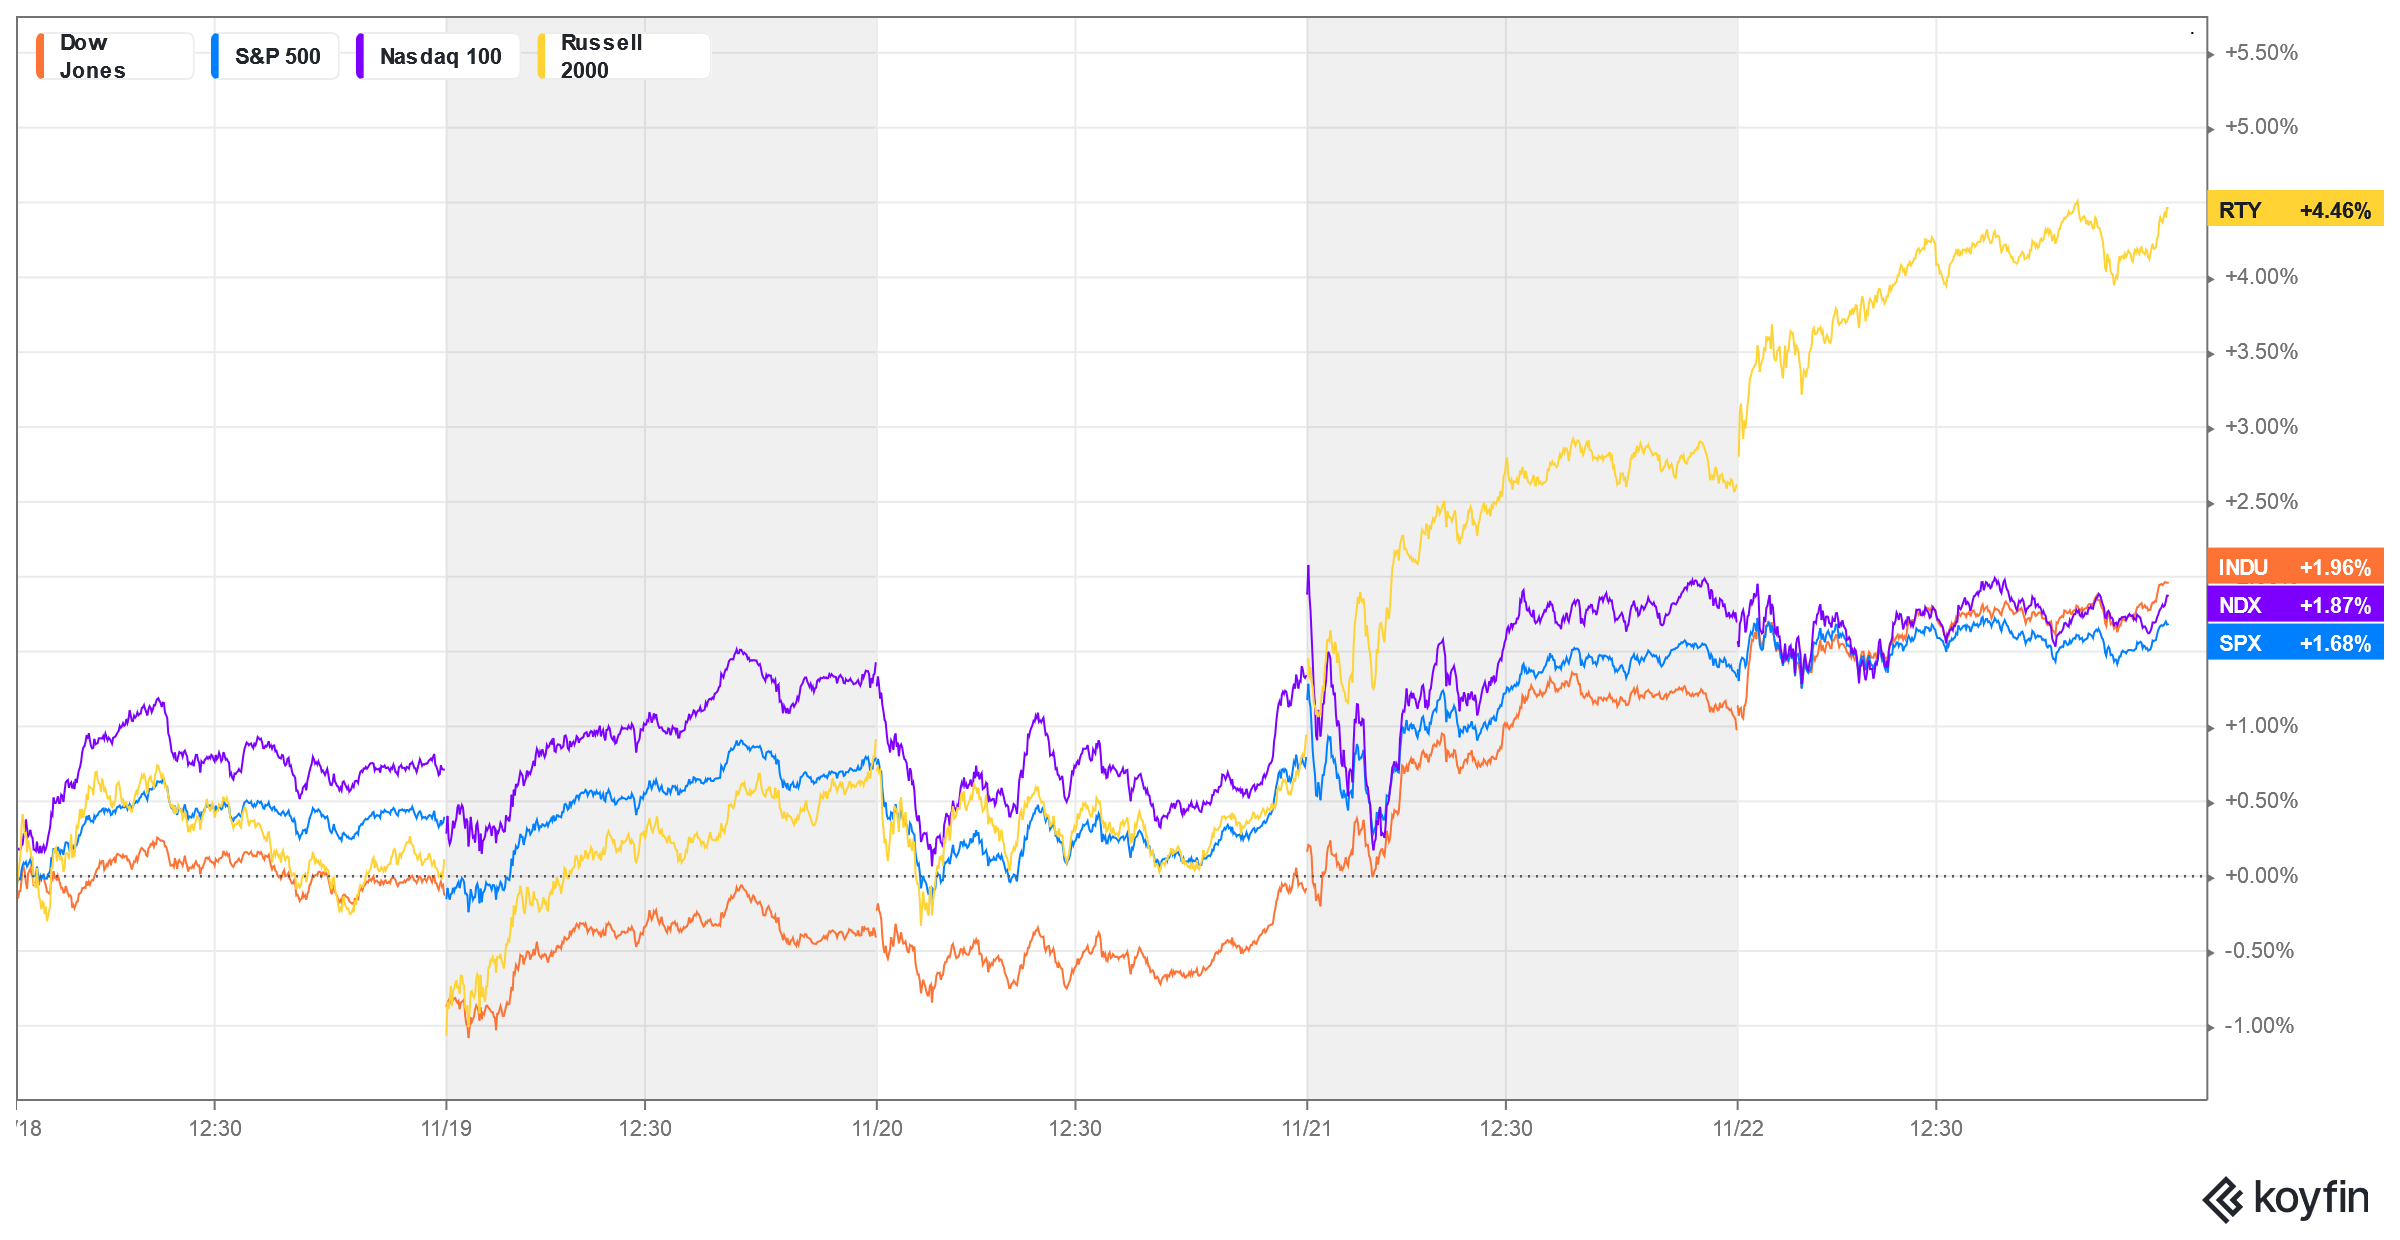
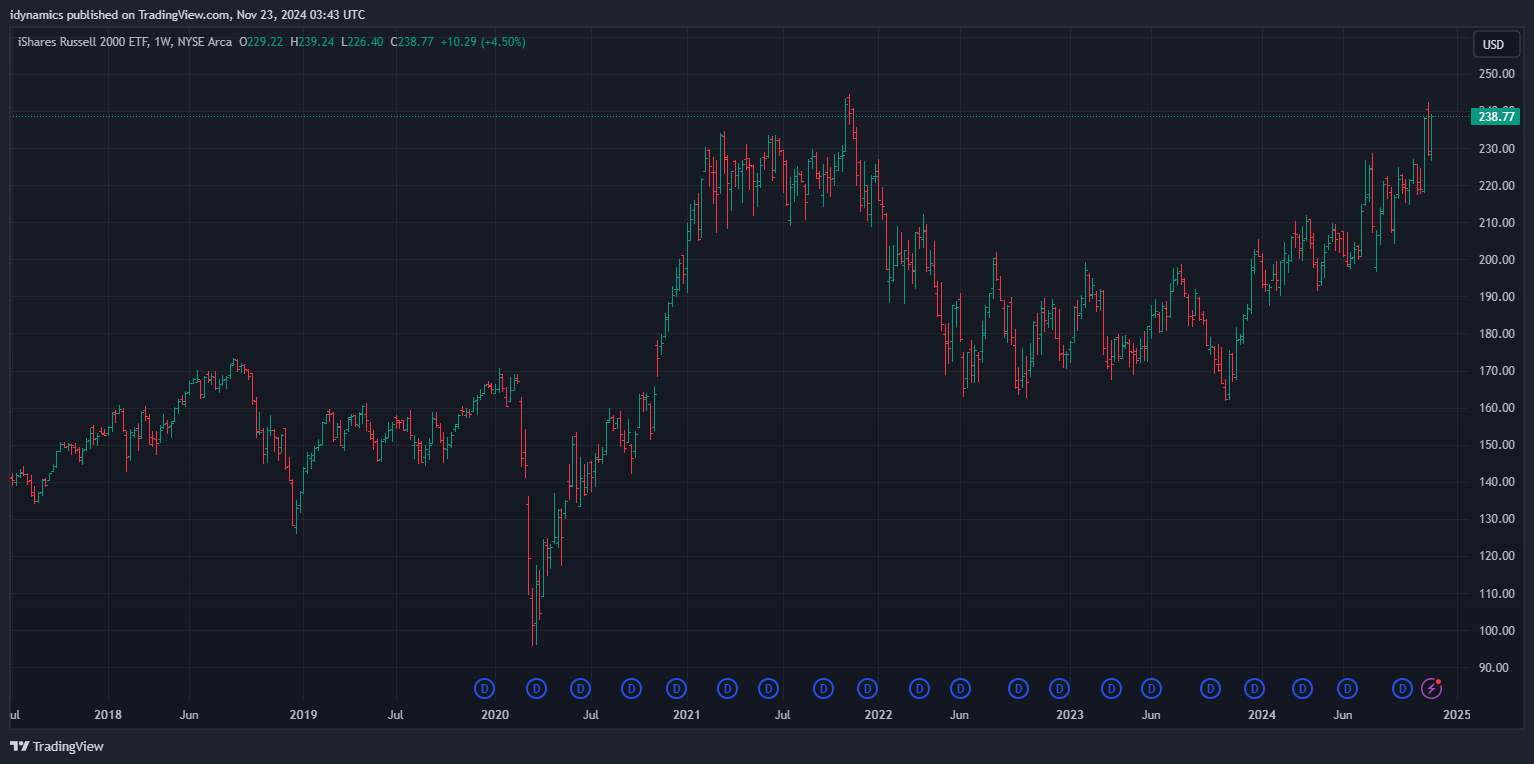
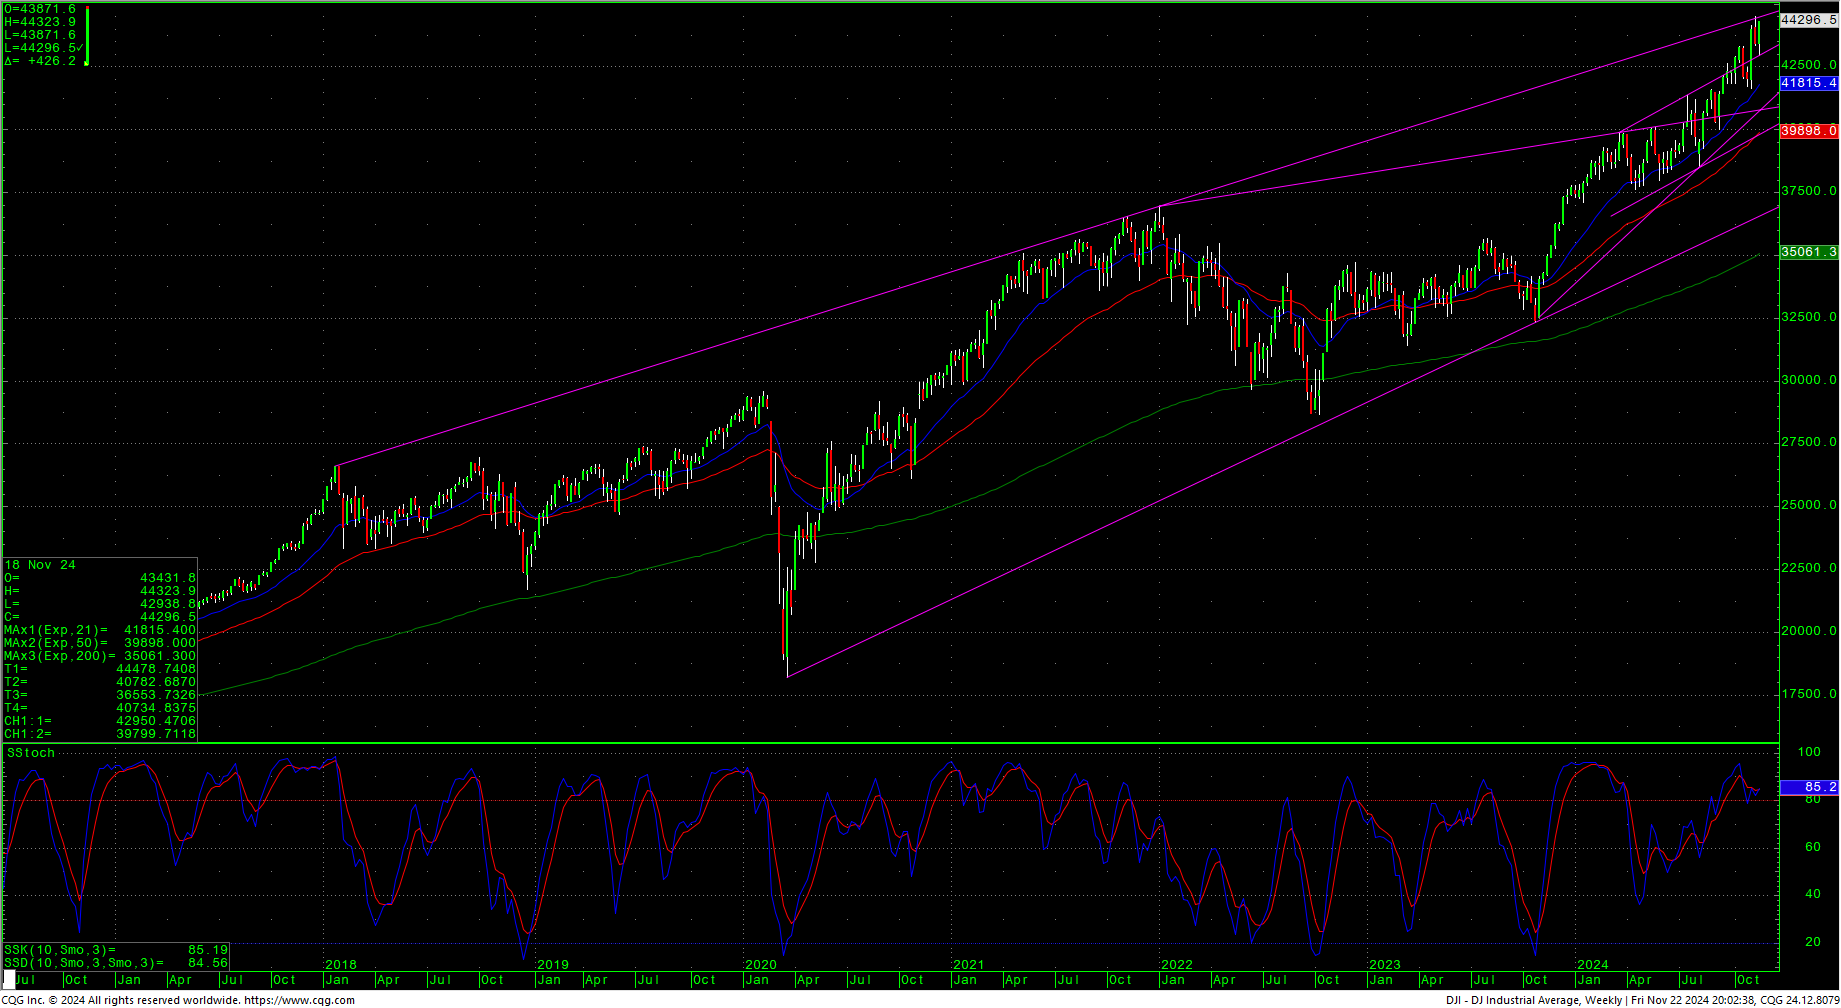 The Wall Street, post-election sugar high, continued with broad moves to the upside following Tuesday’s critical timing as prices gained back most of the previous week’s losses. We highlighted the timing on LinkedIn on Monday. Stocks staged a large upside reversal in Tuesday’s cycle timing trade and never looked back. Gains were strong across the board with the Dow setting a record daily and weekly closing high and the secondaries coming in strong and leading the overall market as the Russell gained +4.46%. Breadth improved. Tuesday’s lows put the Dow treacherously close to the gap left on the 6th and the late week rally filled the gap left on the 15th. Price and time on the Dow are basically bullish as we head into what is typically a quiet holiday week.
The S&P also tested the large gap area from the 6th and then closed the gap on the 15th, but remains shy of the daily ATH and the weekly ATH. The patterns remain quite unusual from a purely technical standpoint. The daily stochastics look like they may hook higher while the weekly remains overbought with preliminary divergences. Prices traded an inside week. For now, the path of least resistance is up.
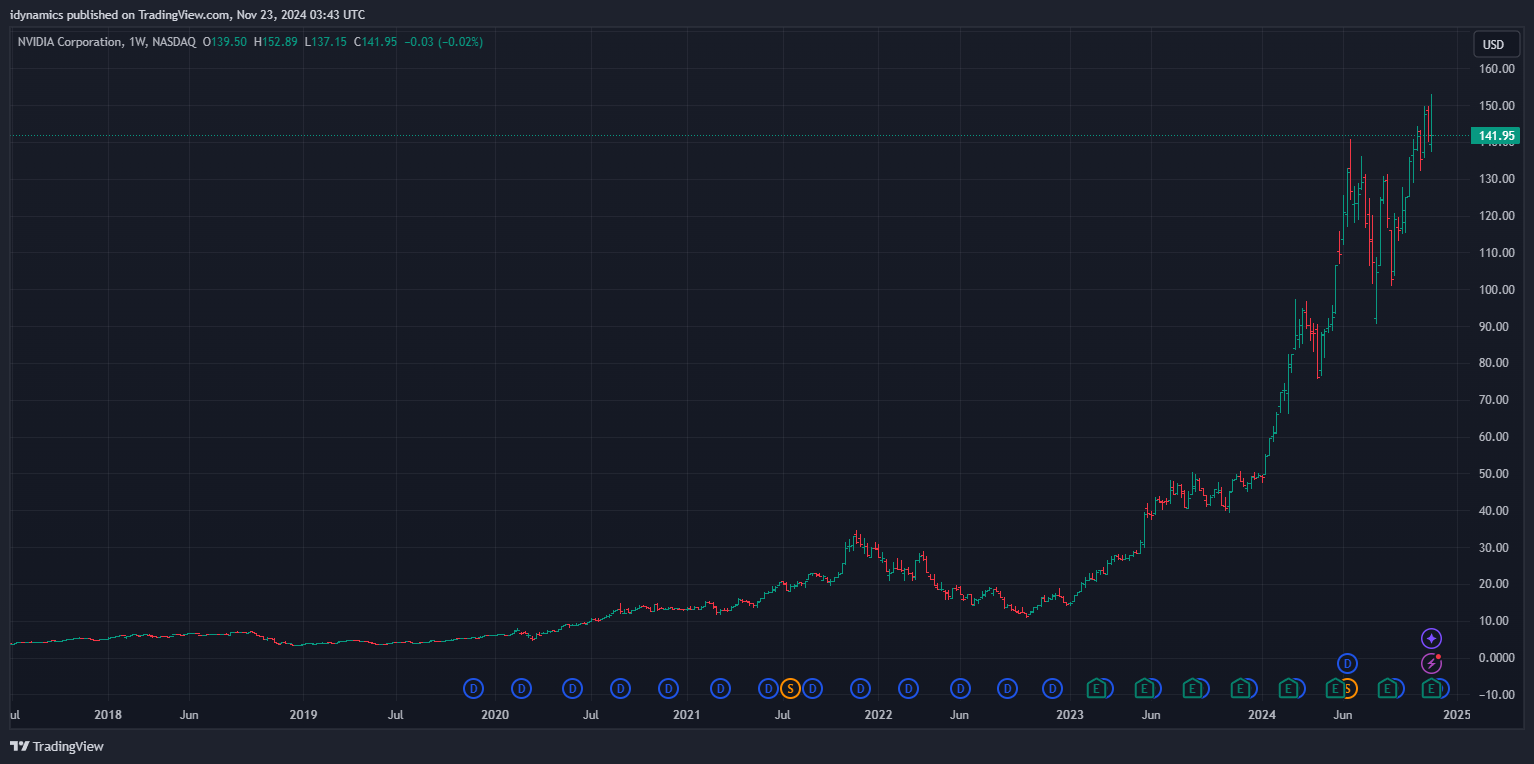
The week was dominated by NVDA earnings, particularly as NVDA is now part of the Dow. NVDA set record highs mid-week, taking out a trendline, but fell back late to close basically unchanged on an outside week, in the lower end of the weekly range. The weekly is overbought with a large wedge forming.
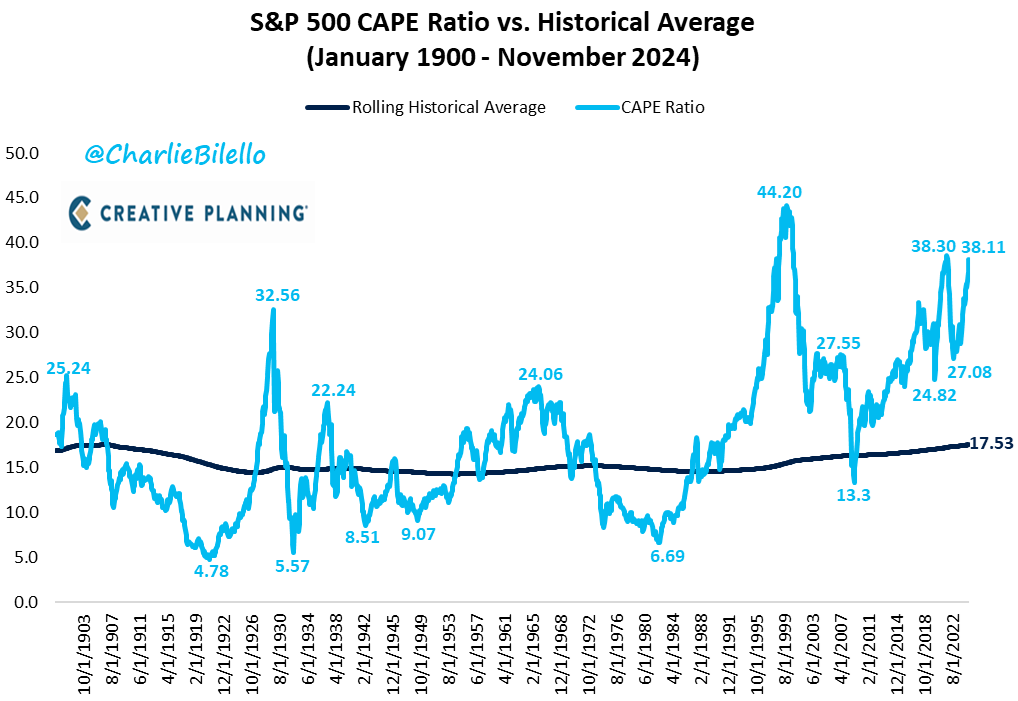
The CAPE ratio is touching levels seen at the late 2021/early 2022 highs. (Source: Bilello Blog)
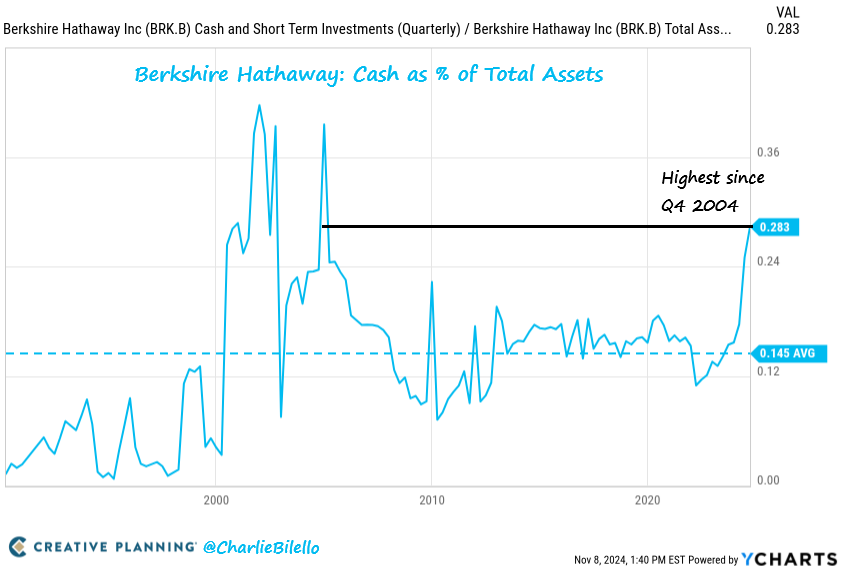
 Suddenly, all the chatter about deficits has gone out the window. Defenestrated. Apparently the Debt = Slavery argument is dead? Or, is there a reason Berkshire holds the highest cash reserves since 2004?
 The Dow closed on the top of a reversal week higher and is once again nearing the channel line from the 2019 tops through the 2022 tops. Breadth improved on the week so that takes away one of the larger divergences with the latest surge. The new 52-week highs also improved, not just for blue-chips but for a large chunk of the S&P.
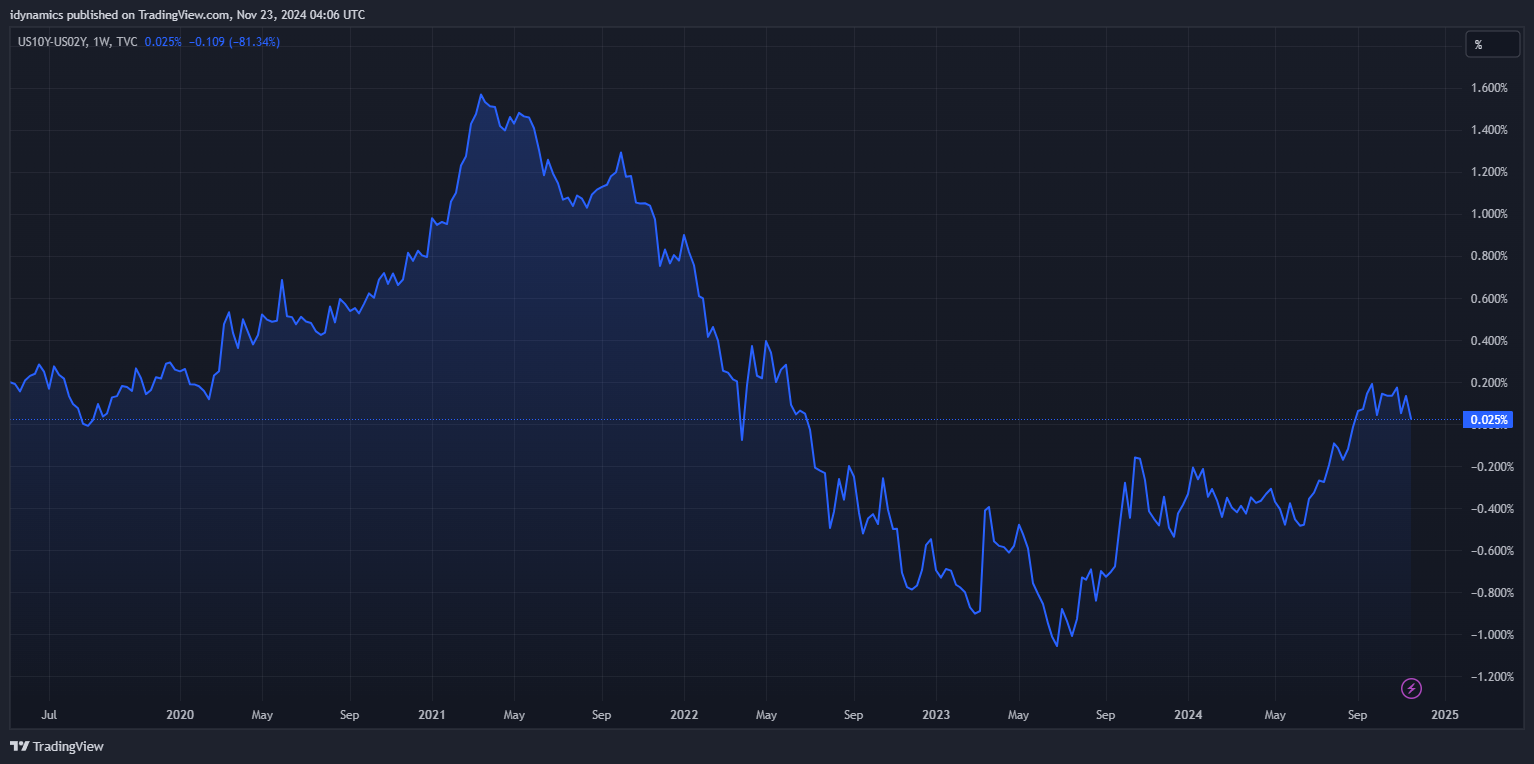
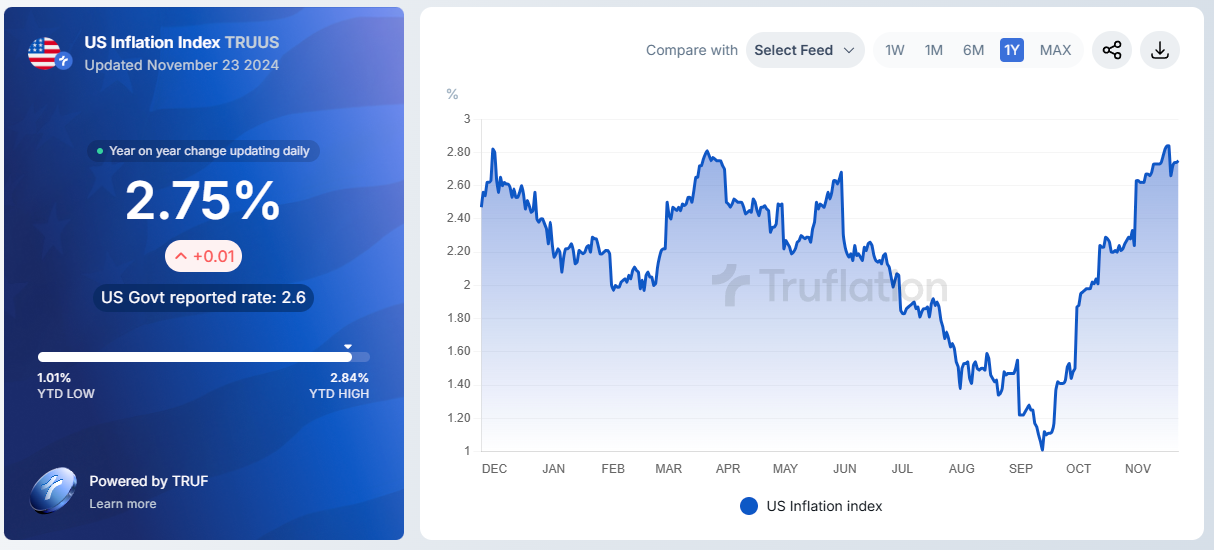
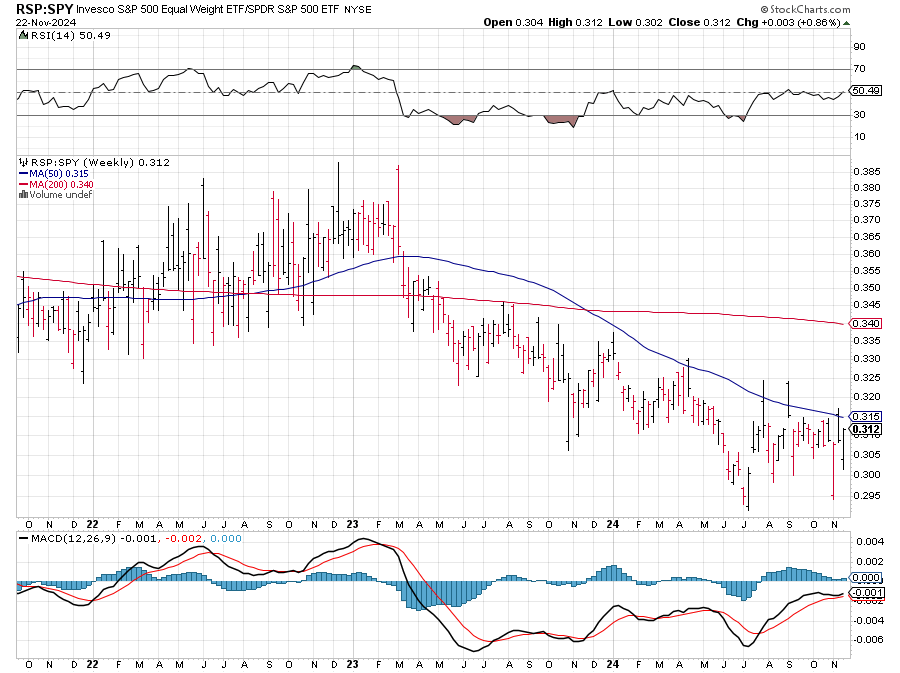
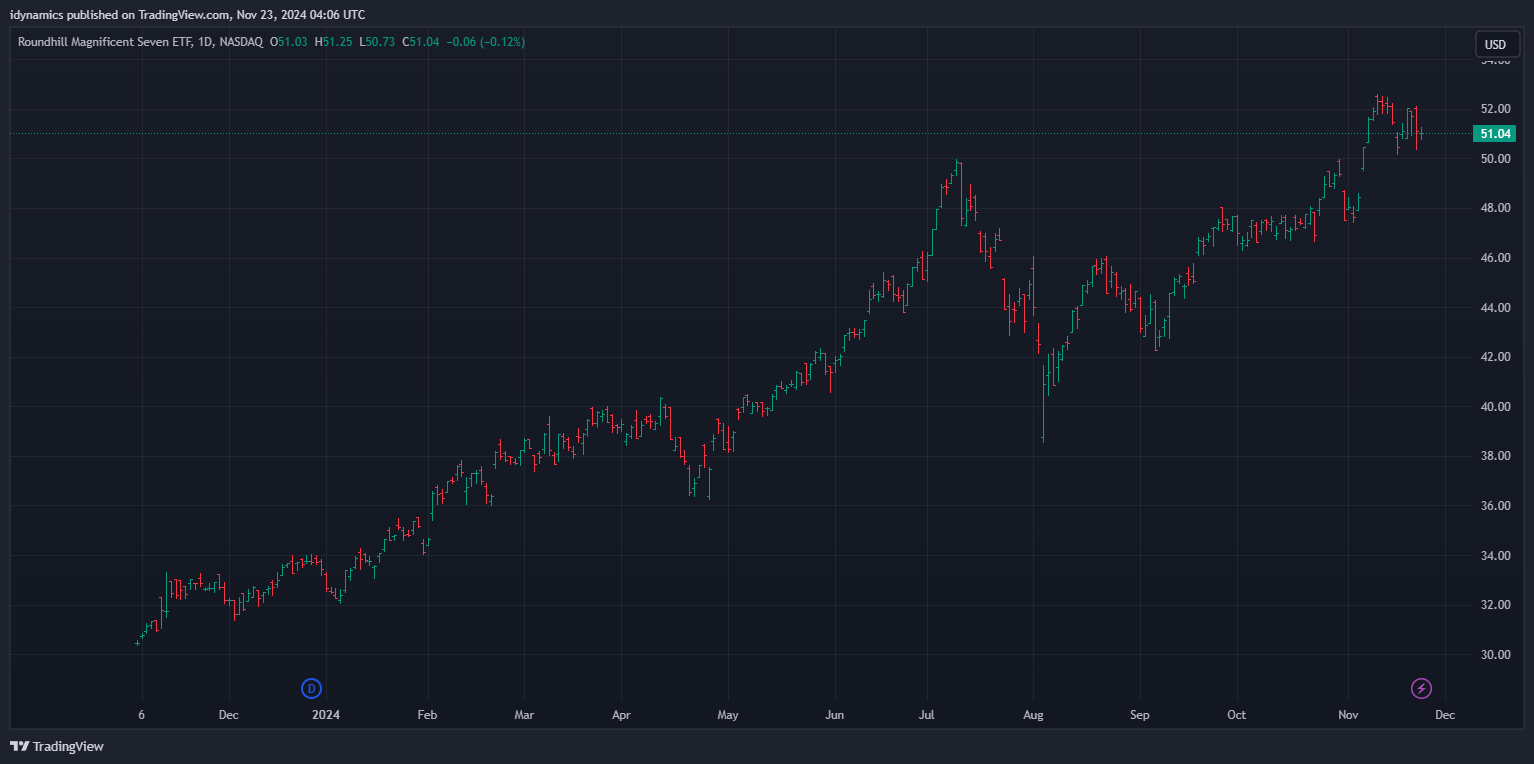
The RSP:SPY closed flat yet again on the weekly even with the surge in the IWM. The weekly is in sideways trade since August. Bonds stayed flat during the week as futures test the lowest levels since July. The MAG7 traded an inside range on the week. McClellan Oscillators are validating the action. Sentiment remains mixed with some indicators (the diverging ones) showing extreme fear. The 10YR-2YR Yield Curve remains slightly in positive territory. Truflation continues to settle toward the 2024 summer tops.
10YR-2YR Yield Curve Weekly
 VIX Weekly H-L-C
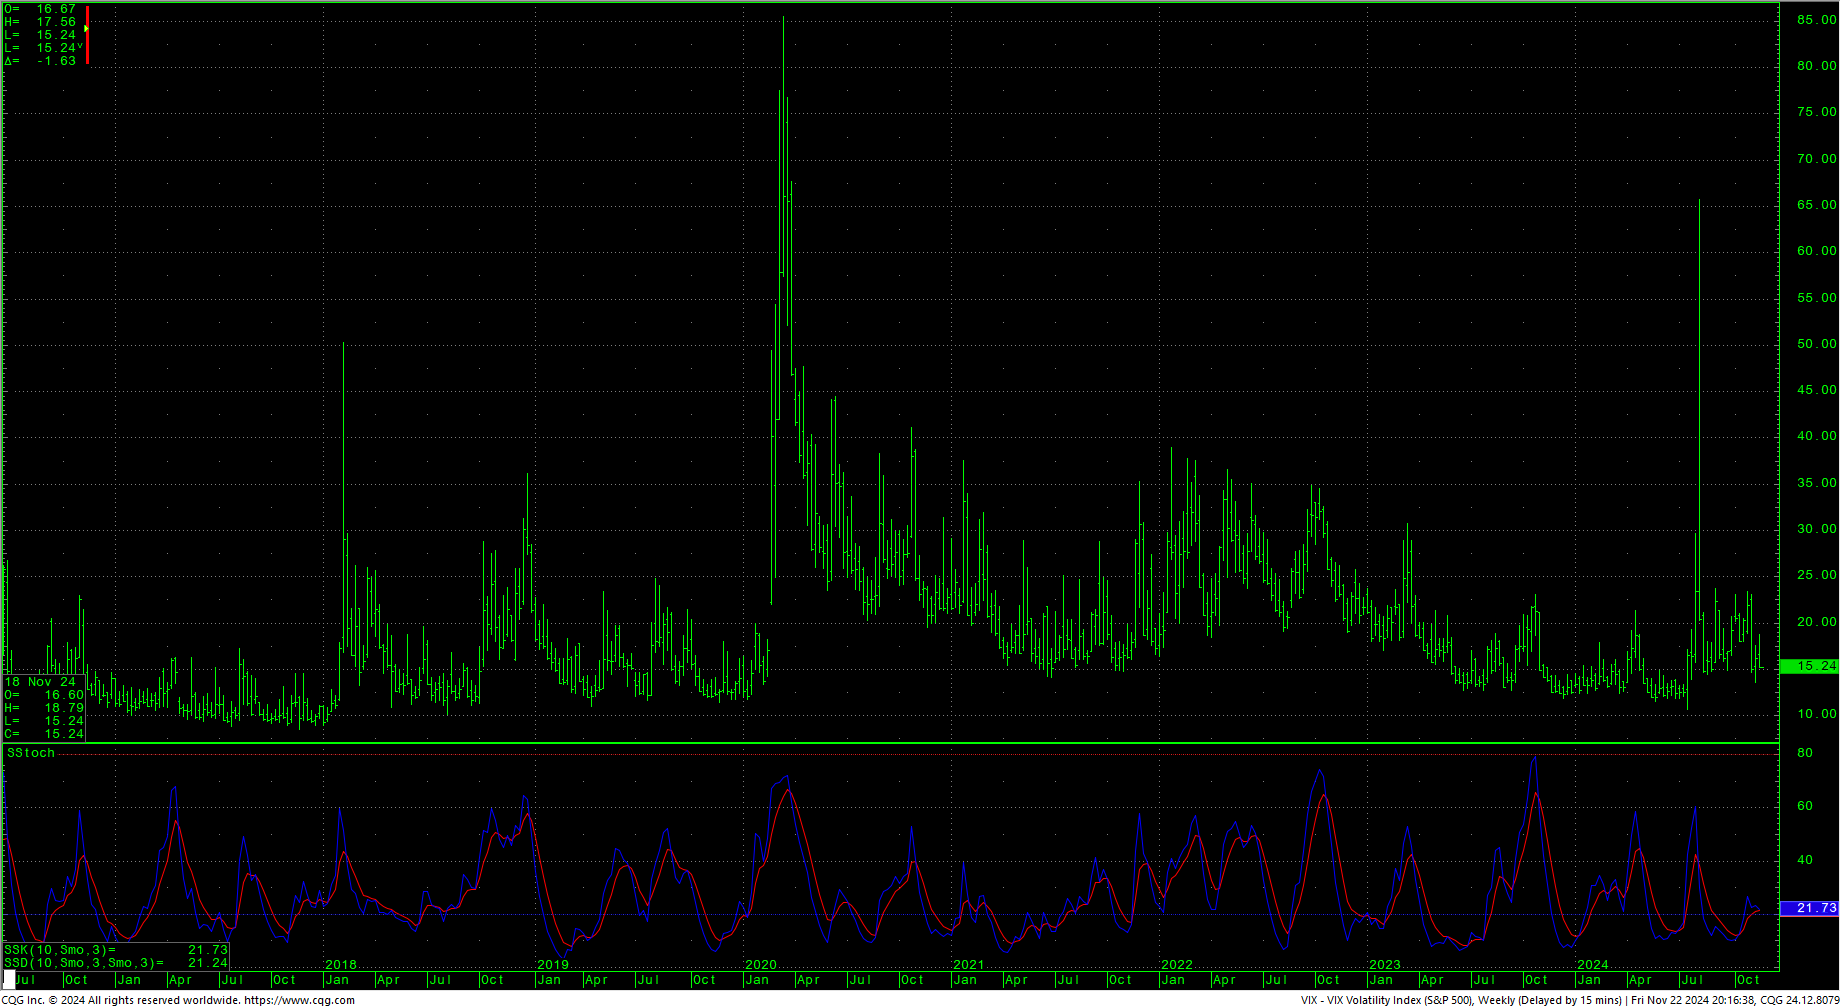
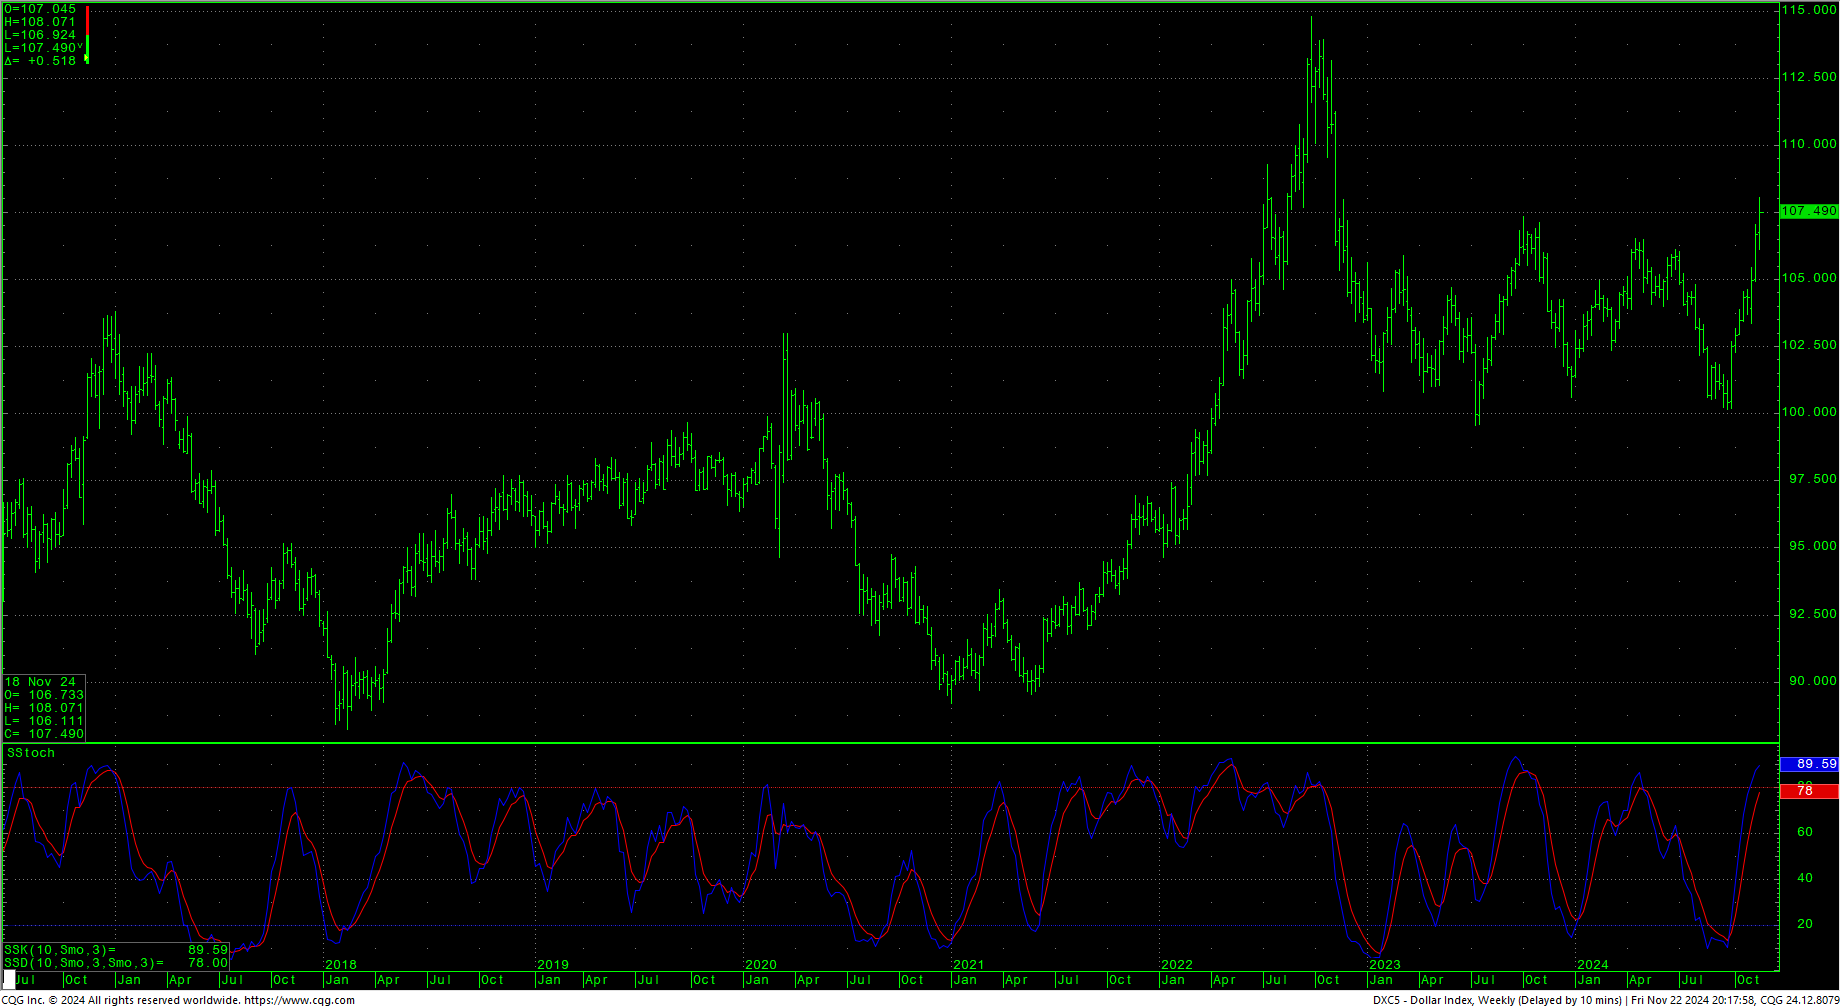
The VIX dropped with the late week rally and closed on the bottom of the range. The US Dollar rallied to two-year highs with Friday’s close the highest daily close since 21 November 2022.
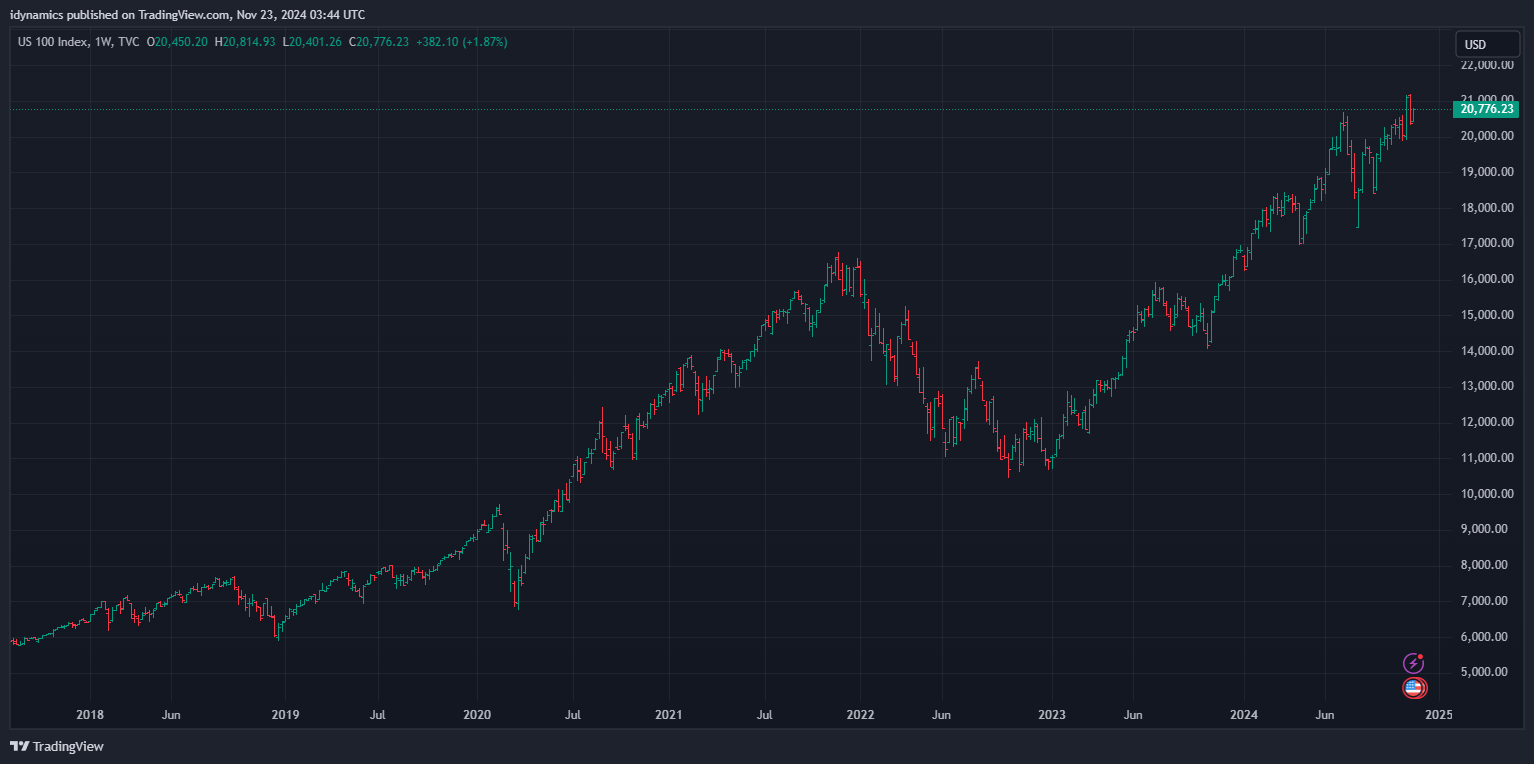
 Nasdaq 100 Weekly H-L-C
 52-Week A/D Line
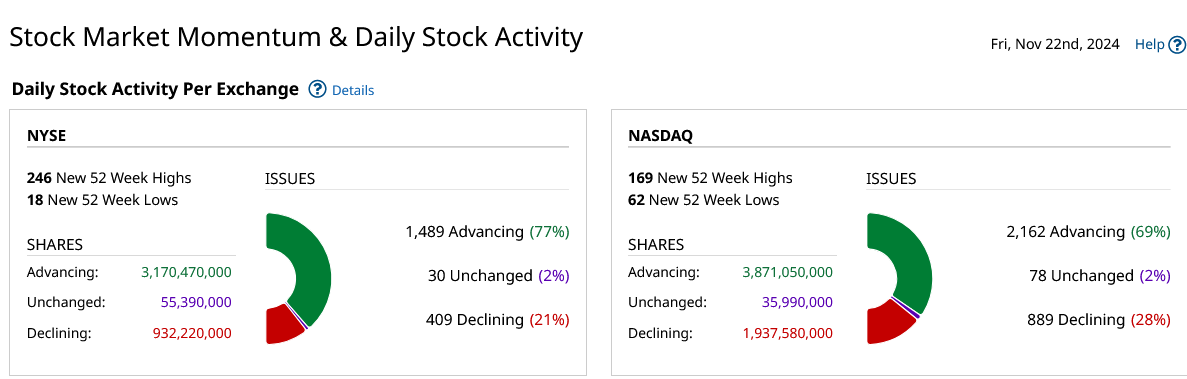
Breadth improved sharply in light trading, reversing the recent weakness but represents extreme fear.
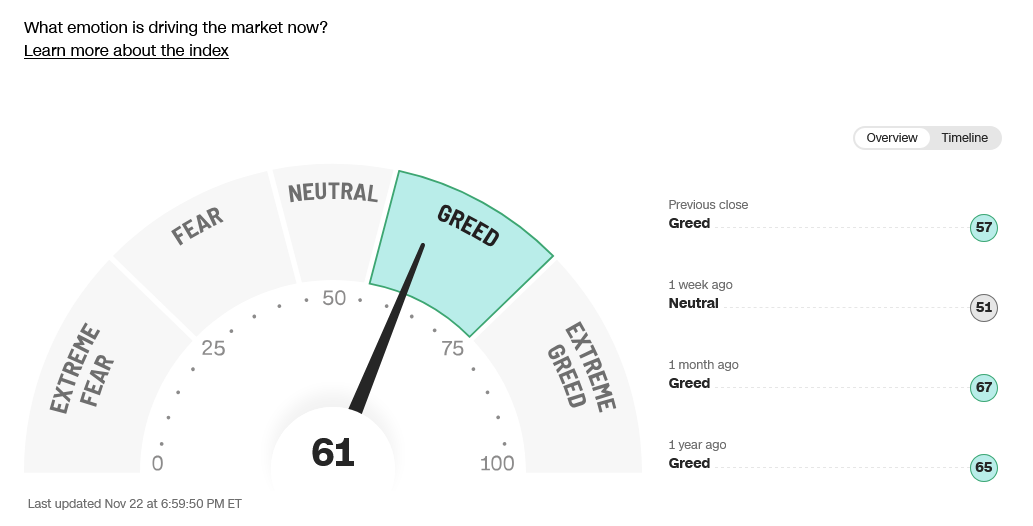
CNN Fear & Greed Index
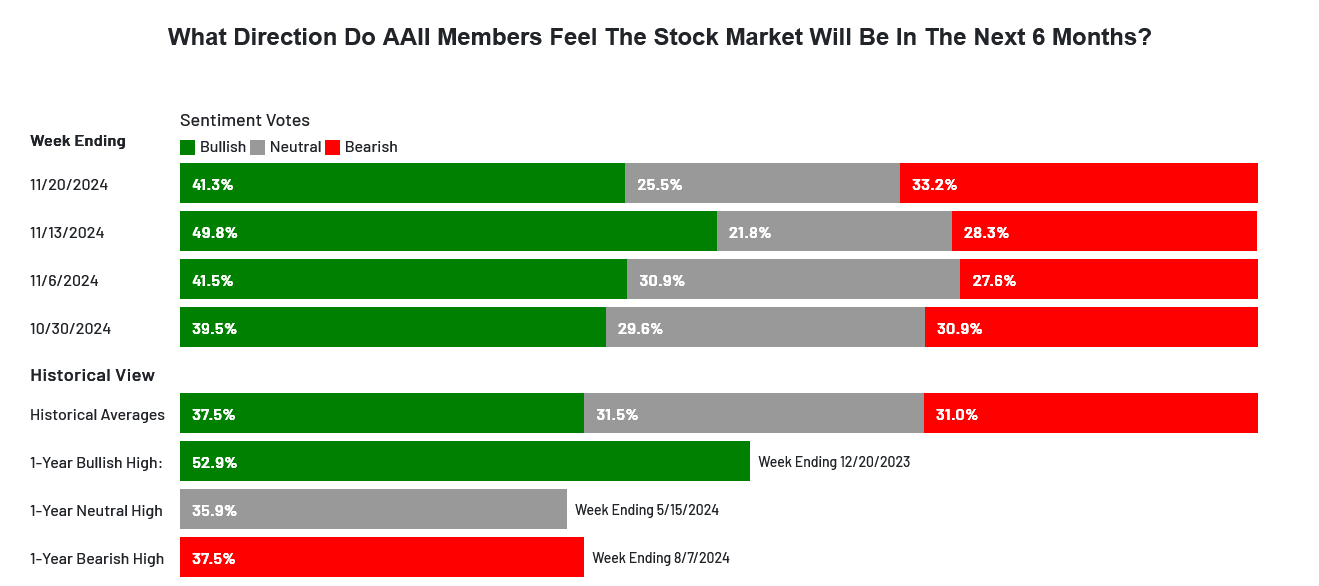
 AAII Investor Sentiment Survey


