TECHNICAL ANALYSIS (by Intraday Dynamics) This week’s post is free to all readers!
Merry Christmas! Have a Great Holiday!
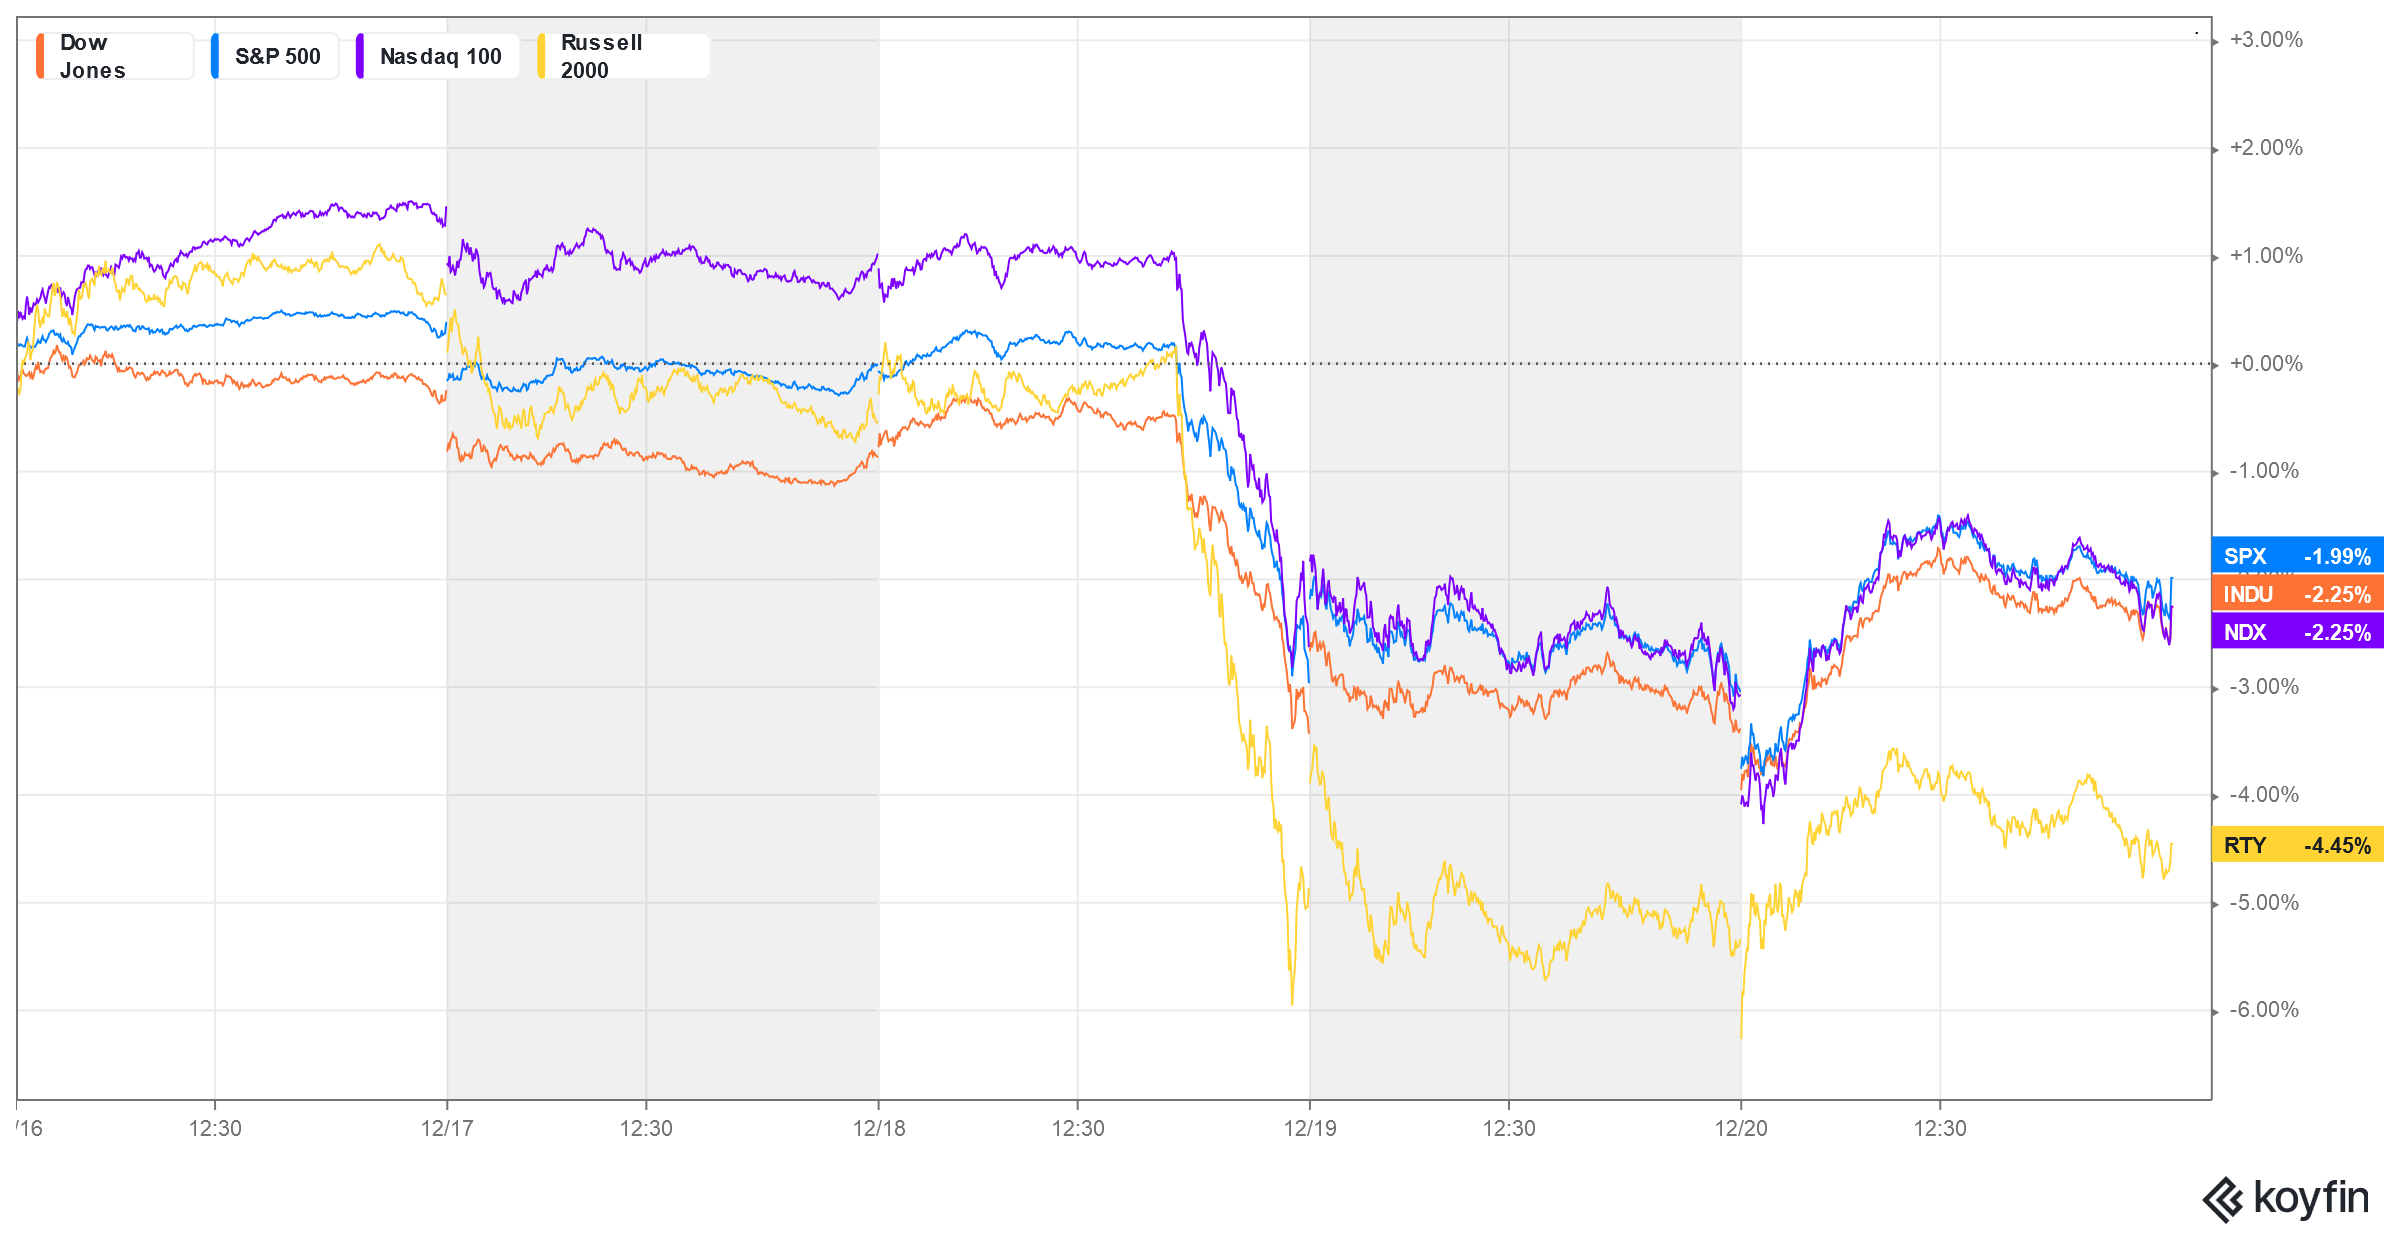
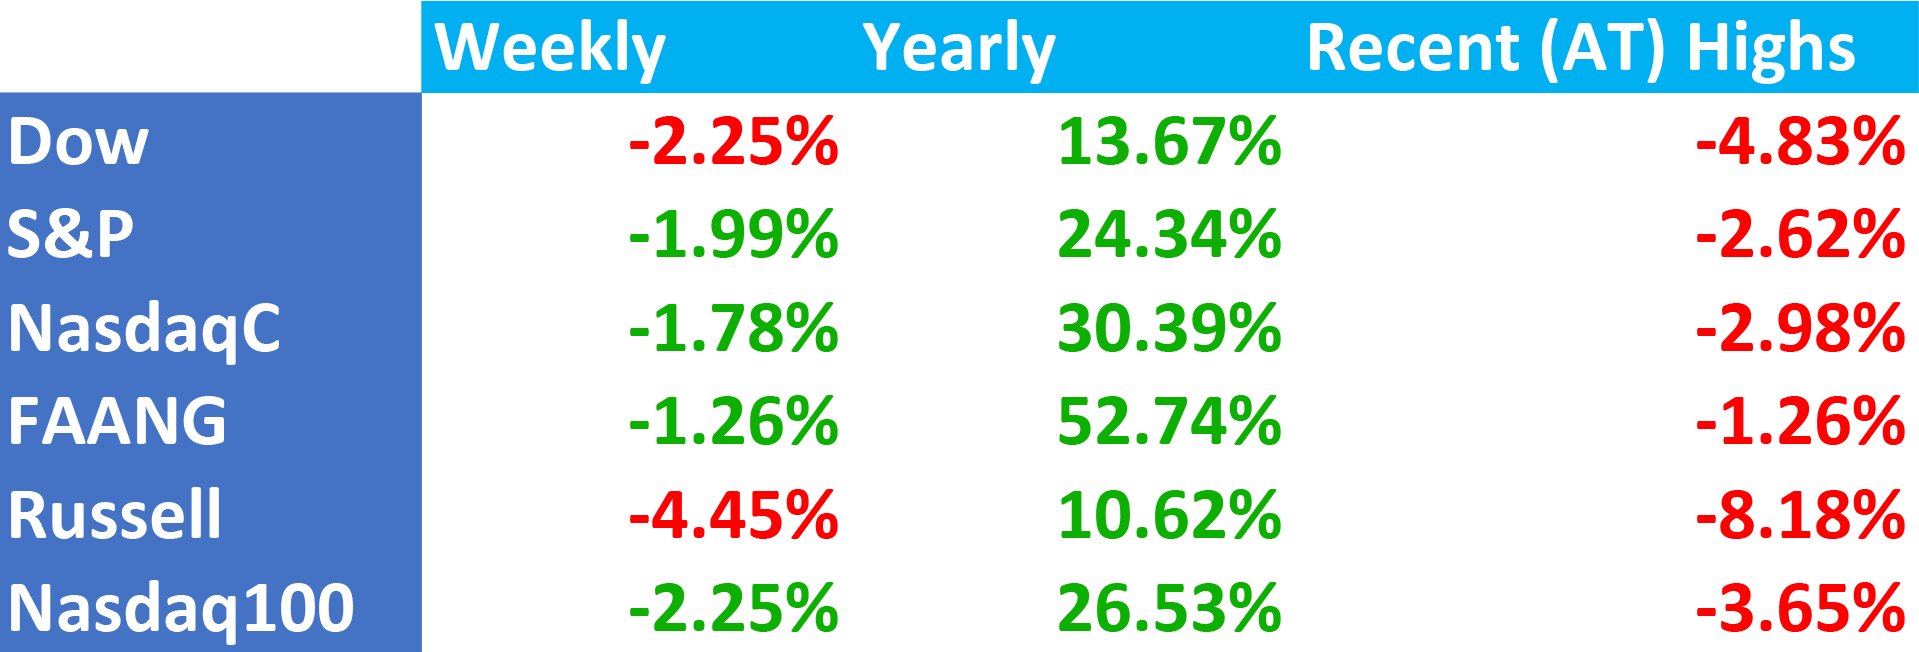
 Major Indices Week of December 20, 2024
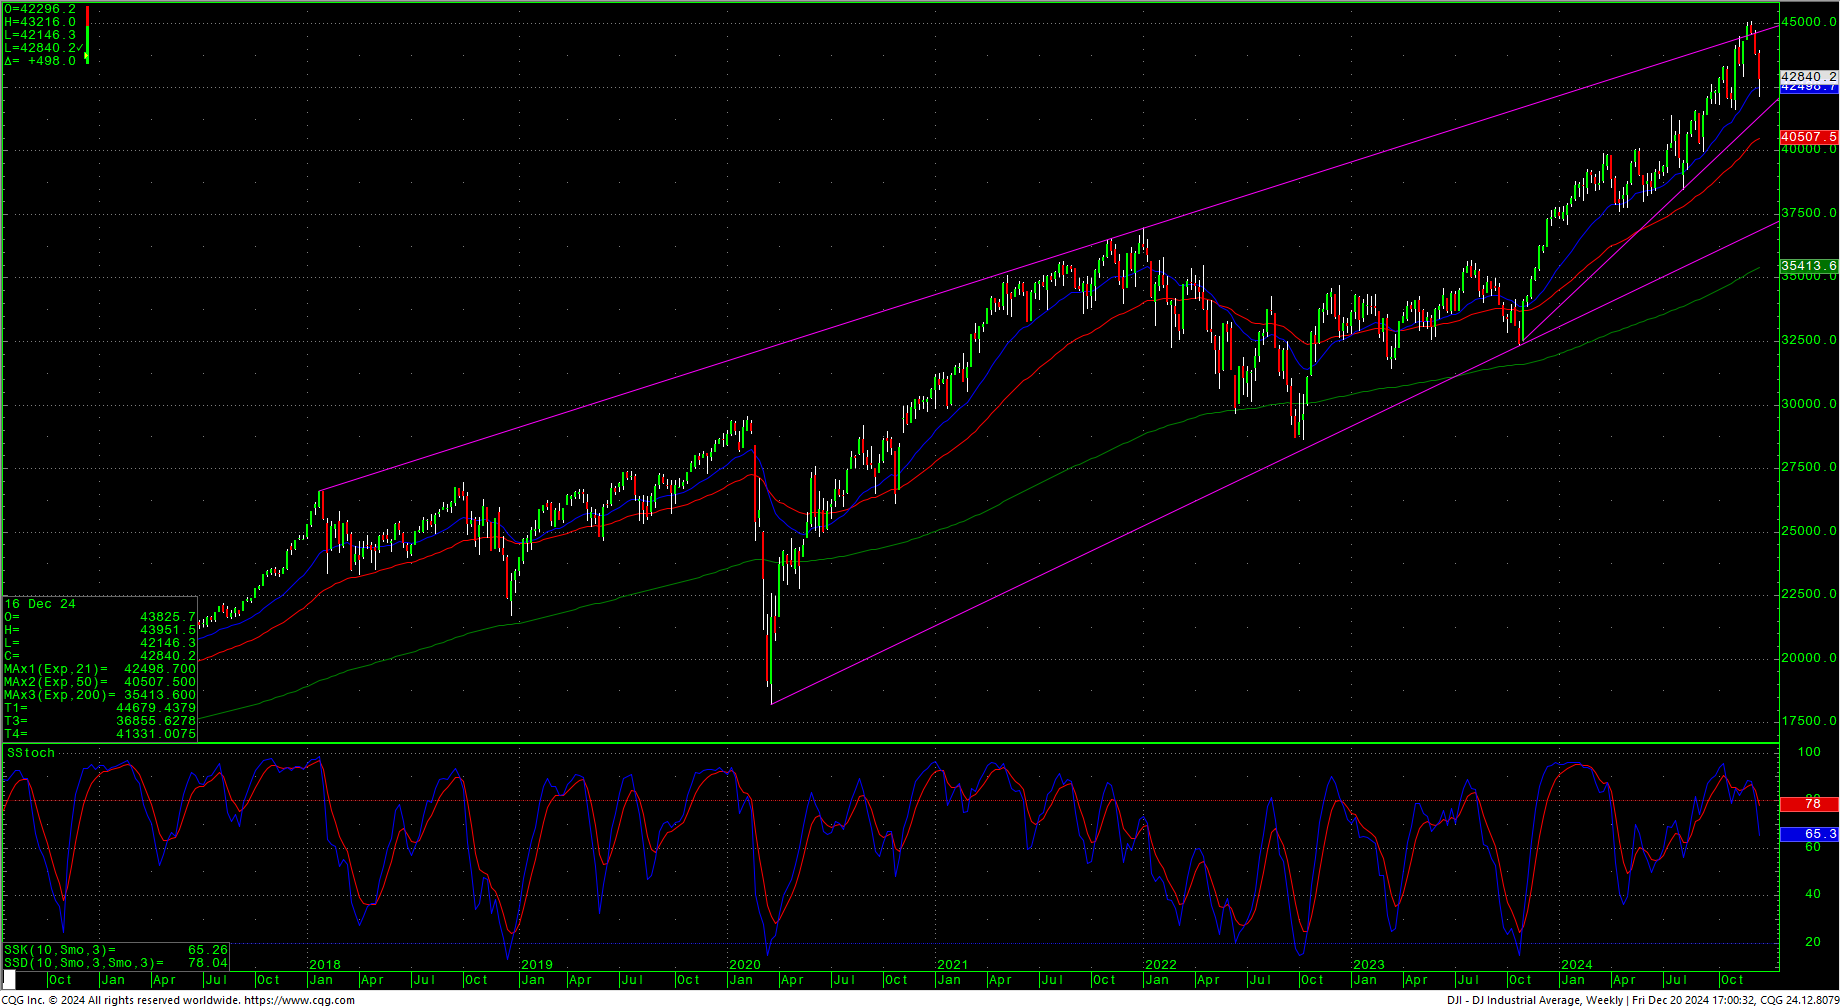
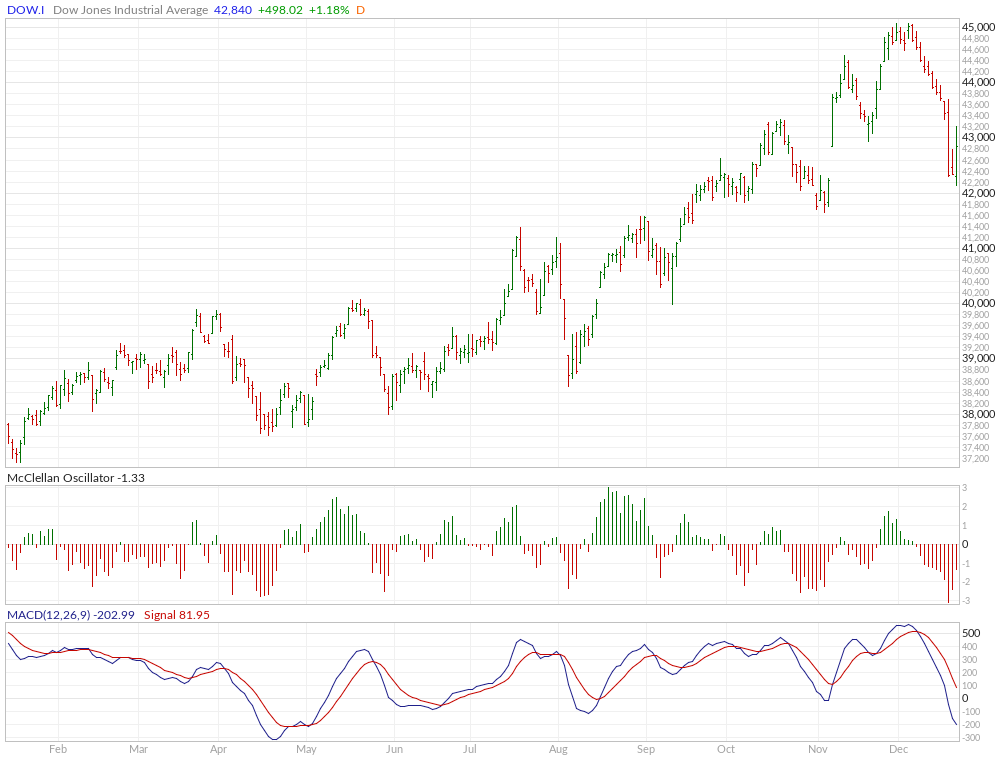
 Dow Jones Industrial Average Weekly Candles
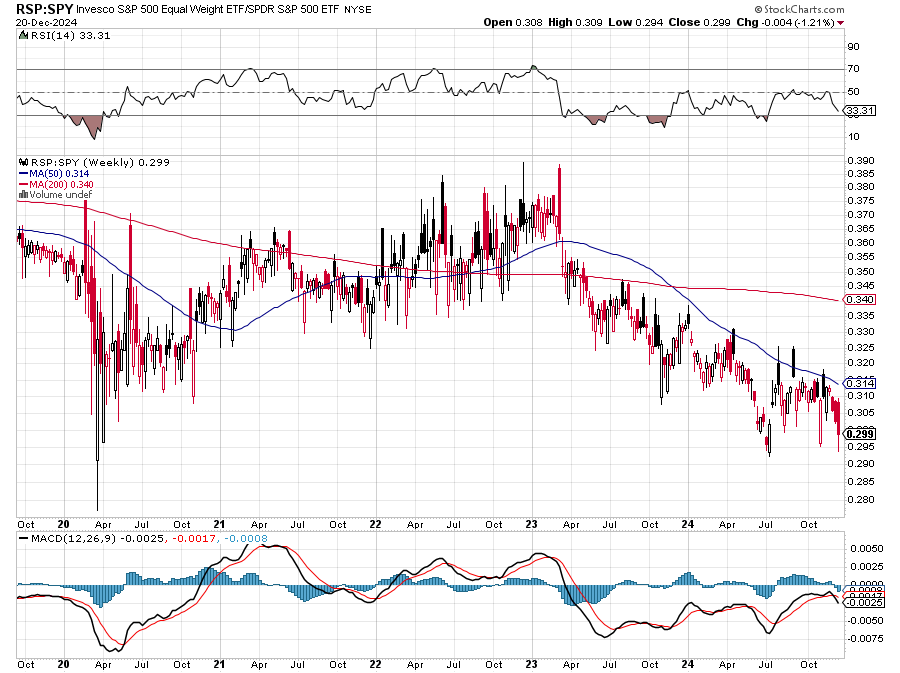
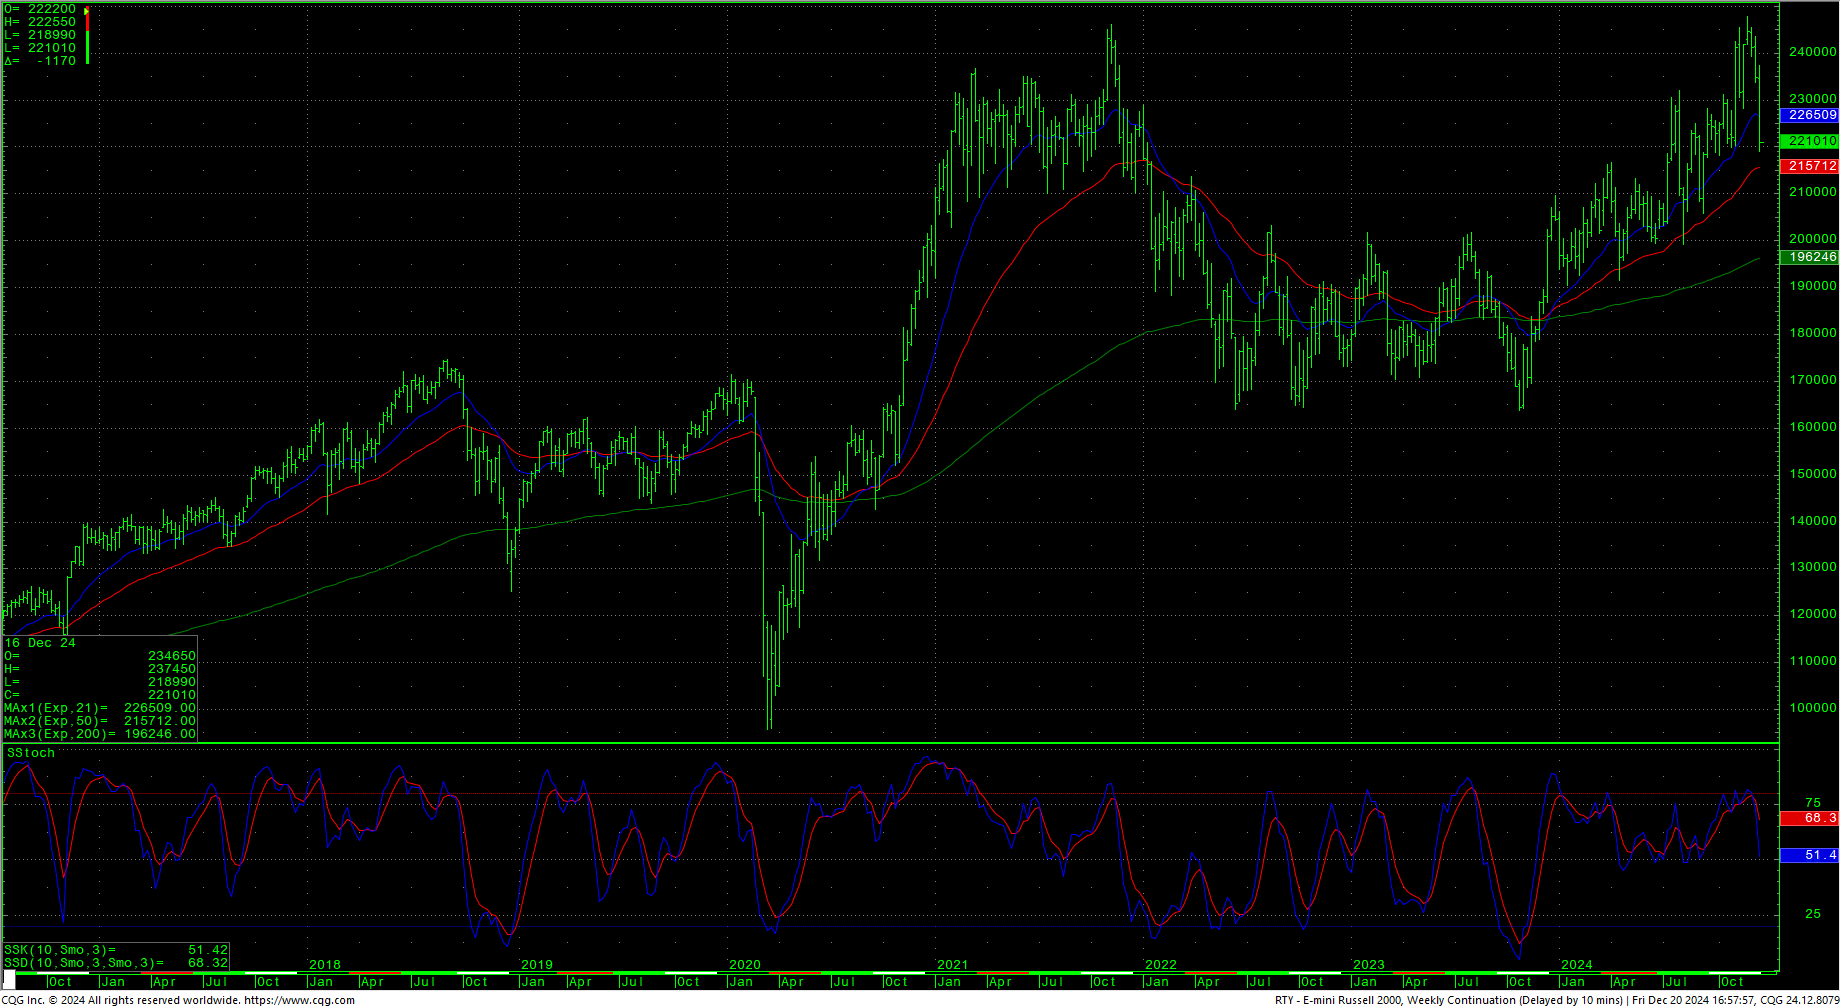
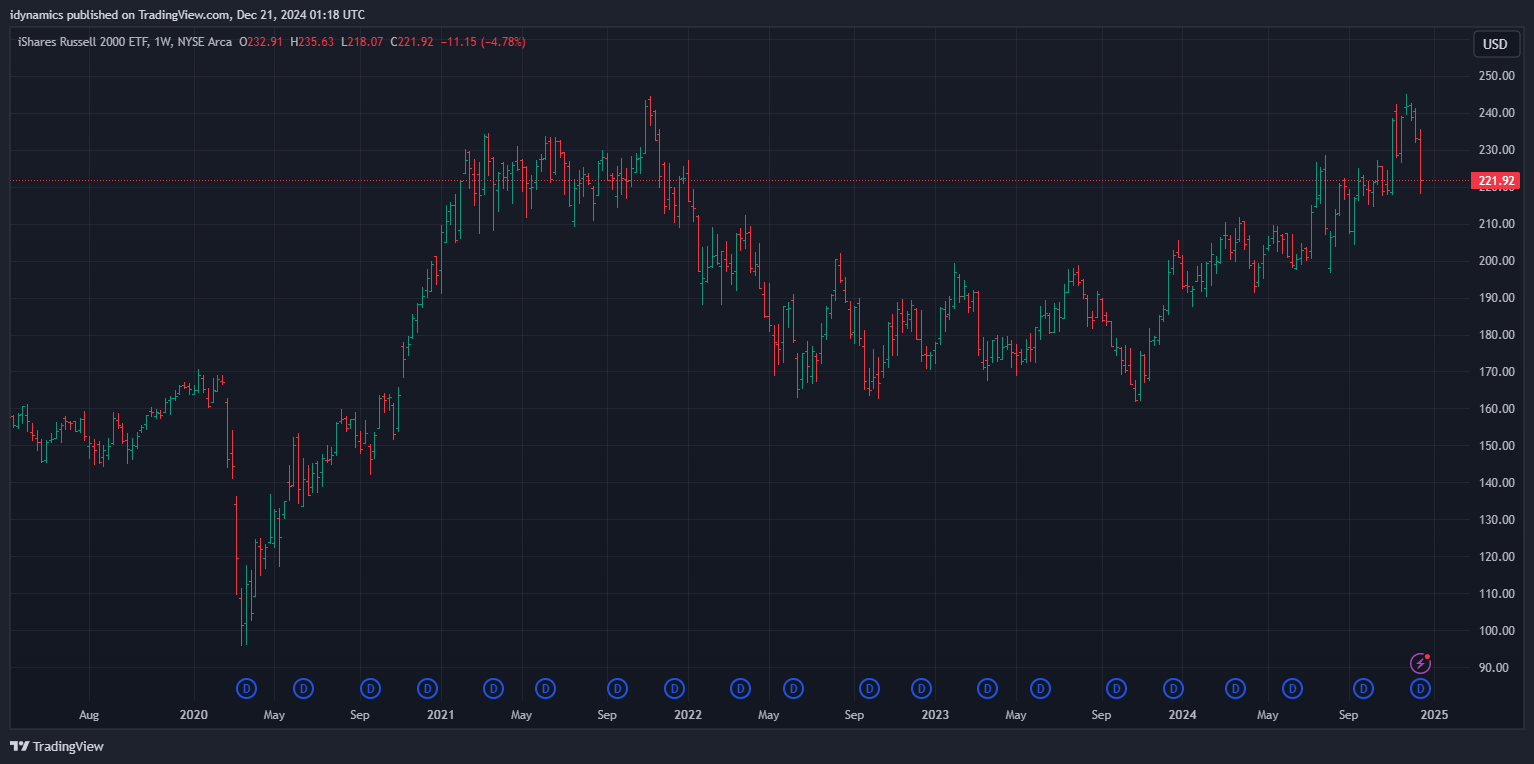
 Stocks traded a wild week with severe declines mid-week across the board. The secondary market is taking it the worst as the RSP:SPY has moved back toward the recent multiyear lows. Volume wasn’t off the charts with the Dow plunging 1123 points on Wednesday, but the trade looks impulsive (meaning it may be signaling a trend change). Note that the closing high in the Dow fell on 4 December 2024 with the highs being set in the critical timing window we defined in the last update for the 5th/6th, where there was a strong potential for a turning point. Friday saw prices plunge early as the Dow filled in the gap left on 6 November 2024, wiping out the entire post-election rally before reversing, while the S&P dipped into the corresponding gap before reversing. The action Friday relieved some deeply oversold short-term conditions. The Russell has plunged over -8% from the closing highs and tested the November trading lows before recovering in Friday’s post PCE rally.
The Dow daily is oversold and Friday it achieved the first bullish candle after 11 straight bearish candles from the critical cycle timing highs. Wednesday’s large plunge marked a 10th day down, the first time since 1974 since that has happened technically. Price and time are now decidedly bearish for the Dow chart and the trading low set intraday Friday at 42146.3 is pivotal. With the daily oversold, can a case be built for the gap now filled to see a resurgence for prices? It is possible, but substantial recovery will be needed short-term. Prices are back under the upper trendline on the weekly, where they spent two weeks above and the weekly is rolling over on the stochastics with a bearish divergence.
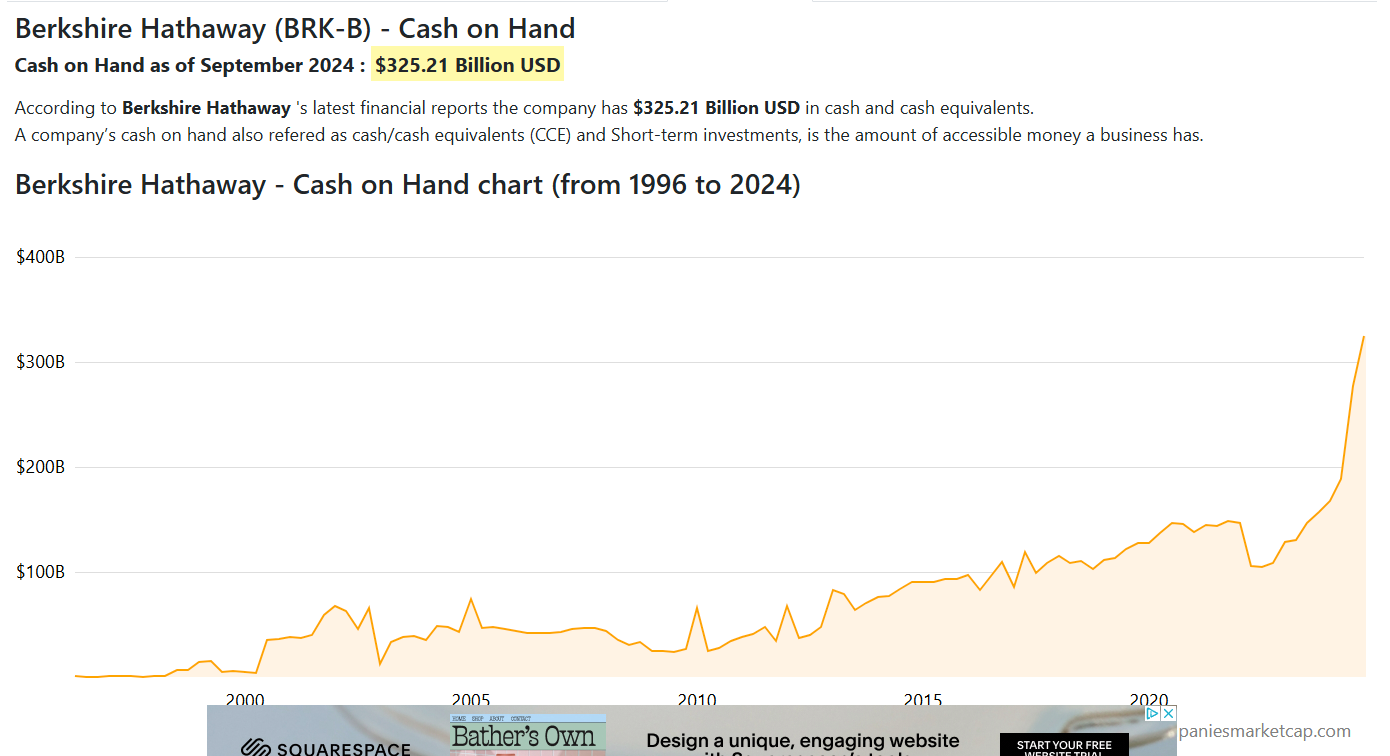
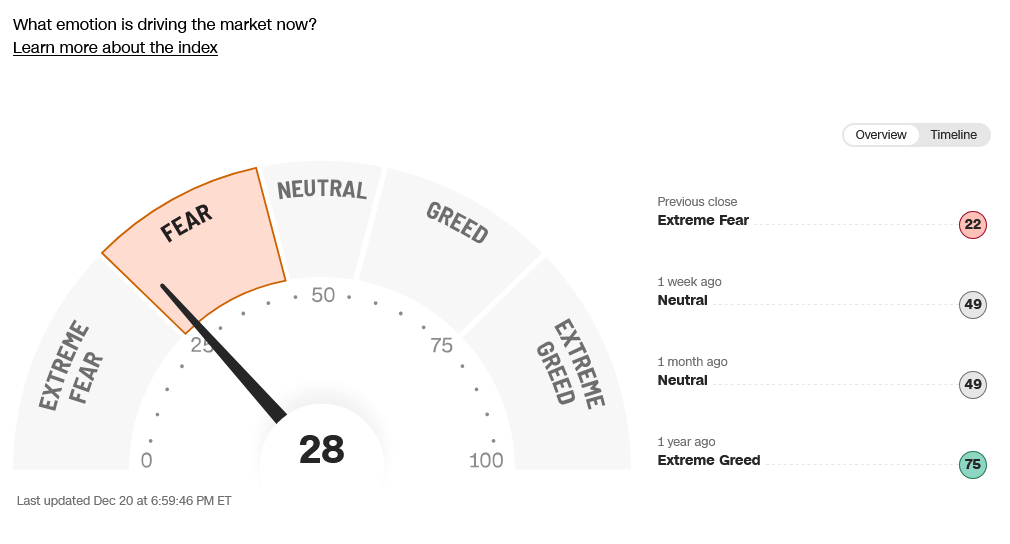
Sentiment has shifted to fear with the break and breadth really collapsed with the crash in the IWM/RSP markets. While fear is showing up, there are any number of troubling indicators including the reality that Berkshire has moved to such high cash levels.
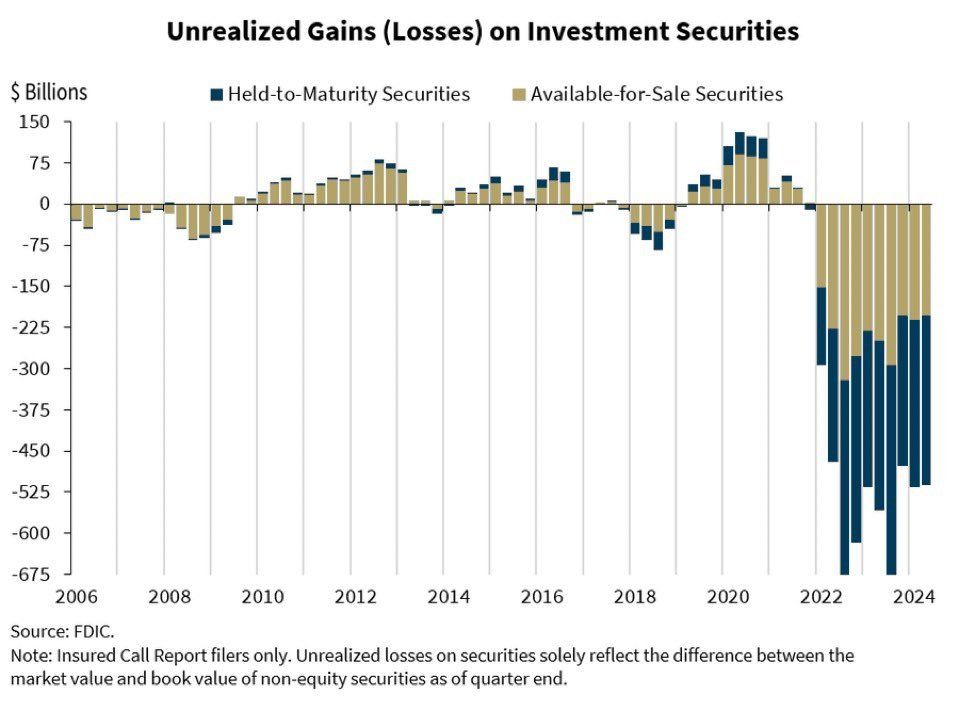
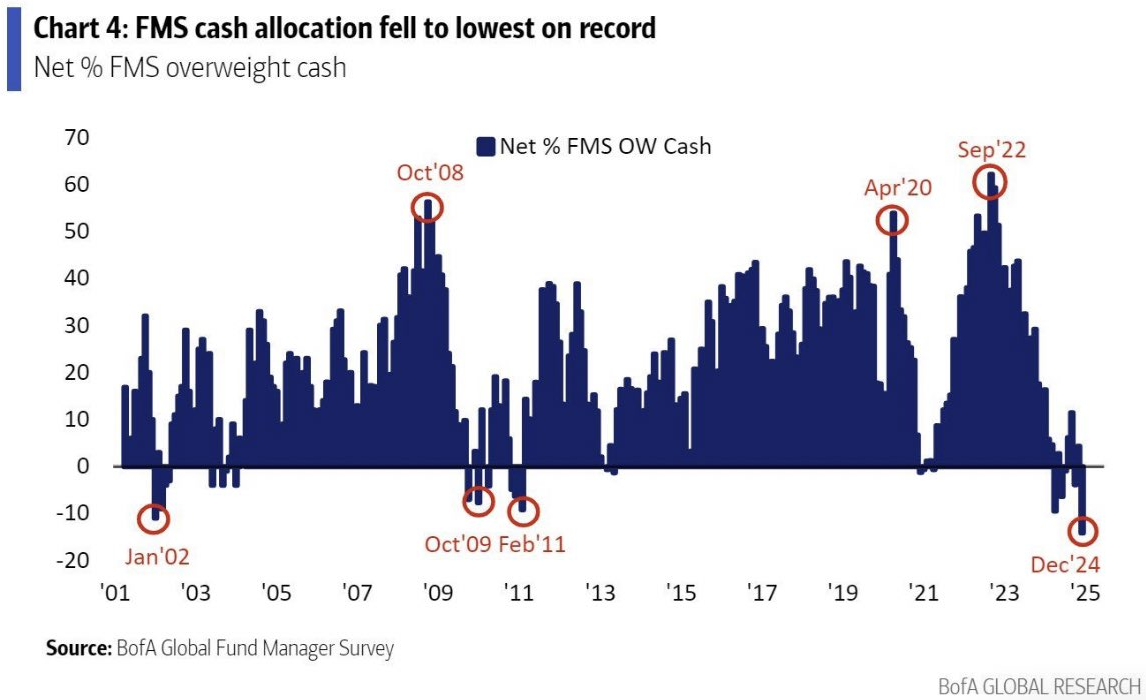
 At the same time, banks (which are holding large amounts of toxic debt) have reached extremely low levels of cash.
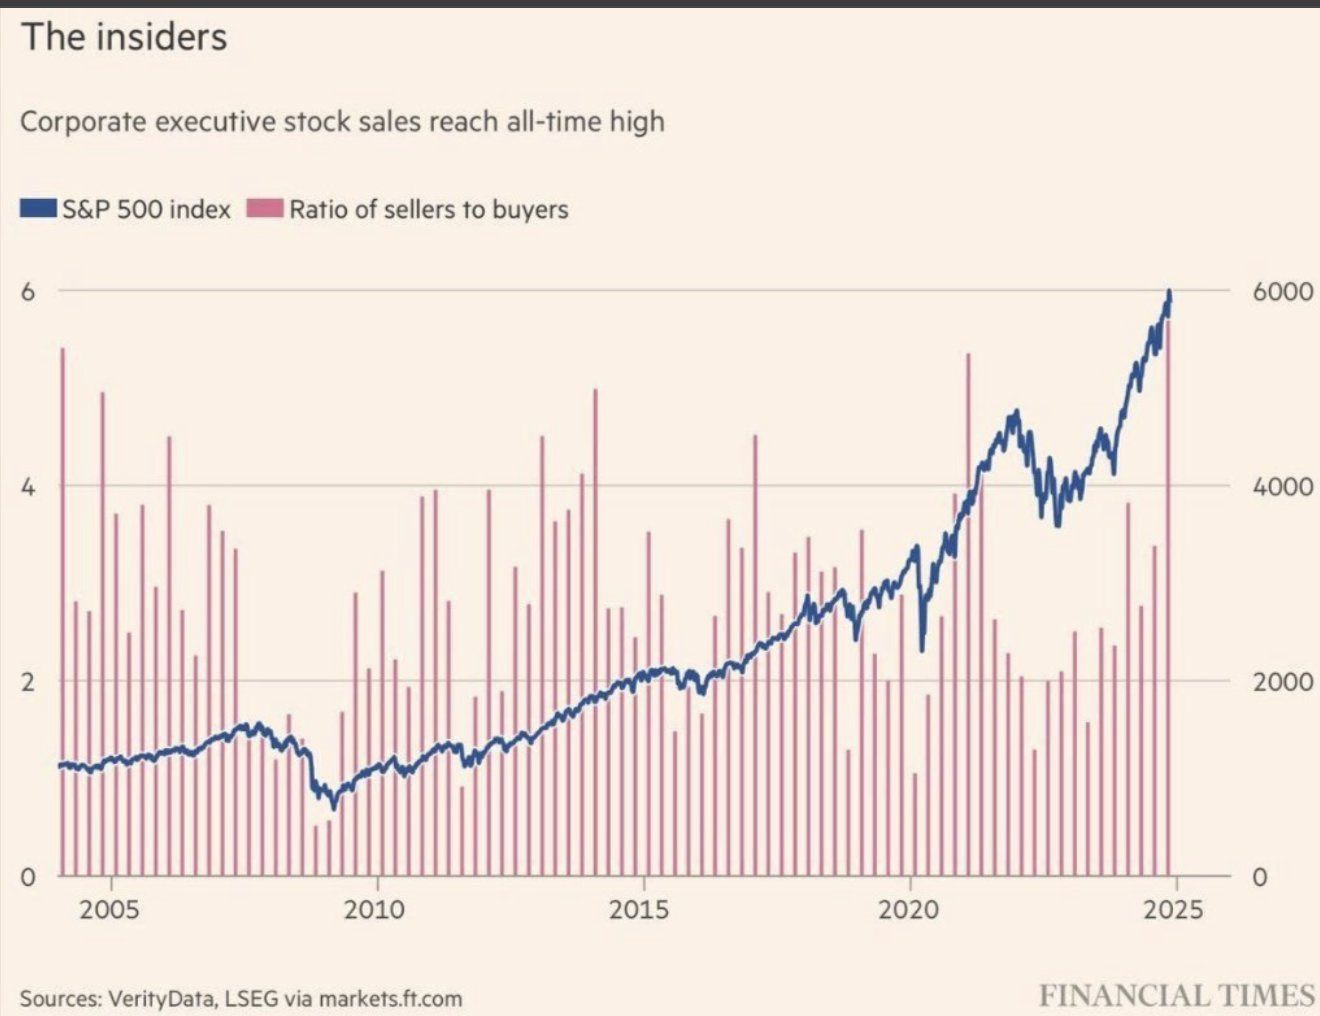
 Also, insiders have been liquidating on the last surge.
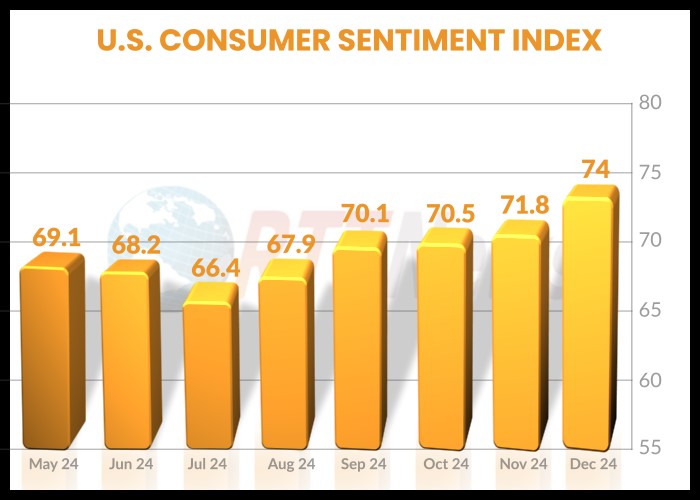
 Not only did Consumer Sentiment jump to an eight-month high, investor sentiment is now the highest in history.
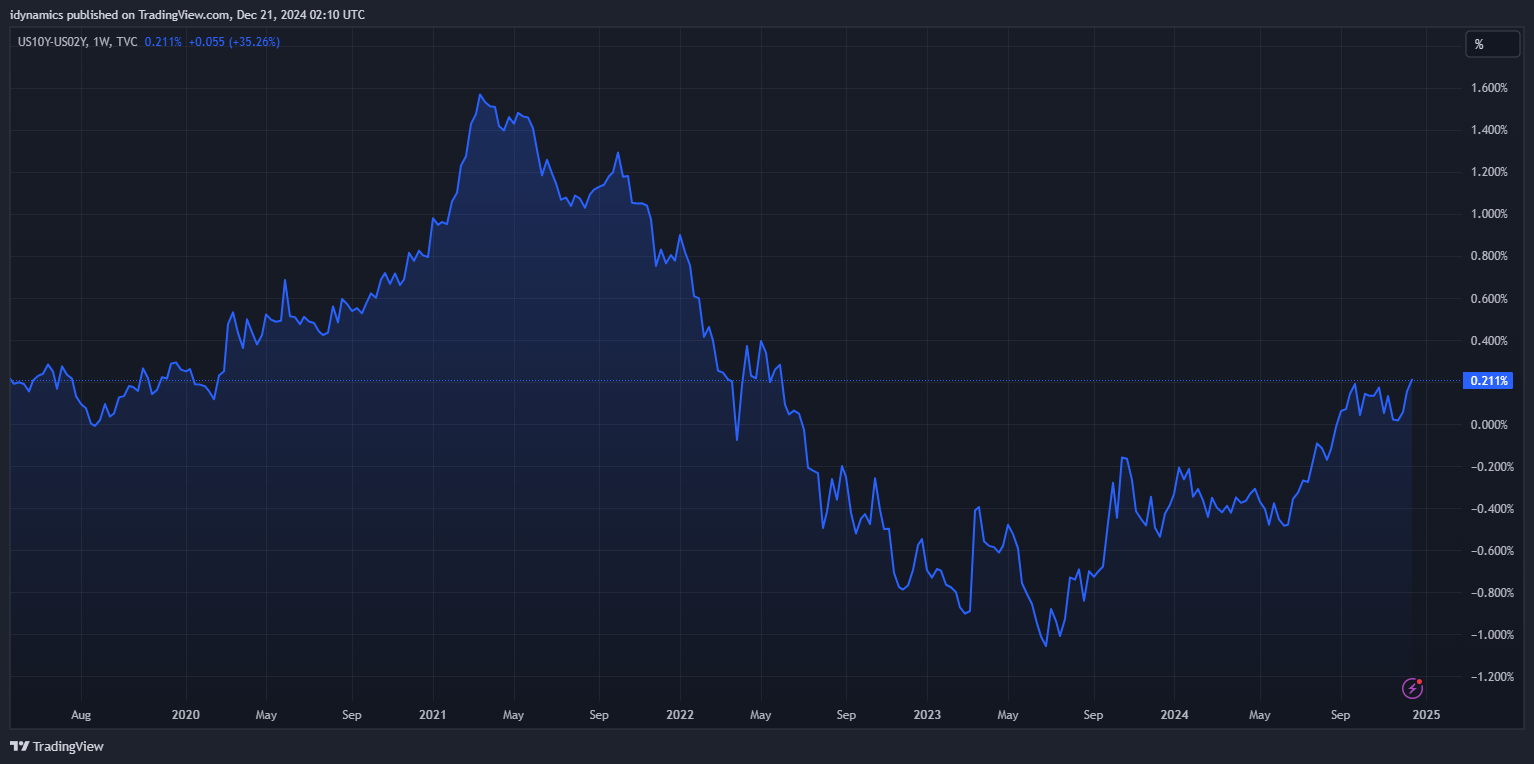
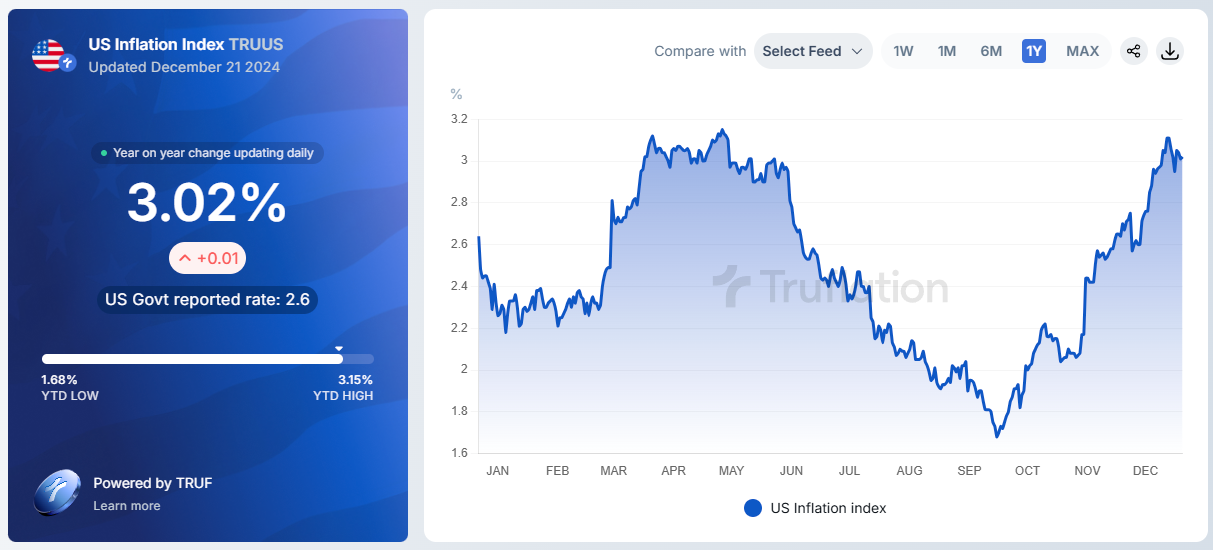
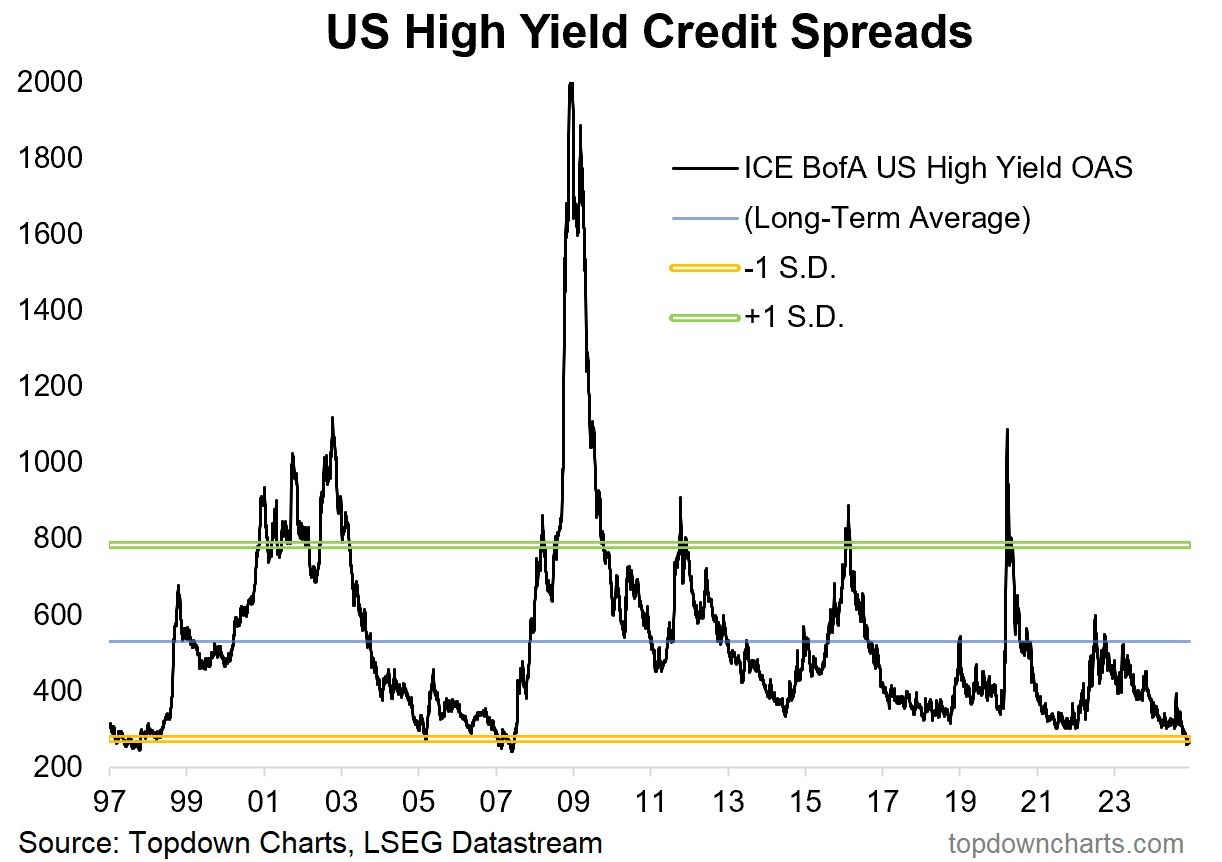
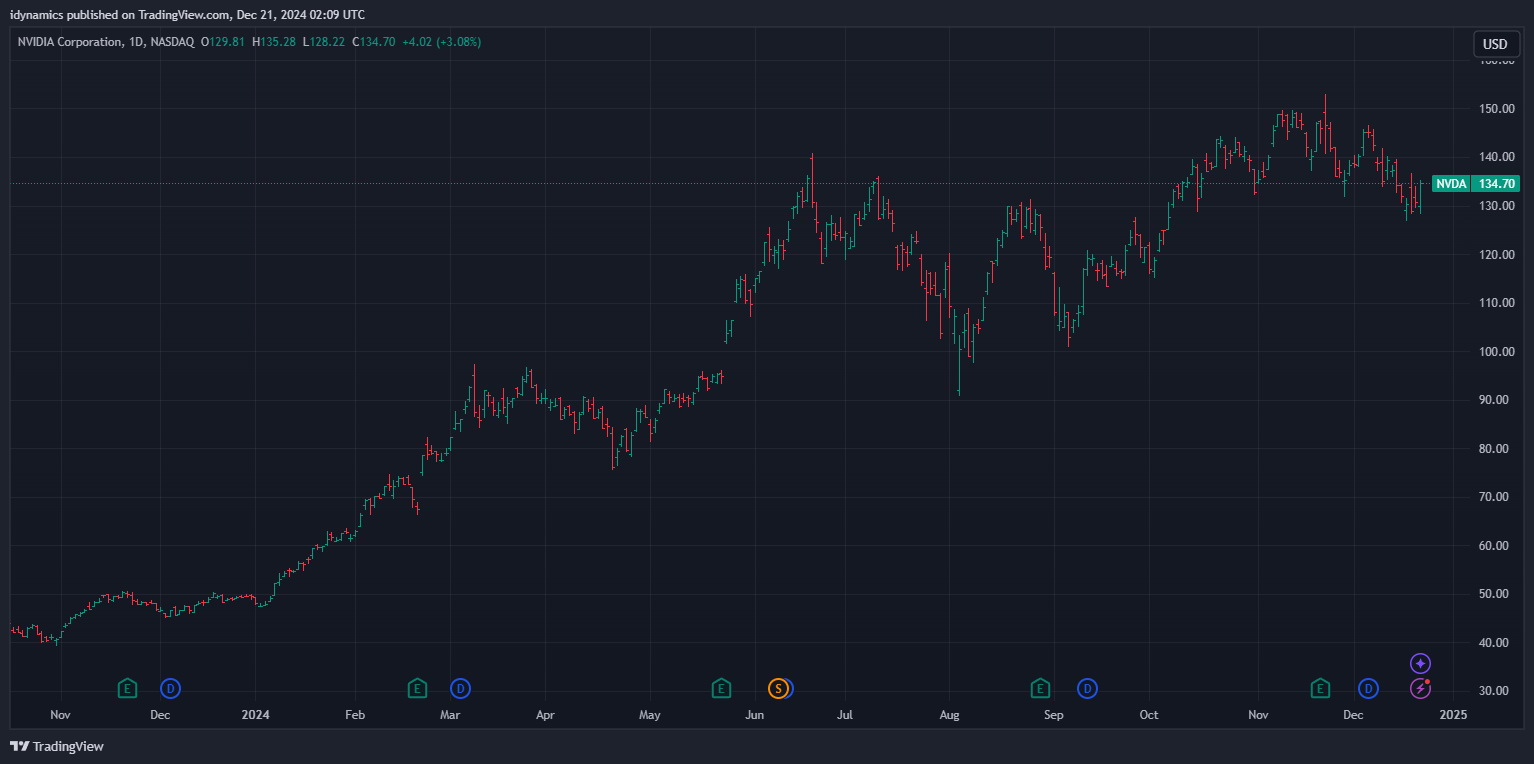
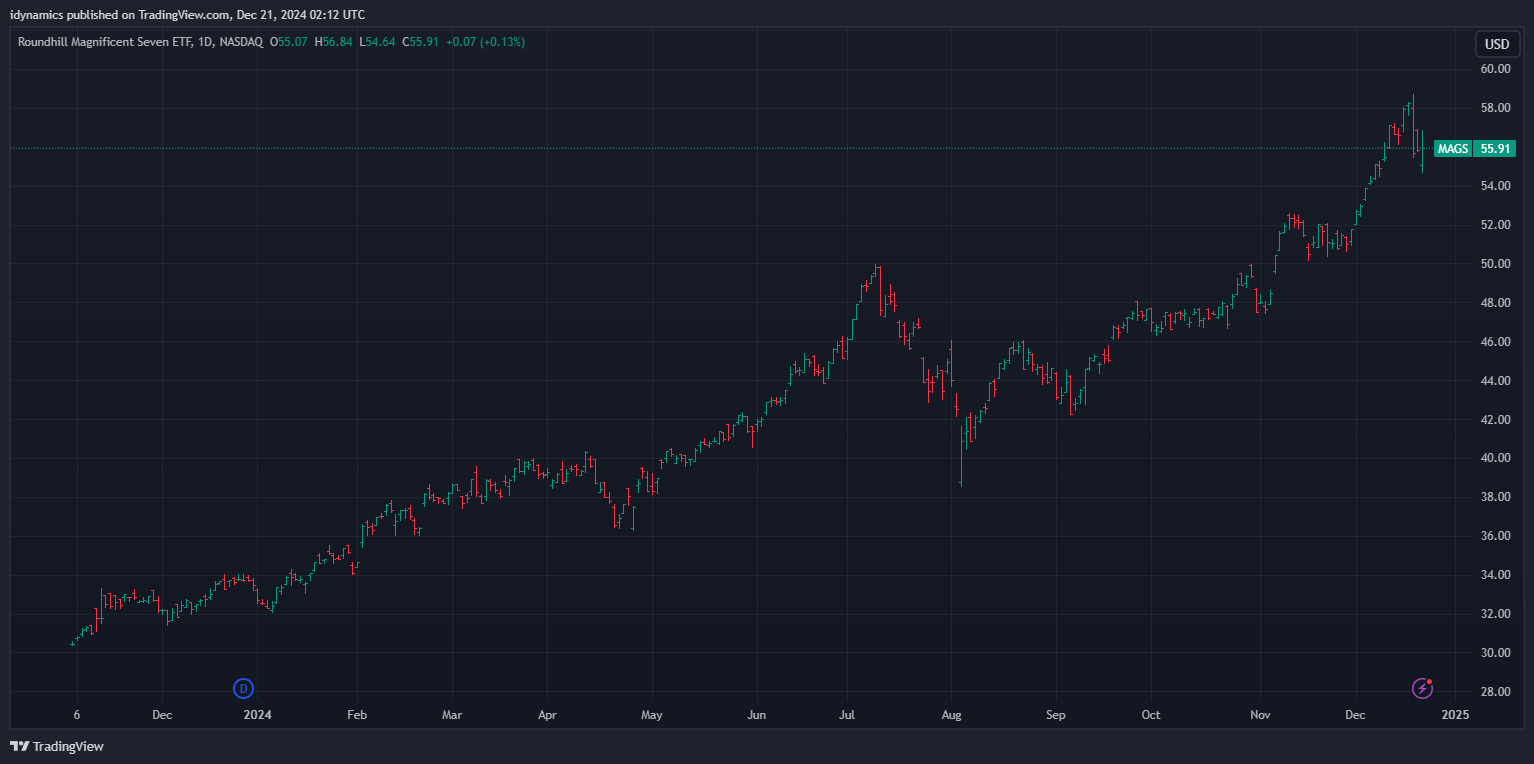
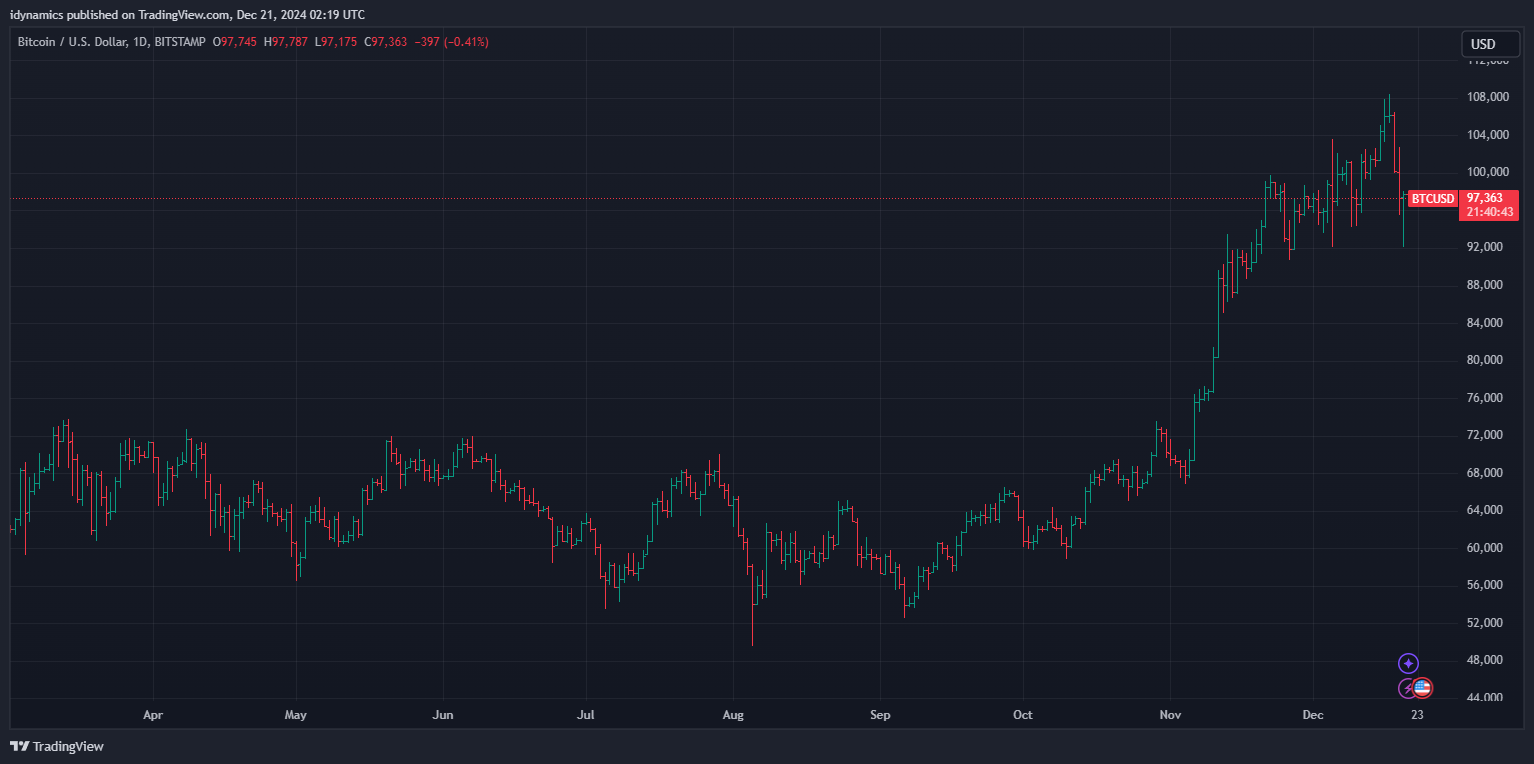
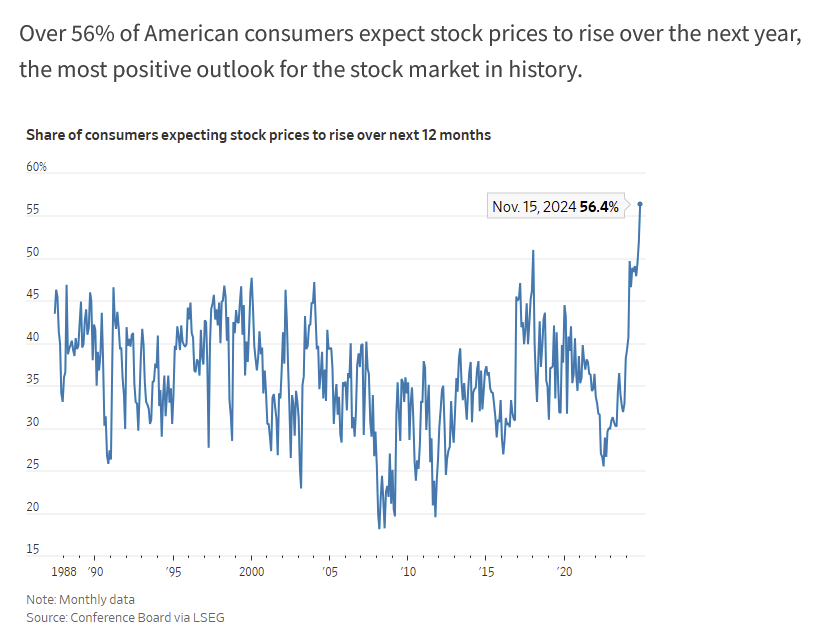 NVDA also traded an outside day up on Friday, it is down -9.52% off the highs and the daily has a H&S top pattern forming. The neckline is this past week’s trading low at 126.86 and closes under this area would signal targets in the -$100 area (the summer lows.) The MAG7 has a spike high while remaining one of the strongest charts. Even Bitcoin took a hit as it traded back toward the monthly lows in volatile trading. McClellan Oscillators are validating the lows in the Dow and potential trend change. The VIX exploded mid-week with it hitting the highest levels since the flash crash in August during the “Yen-unwinding” trade. The Yield Curve set the highest weekly close since turning positive, ending the week at +0.221% while the 10YR is back above 4.5%. Truflation has moved above 3%. High Yield Credit spreads have moved back to levels last seen at the Great Recession.
10YR-2YR Yield Curve Weekly
 VIX Weekly H-L-C
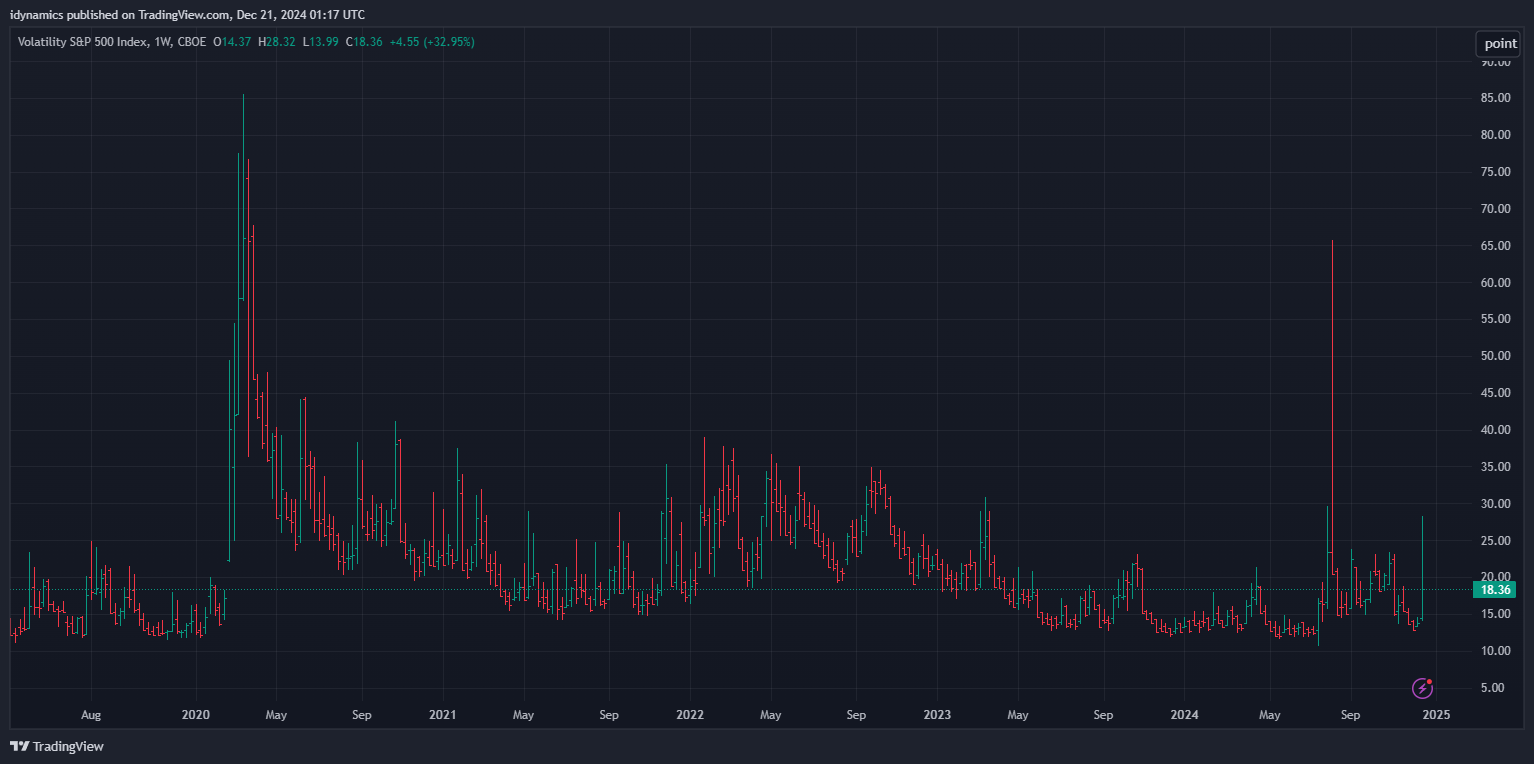
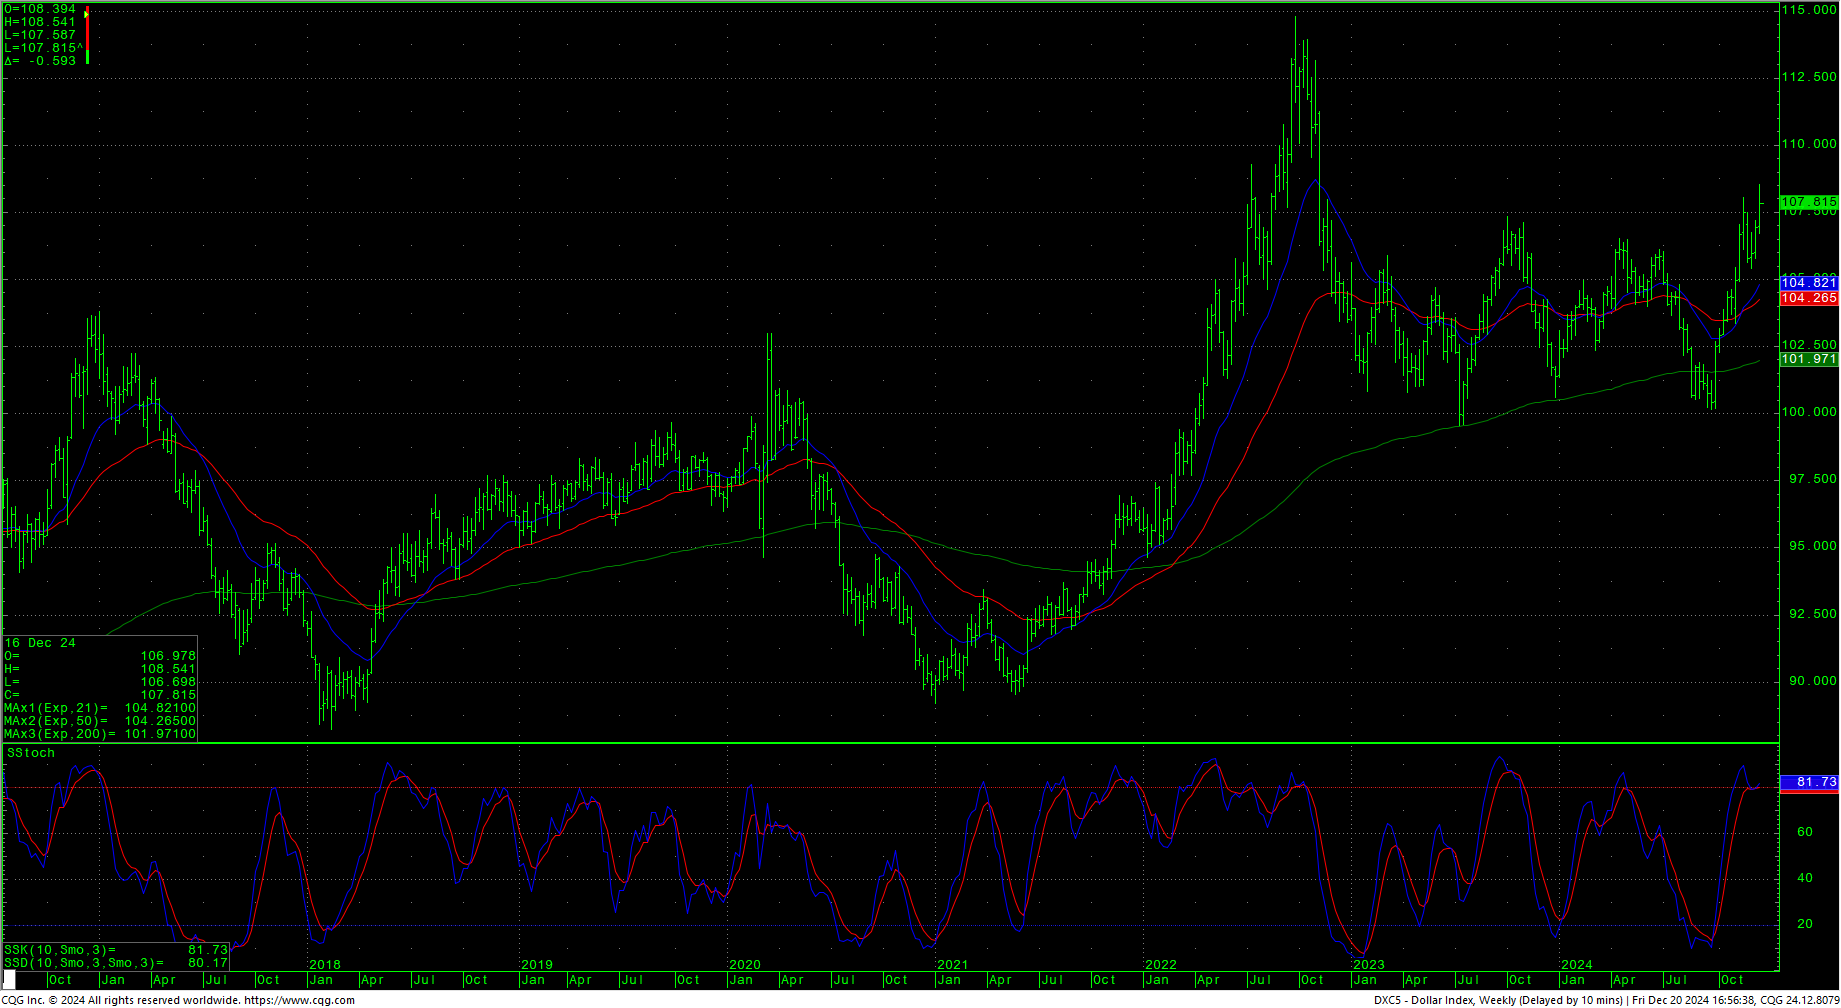
The VIX soared mid-week above 26 and closed at 18.36 toward the lower half of the weekly range. The US Dollar rallied sharply to the highest levels since late 2022 and closed at the highest weekly close since 31 October 2022.
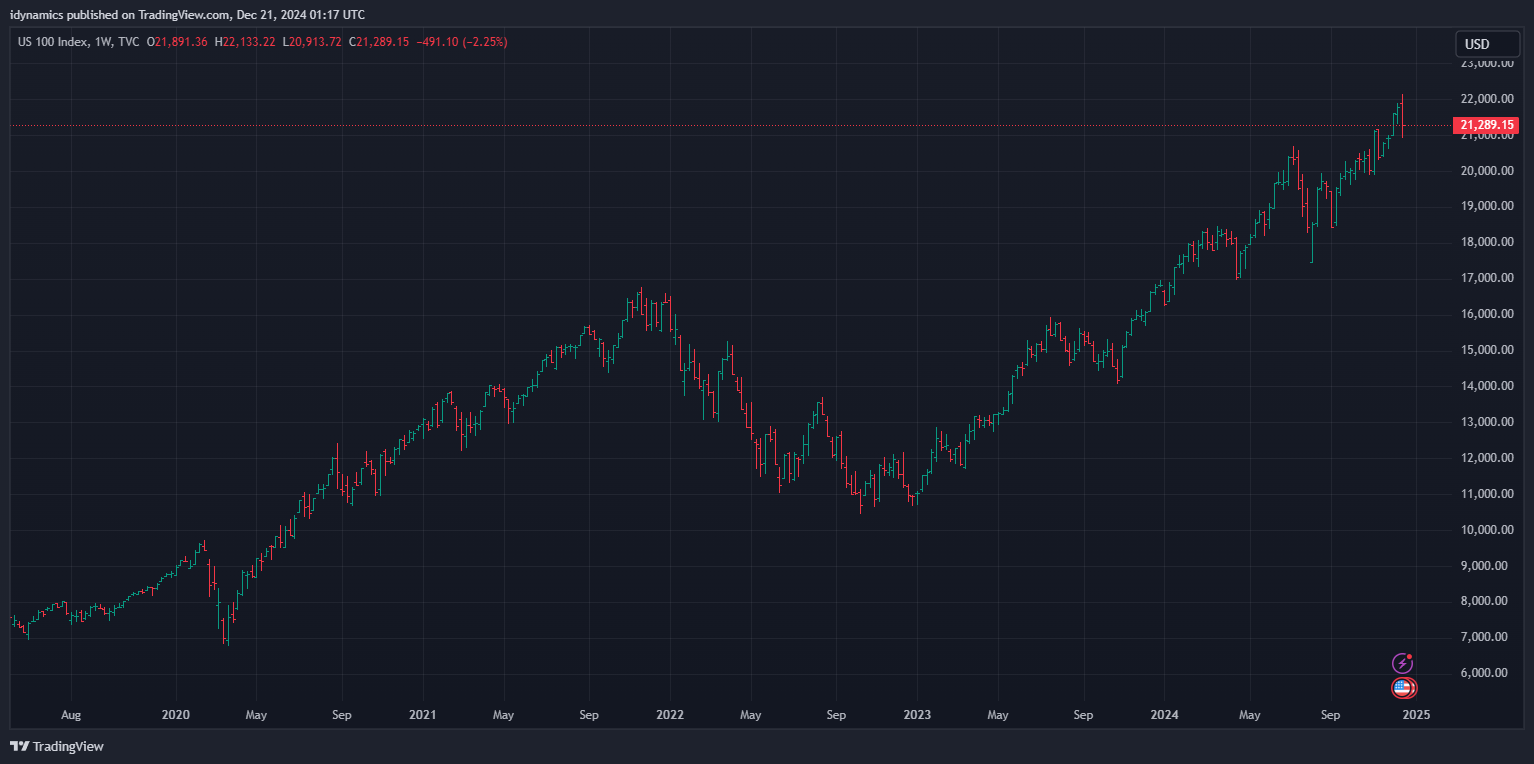
 Nasdaq 100 Weekly H-L-C
 52-Week A/D Line
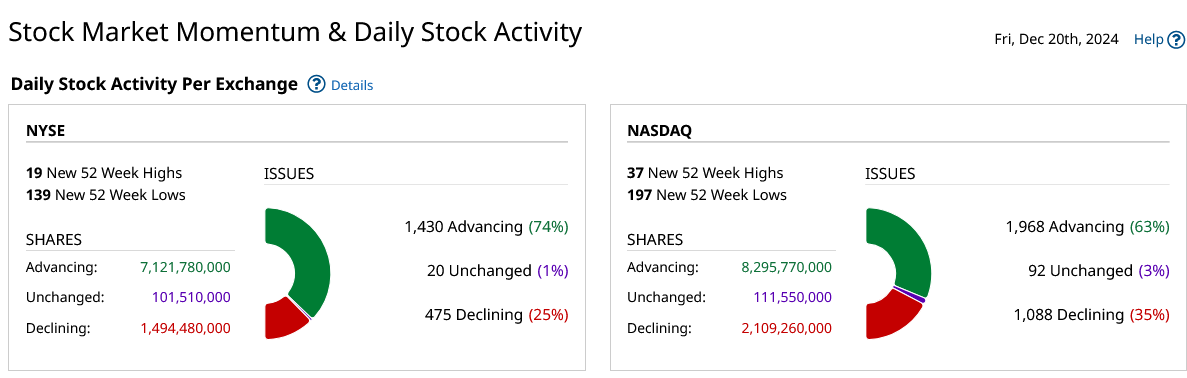
Breadth was mixed, decent for tech stocks but bad for the secondaries. Sentiment shows fear.
CNN Fear & Greed Index
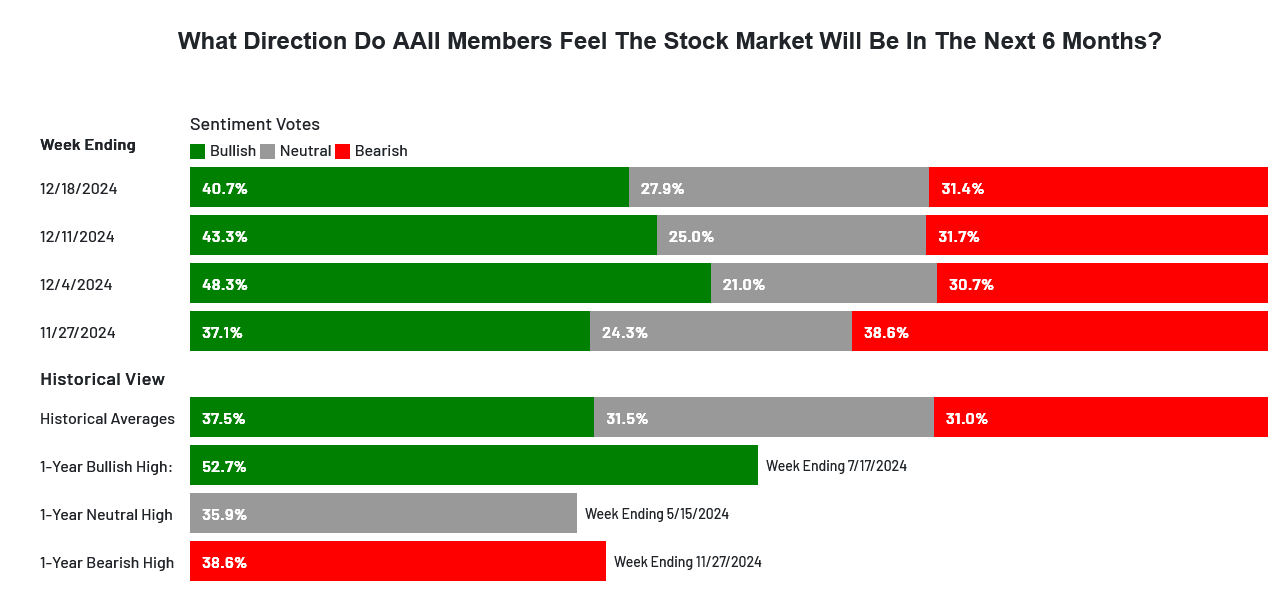
 AAII Investor Sentiment Survey