TECHNICAL ANALYSIS (by Intraday Dynamics)
 Happy New Year! (This week’s update is a Freemium post subscribe at: Intraday Dynamics)
Major Indices Week of December 27, 2024
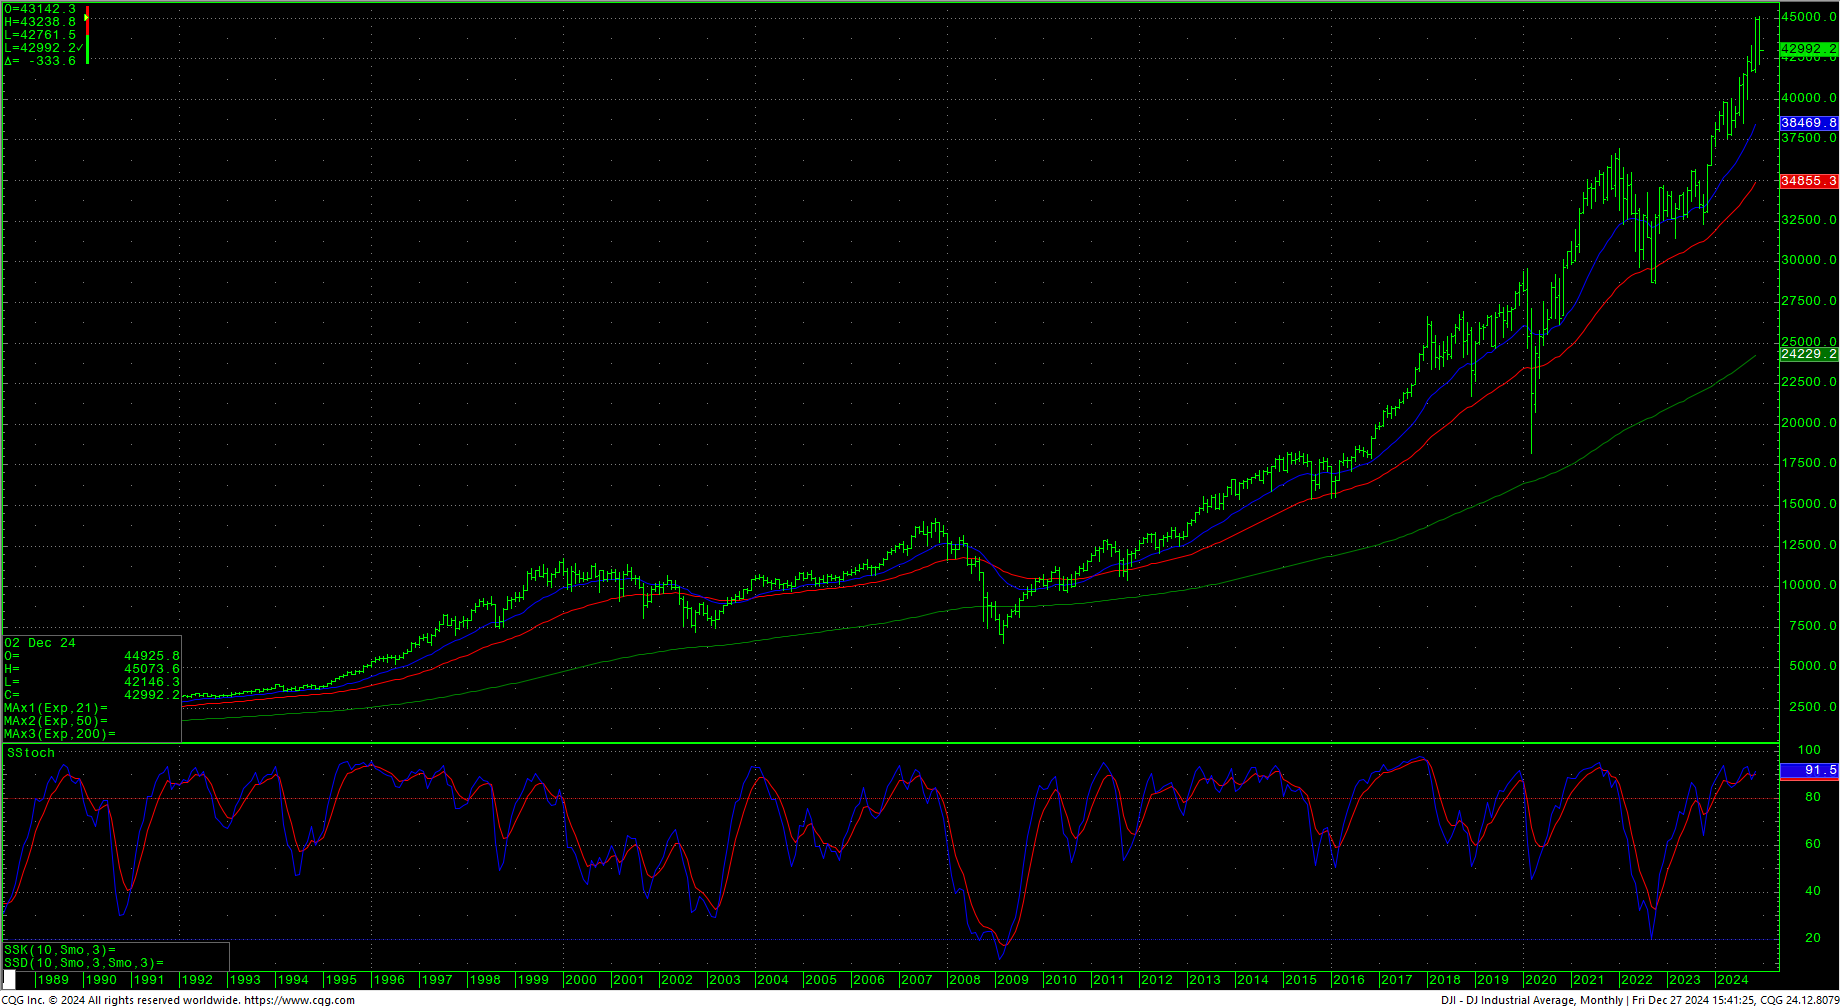
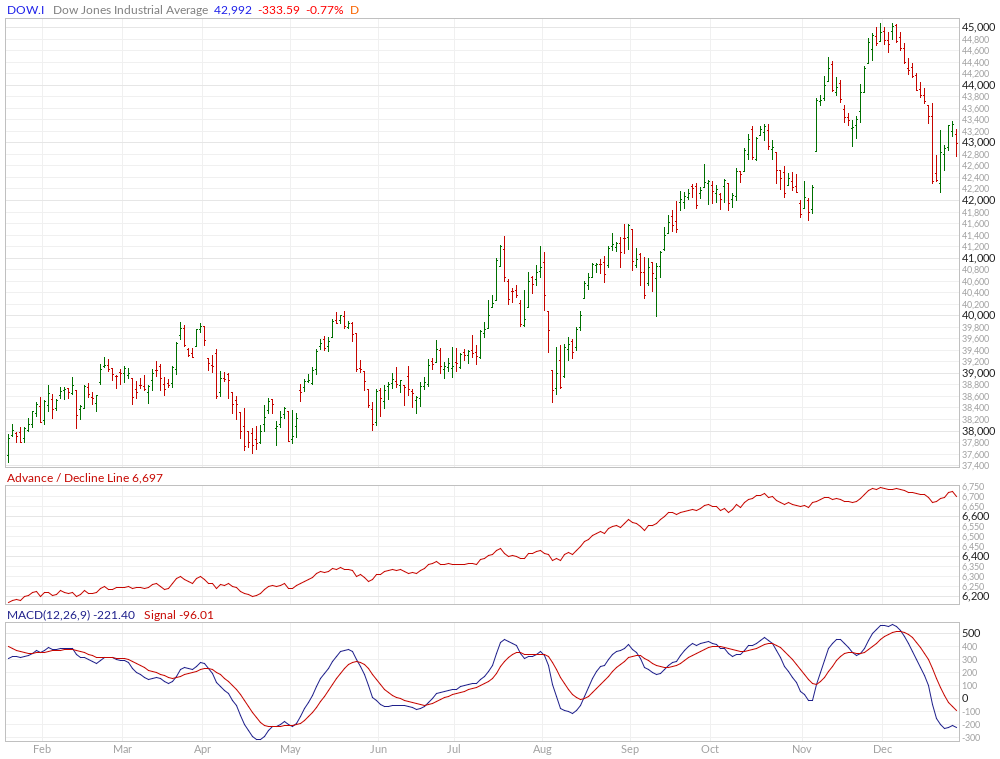
 Dow Jones Industrial Average Weekly Candles
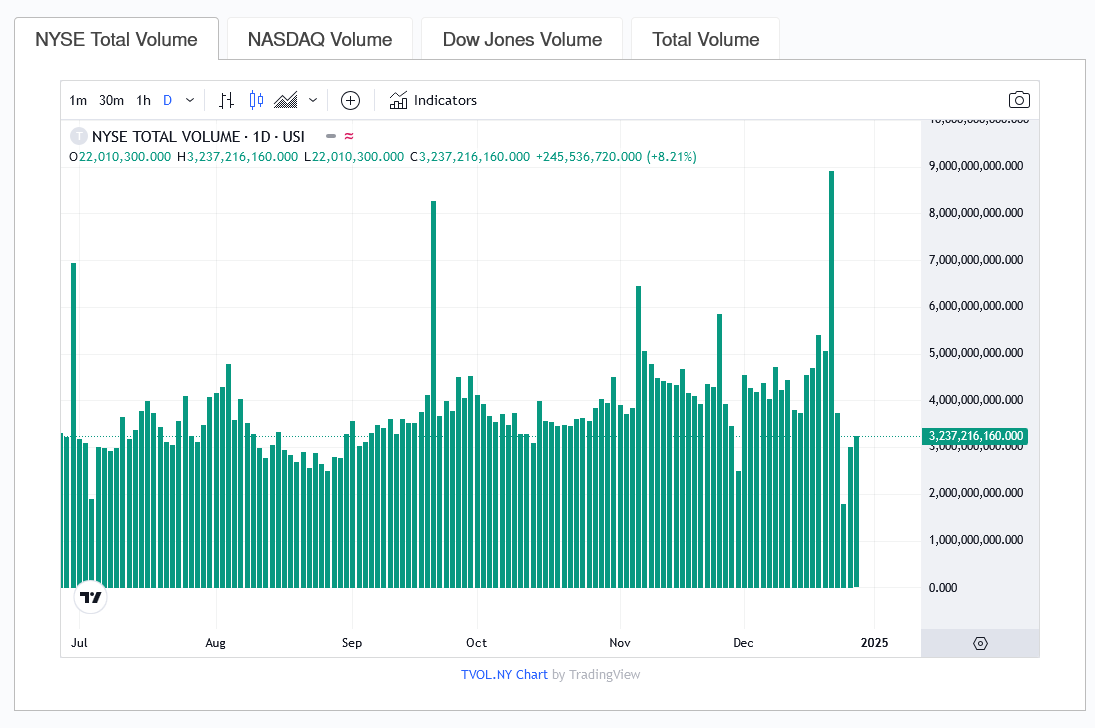
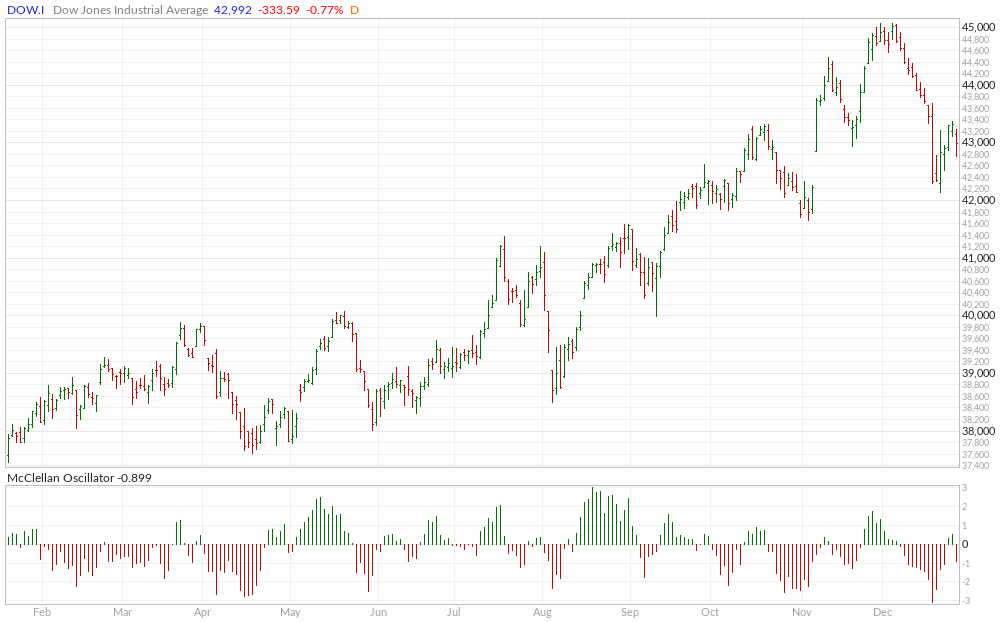
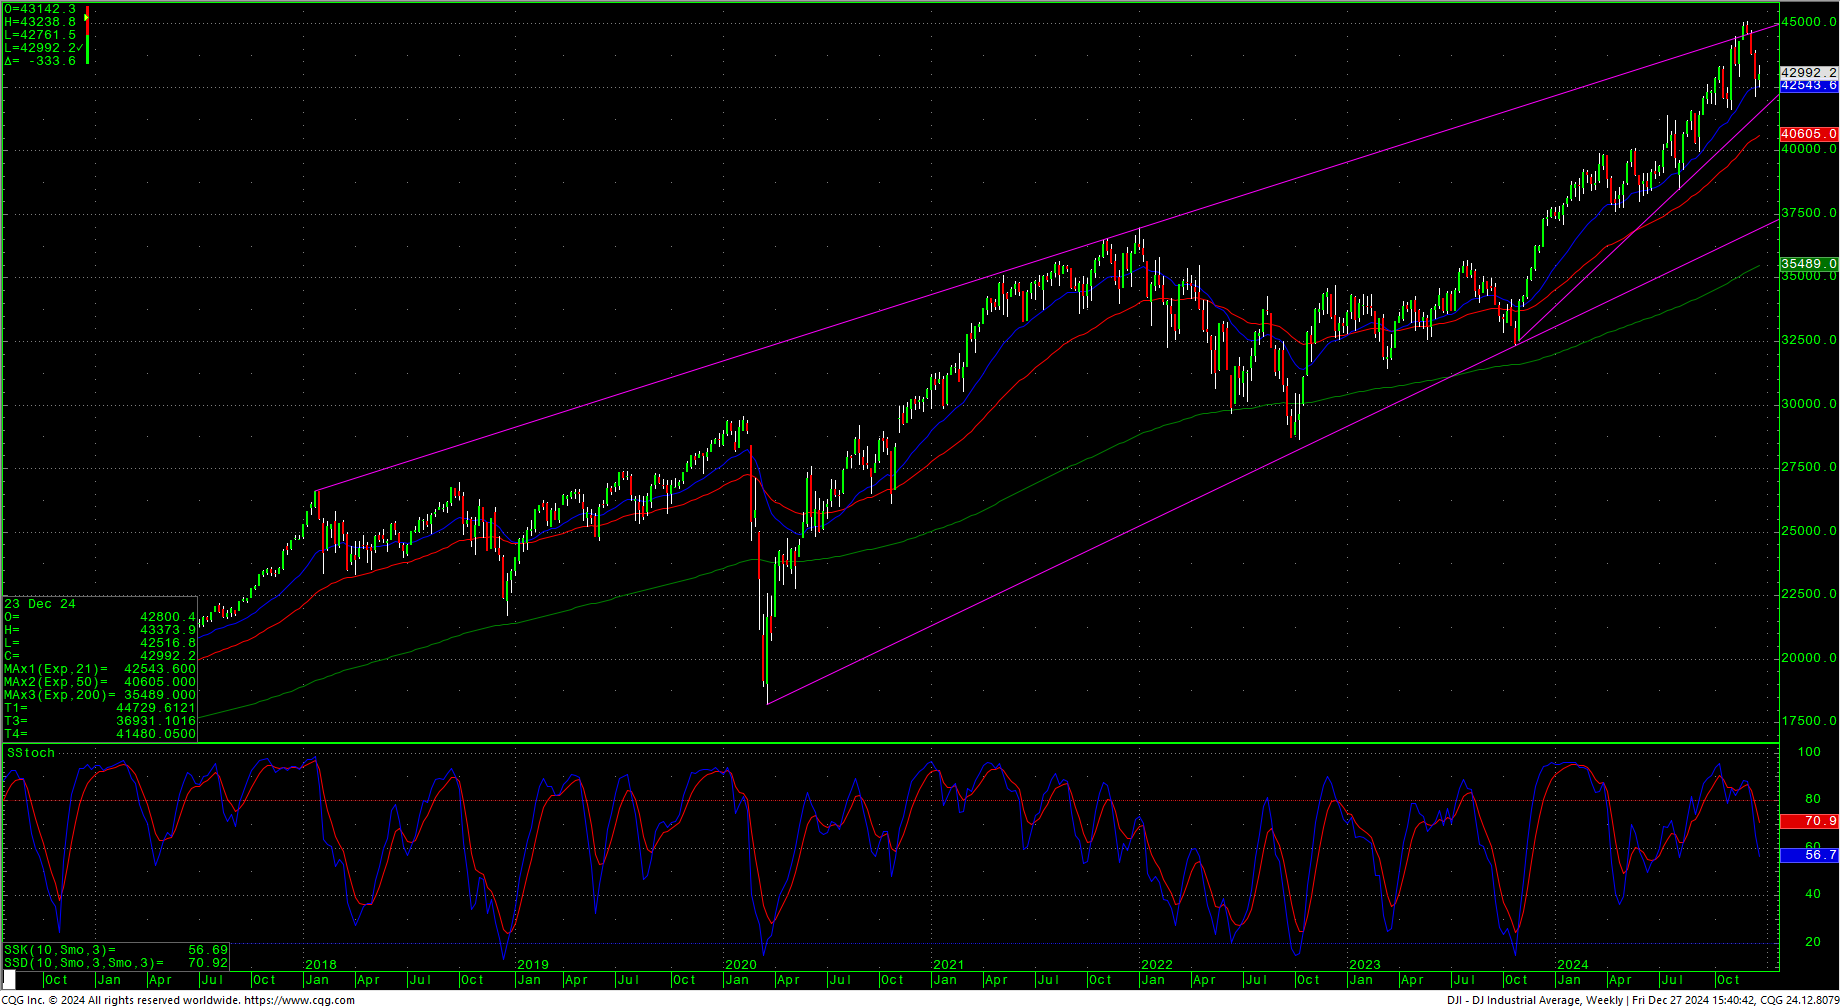 Stocks traded mostly higher in a subdued holiday week. Prices took a big hit intraday on Friday and recovered late, but still posting some large losses. The Dow now has two very distinct technical signals that require attention. The first is what appears to be an impulse wave from 18 December 2024, and a possible indication of a trend change. But then we have the high volume reversal just two days later on 20 December 2024, where the daily volume eclipsed the previous triple-witching volume of 20 September 2024. In that session on the 20th, the Dow came just a few ticks short of a target at 42123 and filled the large gap left on 6 November 2024. Since that reversal, the Dow has been building a choppy flag and time will tell which one of these key events will play out intermediate term.
NYSE Volume Daily
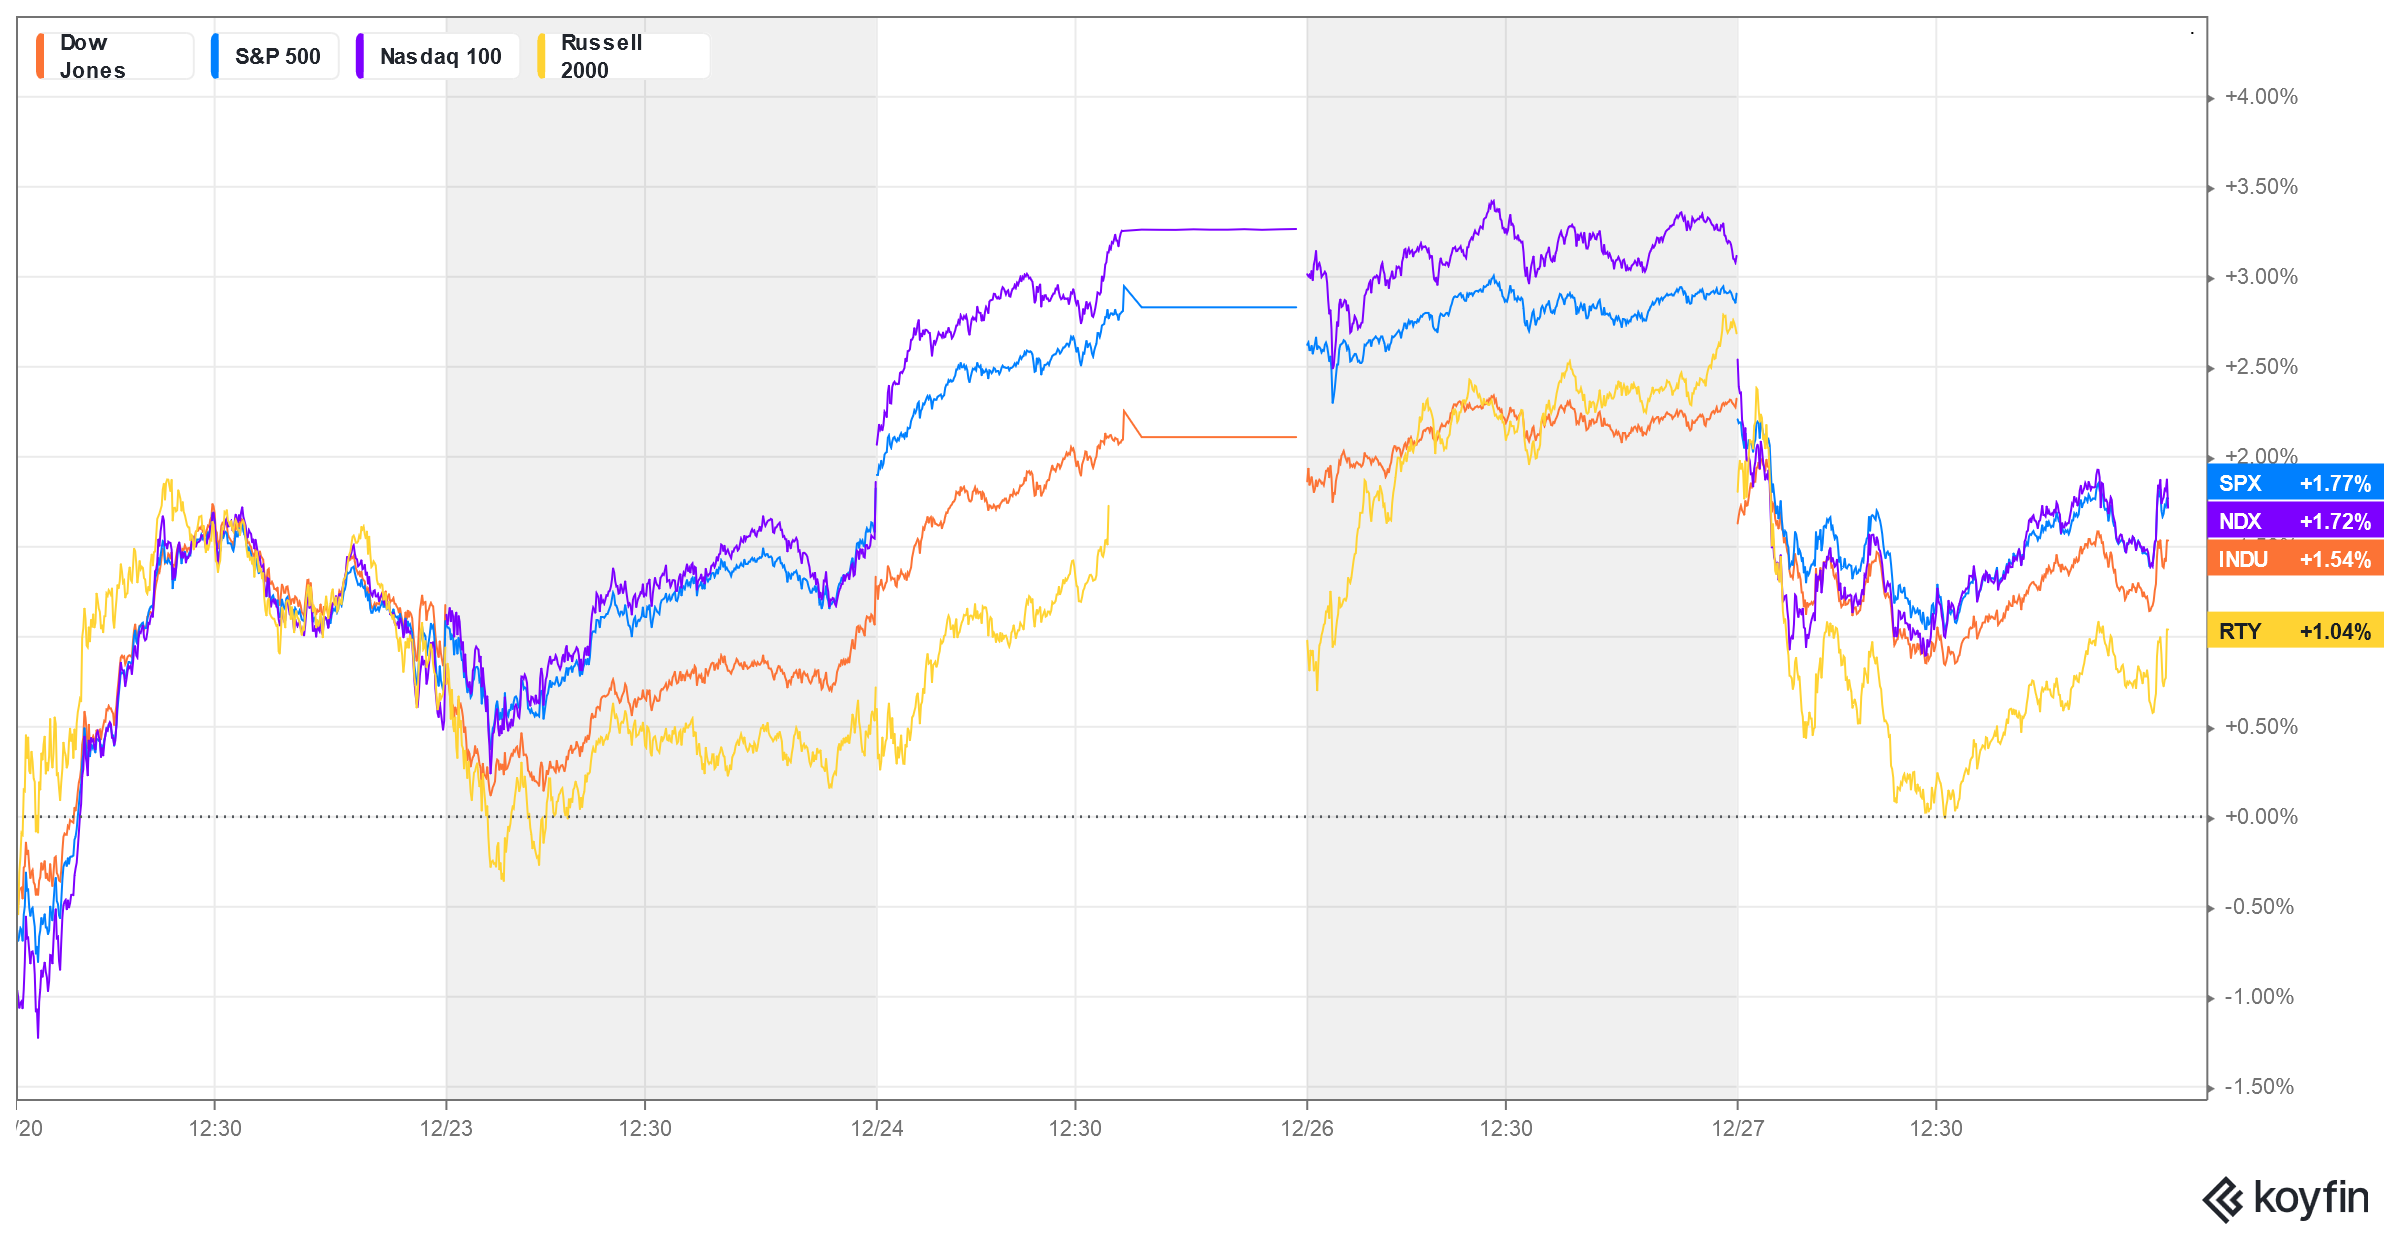
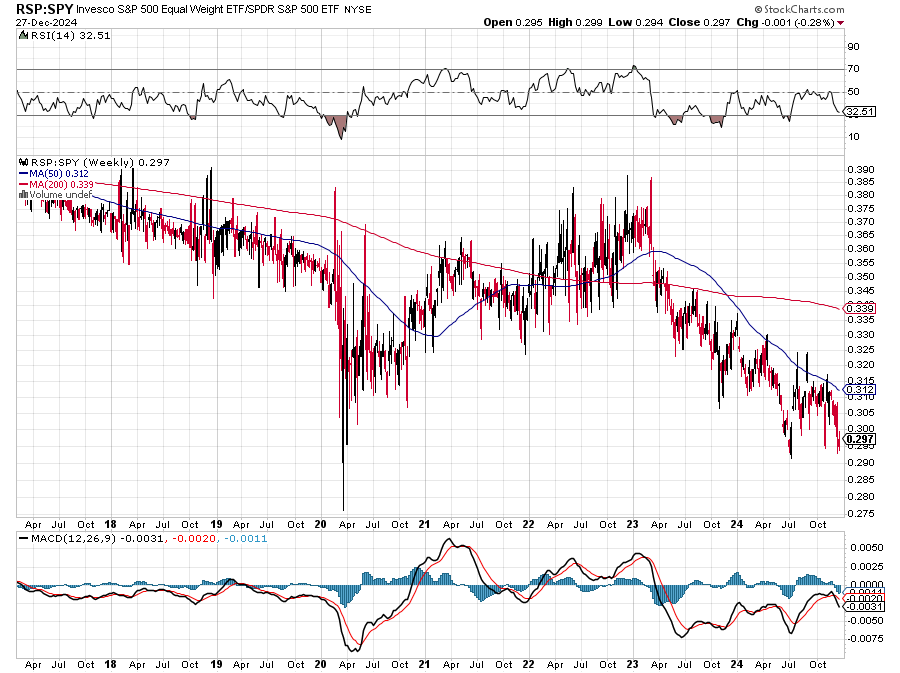
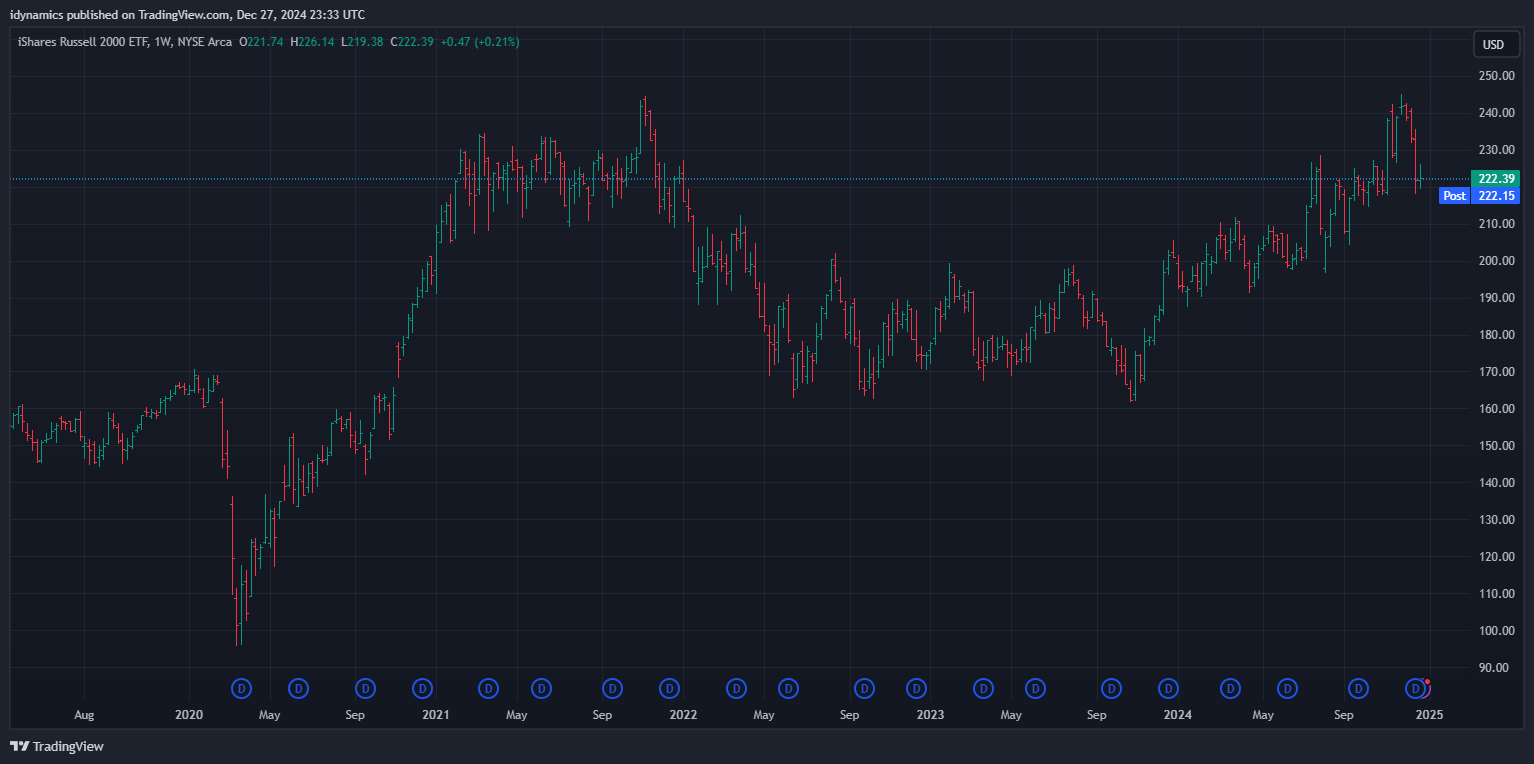
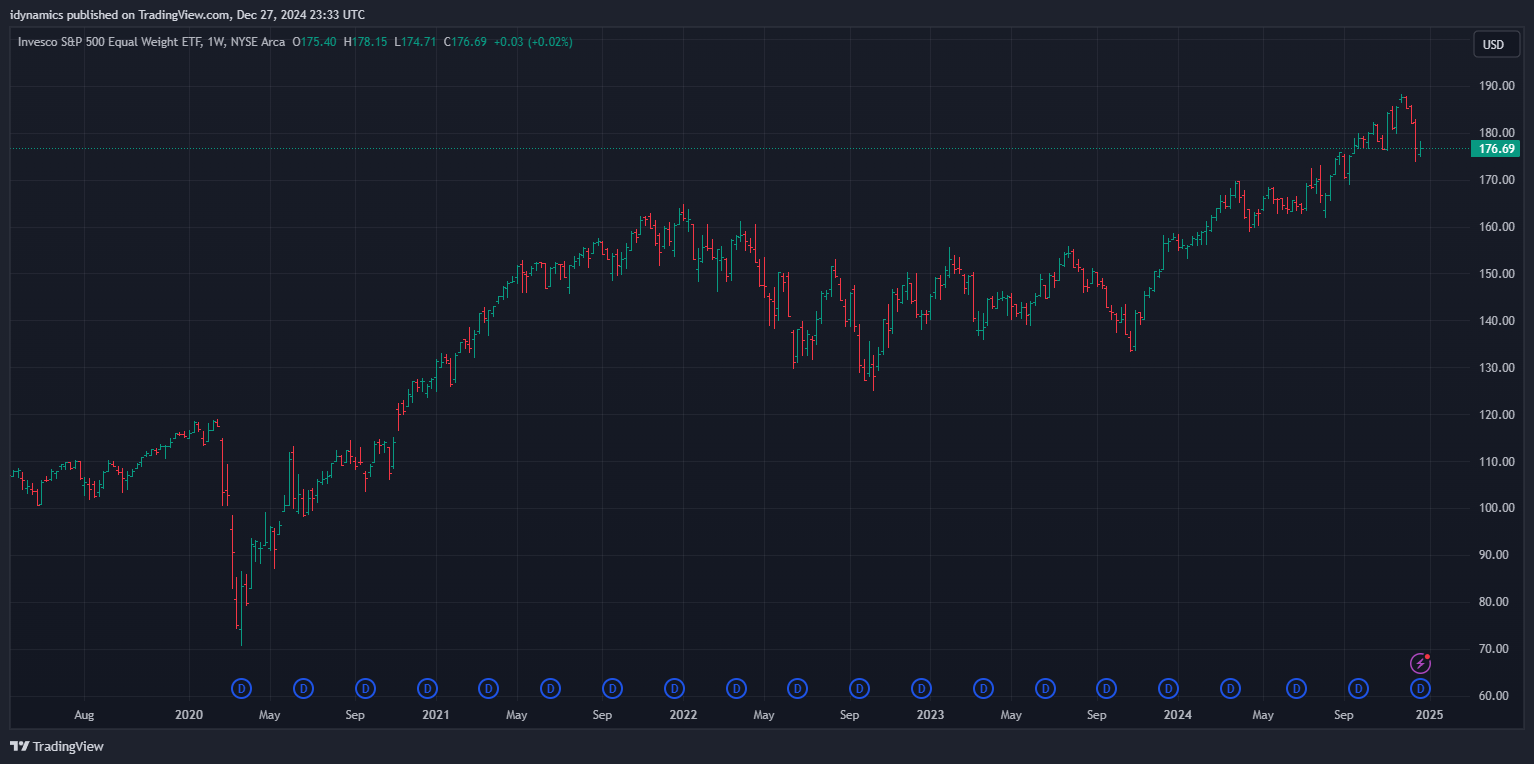
 All the indexes closed higher on the week. The S&P has outperformed the Dow with prices rallying all the way back to the breakdown area at 6030/6035 before turning back in Friday’s session. Tech stocks have also outperformed the Dow and the secondaries continue to perform weakly versus the rest of the market. In fact, the RSP:SPY is now testing multiyear lows and the chart looks weak.
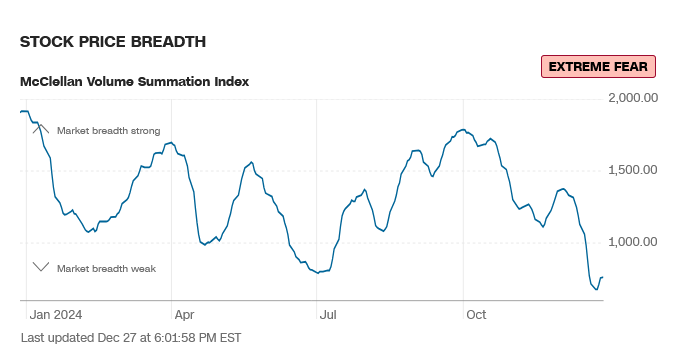
Sentiment has shifted to extreme fear in some indicators with breadth taking a hit along with the weakness in the IWM/RSP. Note that U.S. Employment will NOT be out this week, but on 10 January 2025.
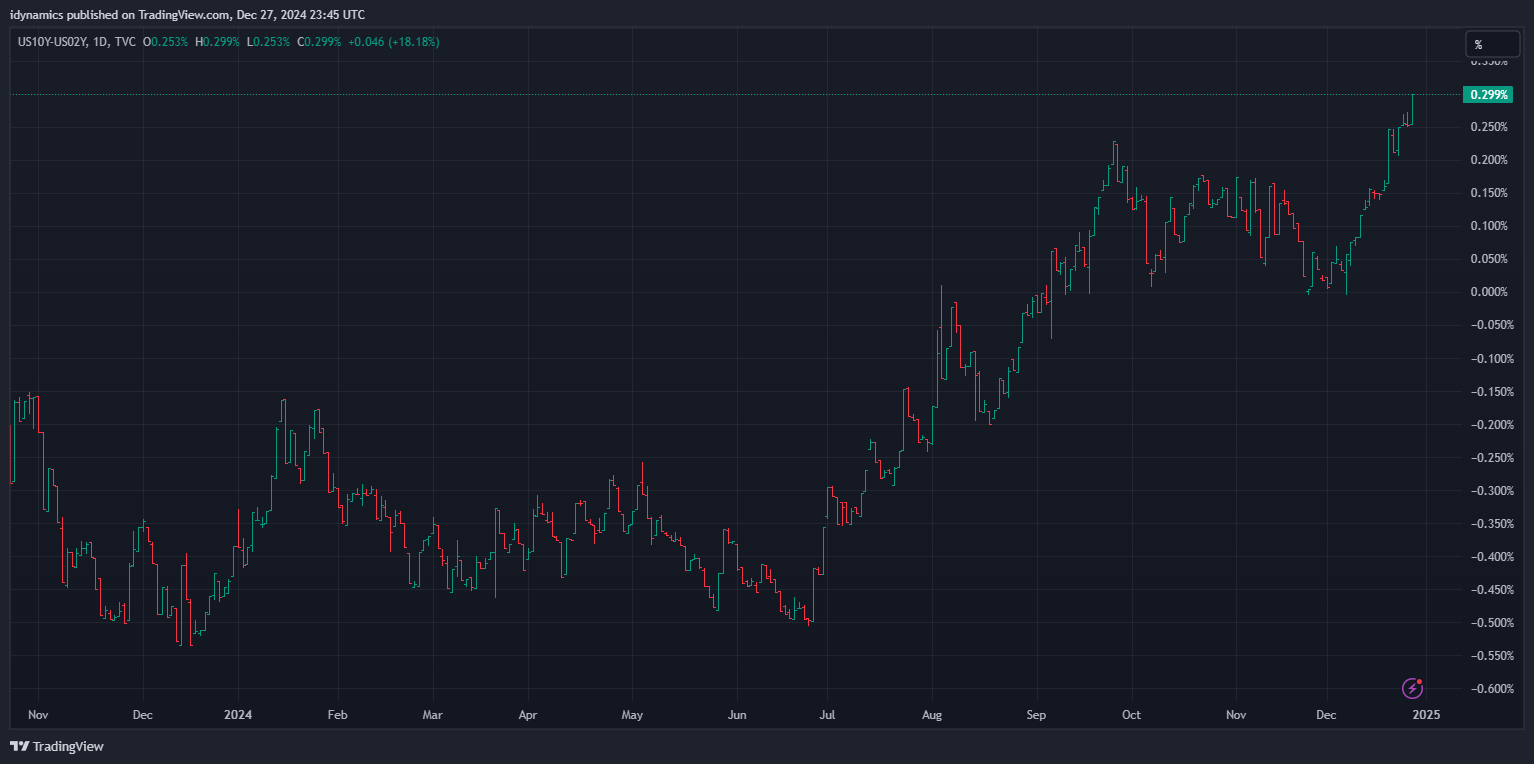
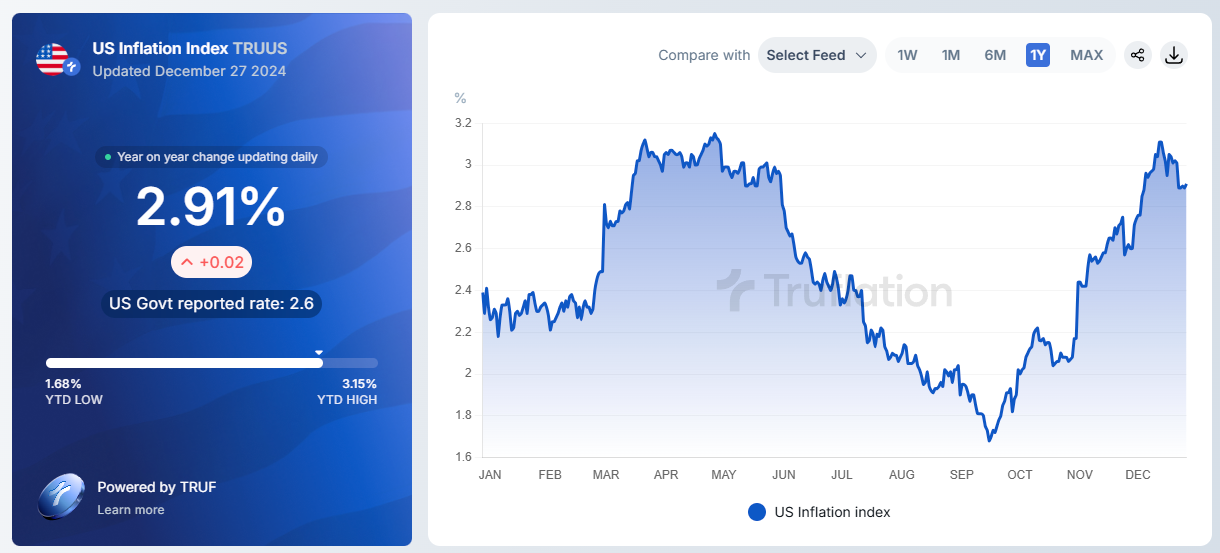
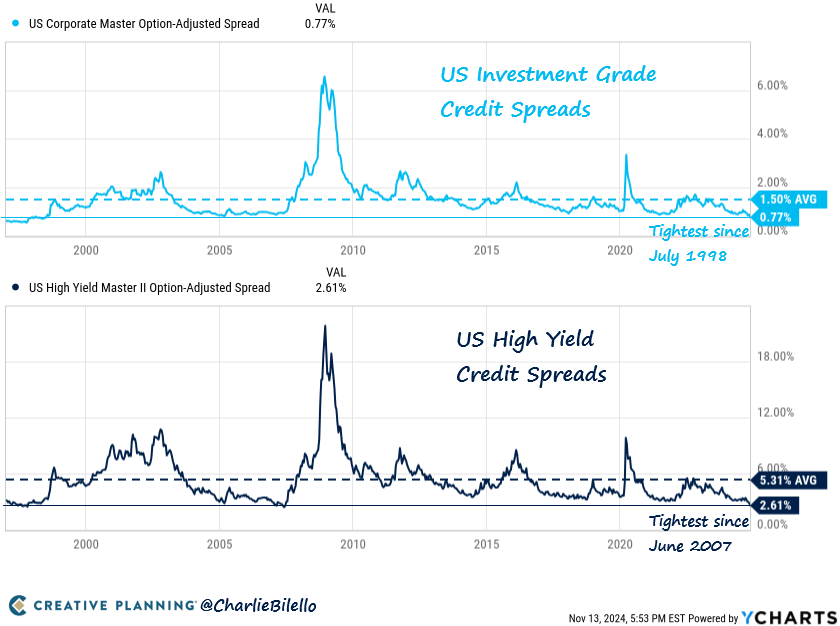
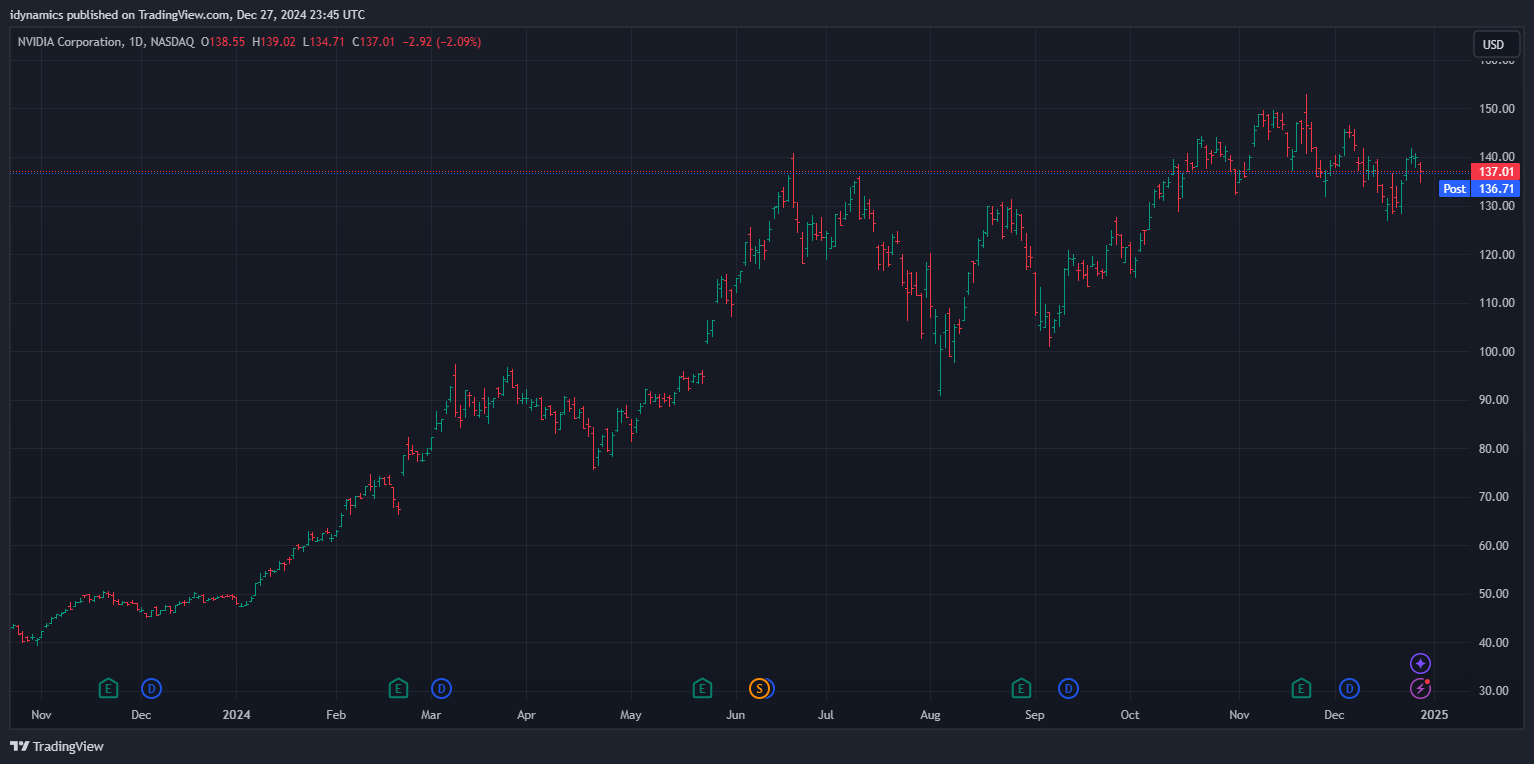
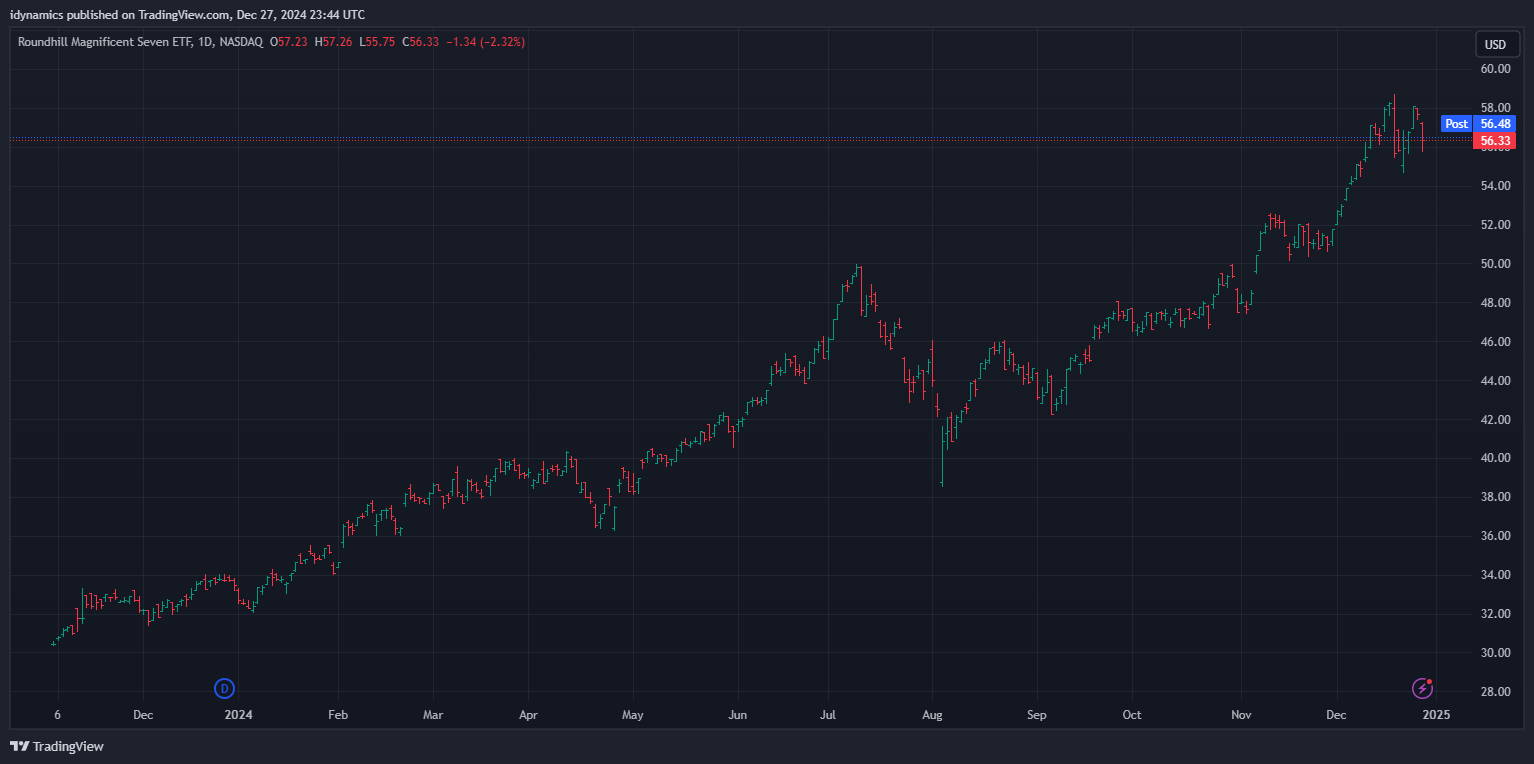
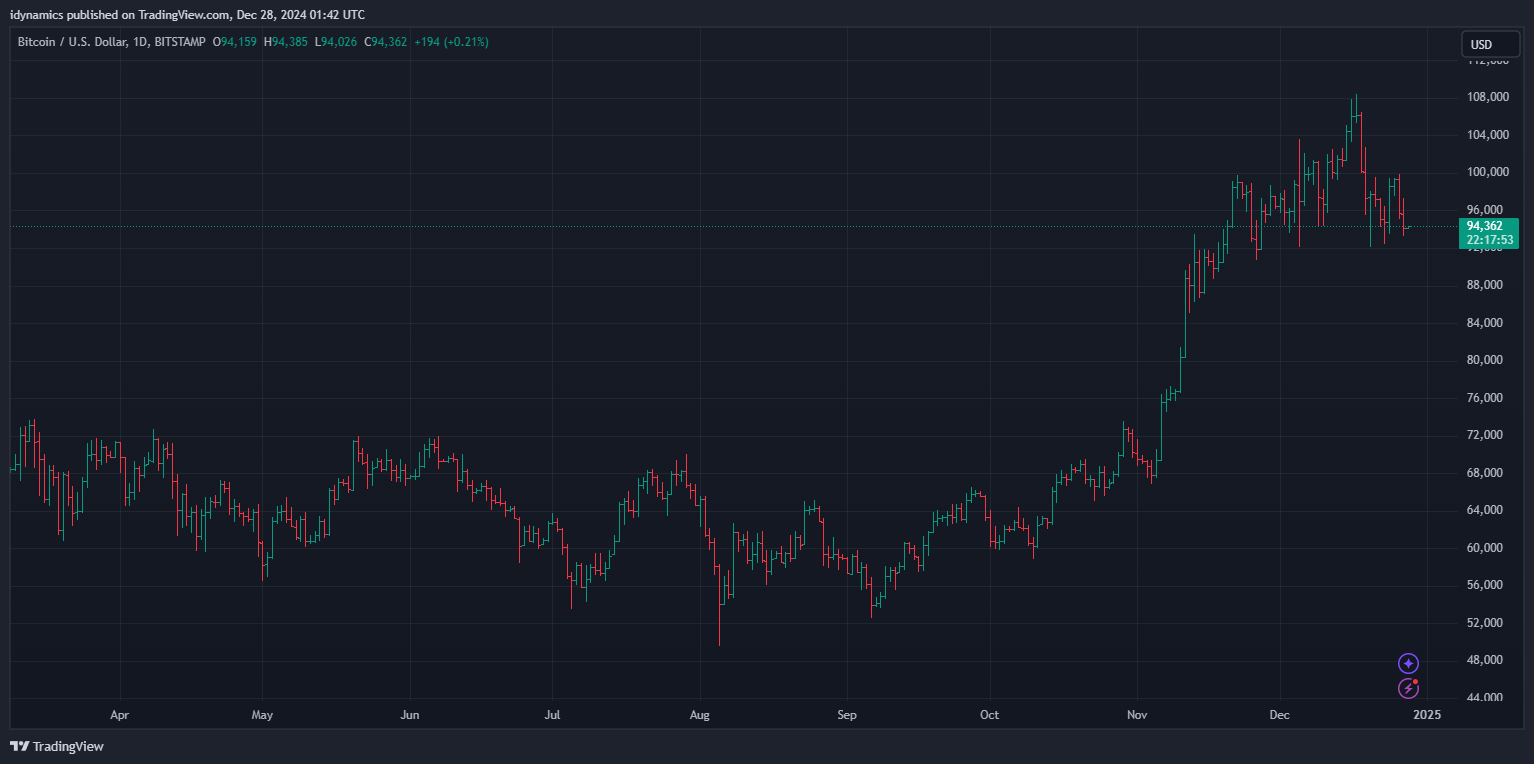
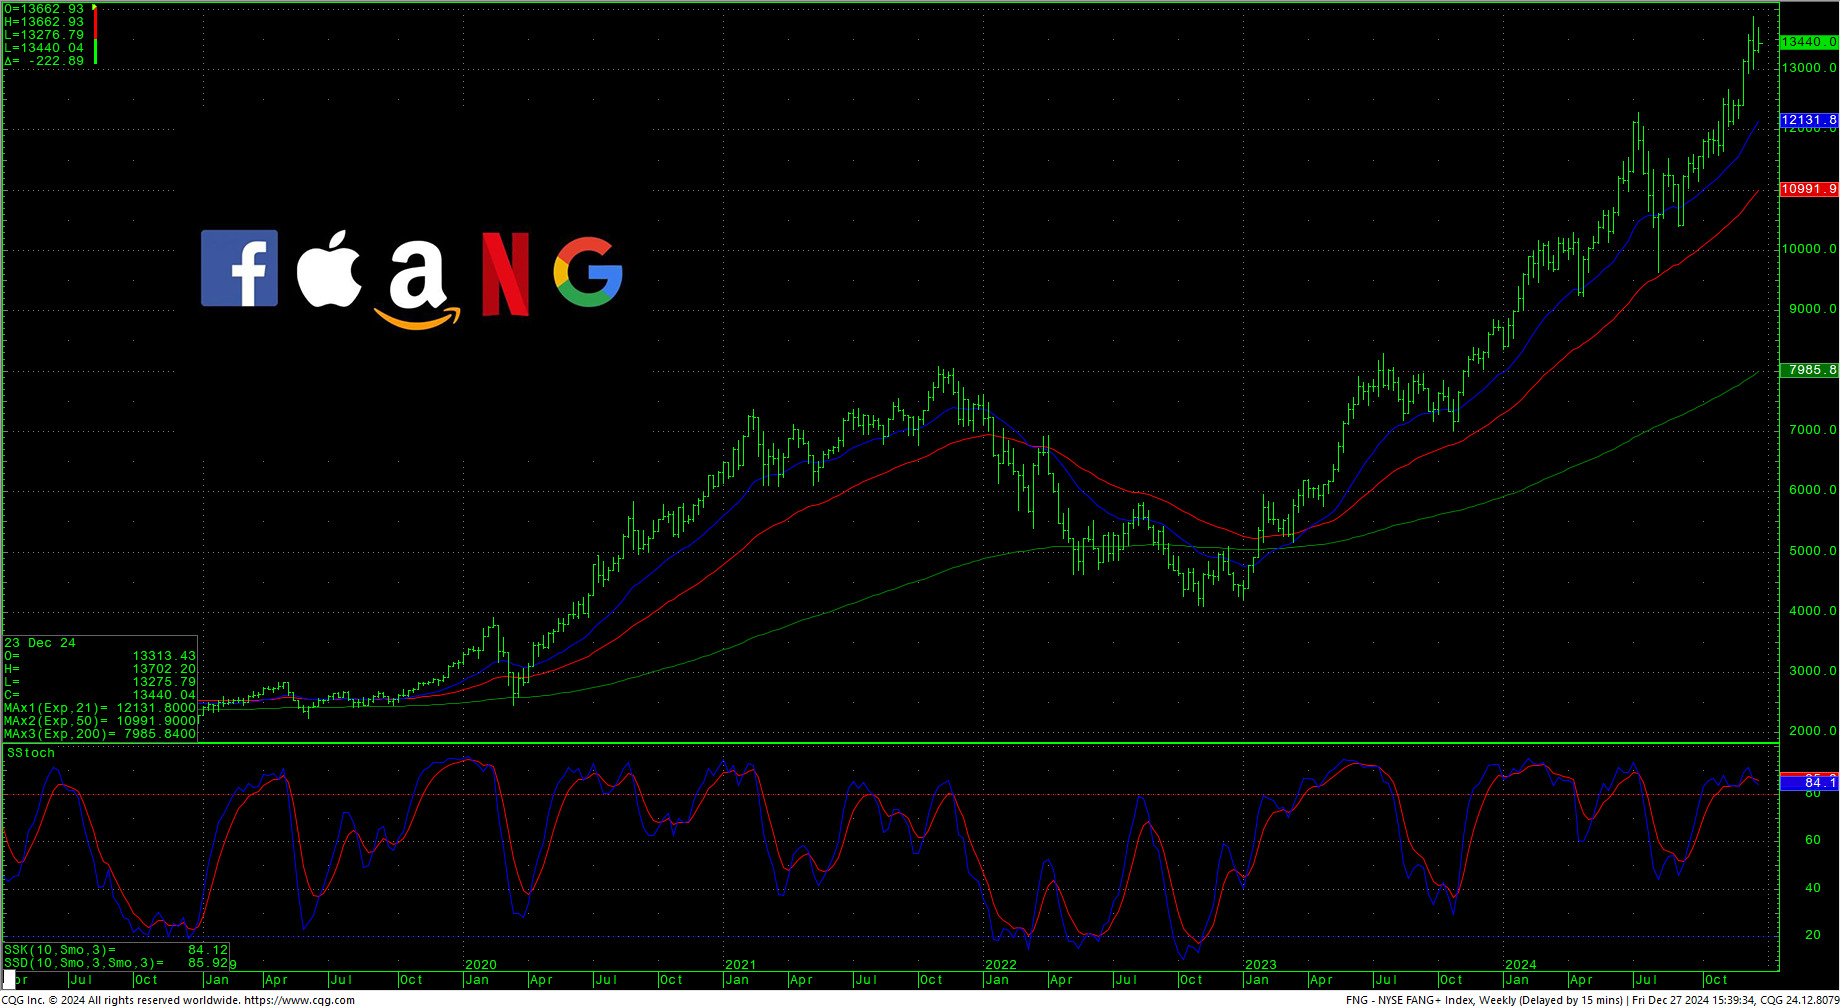
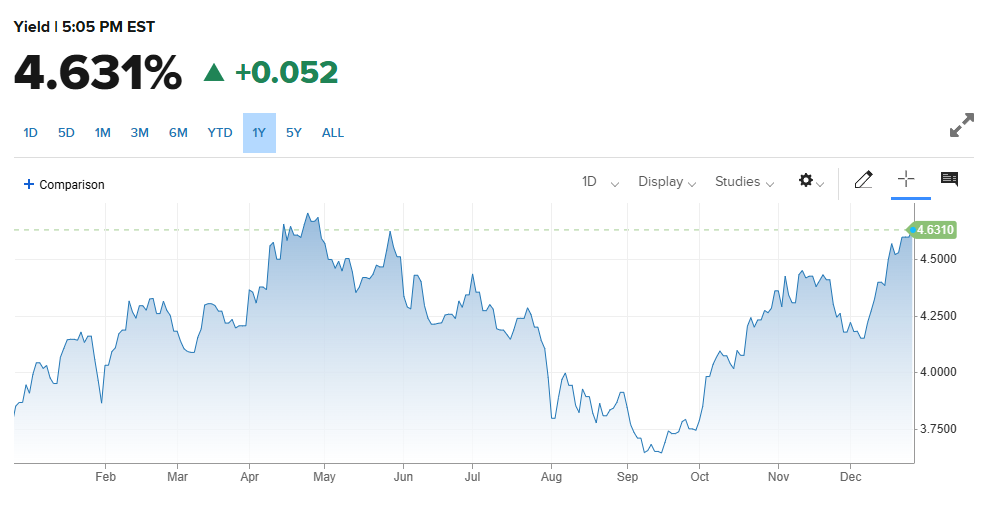
NVDA still has a potential H&S top pattern forming. The neckline is in the 126.86 and closes under this area would signal targets in the -100 area (the summer lows. The MAG7 still has a large spike high from 18 December 2024 and led the way down on Friday. Bitcoin has a flagging pattern built off the recent spike top at the 108000 level. A breakdown under 91000 with closes will setup the 74000 level. McClellan Oscillators and the A/D line for the Dow may be validating a potential trend change in the Dow. The Yield Curve set the highest weekly close since turning positive, ending the week at +0.299% while the 10YR is back above 4.6%. Truflation has moved back under 3%. The narrative on the longest recorded inversion in the yield curve is convoluted as a recession indicator. The recessions do not occur “during” the inversion, they typically start within around six months from when the curve turns positive once again. This year, the yield curve turned positive 6 September 2024. Yield Credit Spreads are trending at the bottoms…how long can that continue? (Chart from Charlie Bilello)
10YR-2YR Yield Curve Daily
 VIX Weekly H-L-C
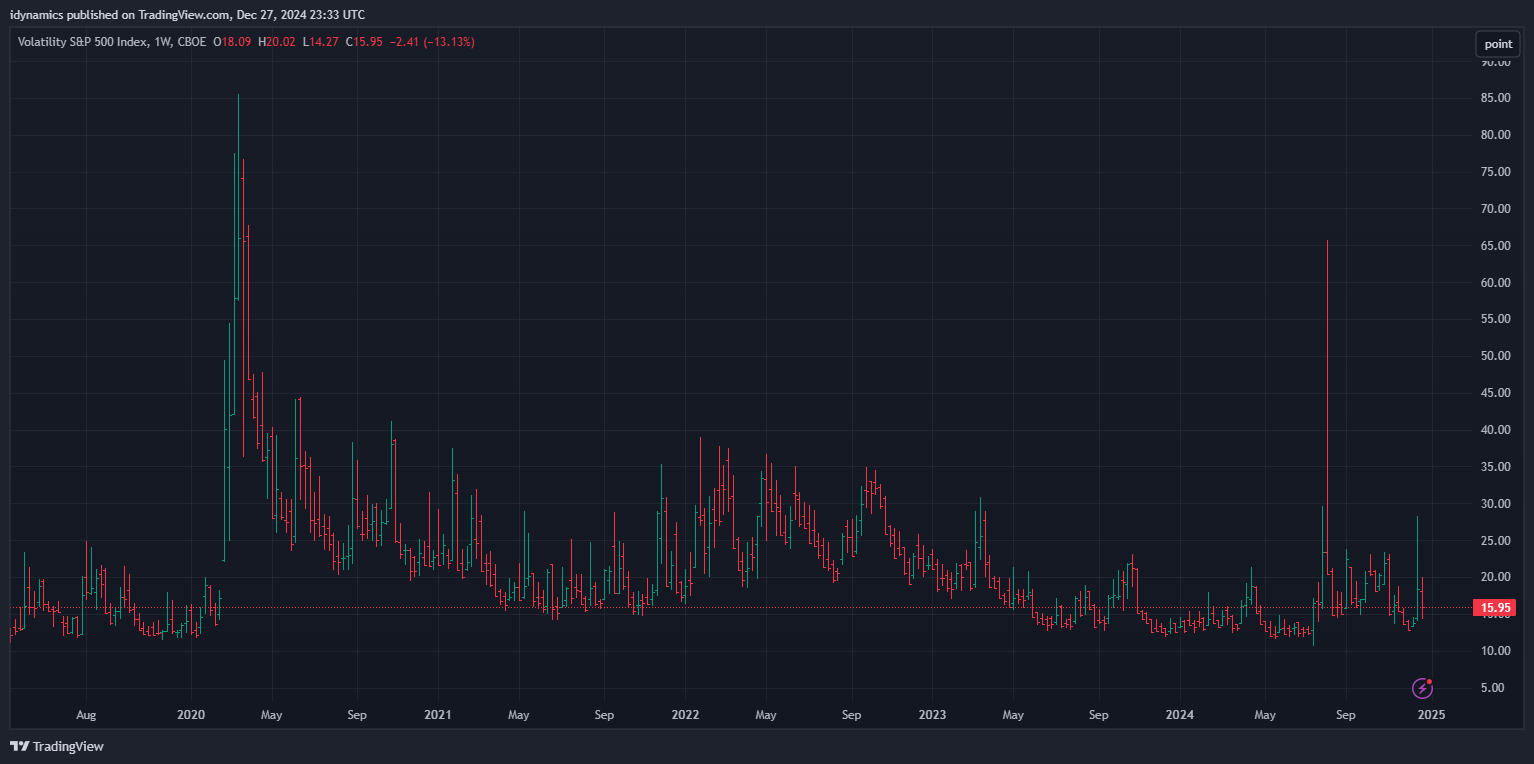
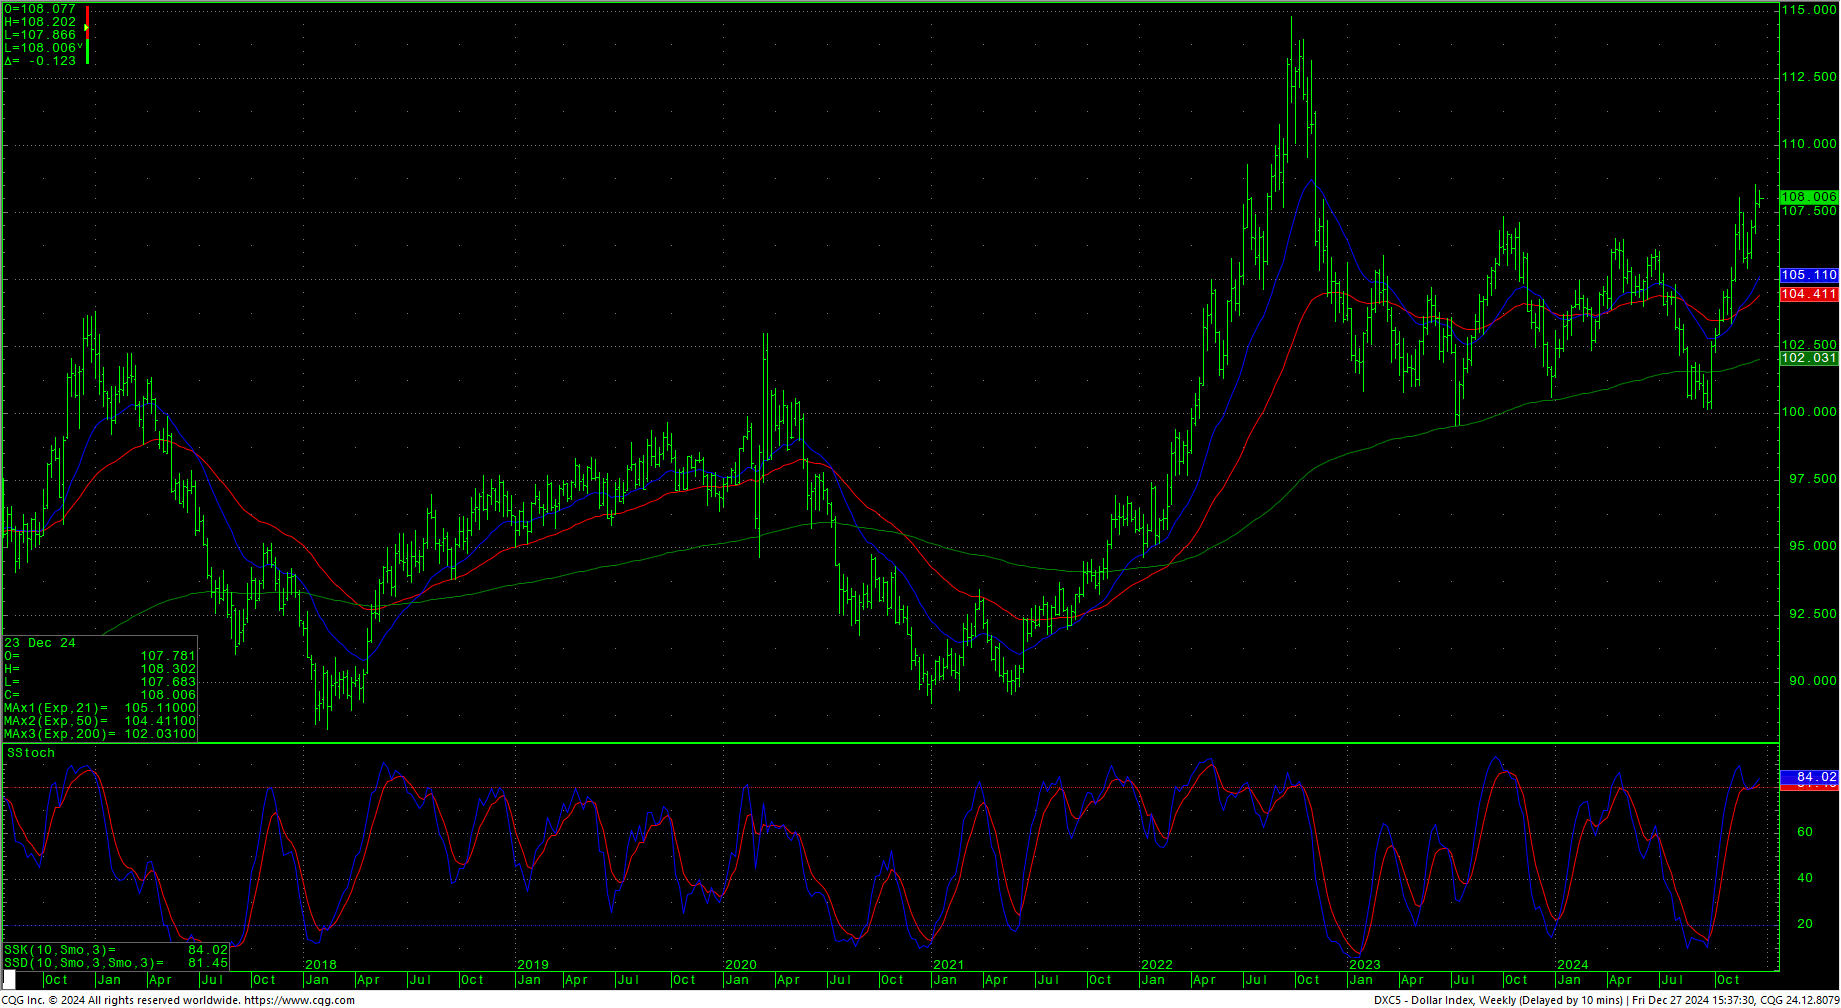
The VIX was lower throughout the week and jumped sharply Friday but came back to settle in the lower end of the range. The US Dollar ended the week higher in an extremely tight inside week’s range.
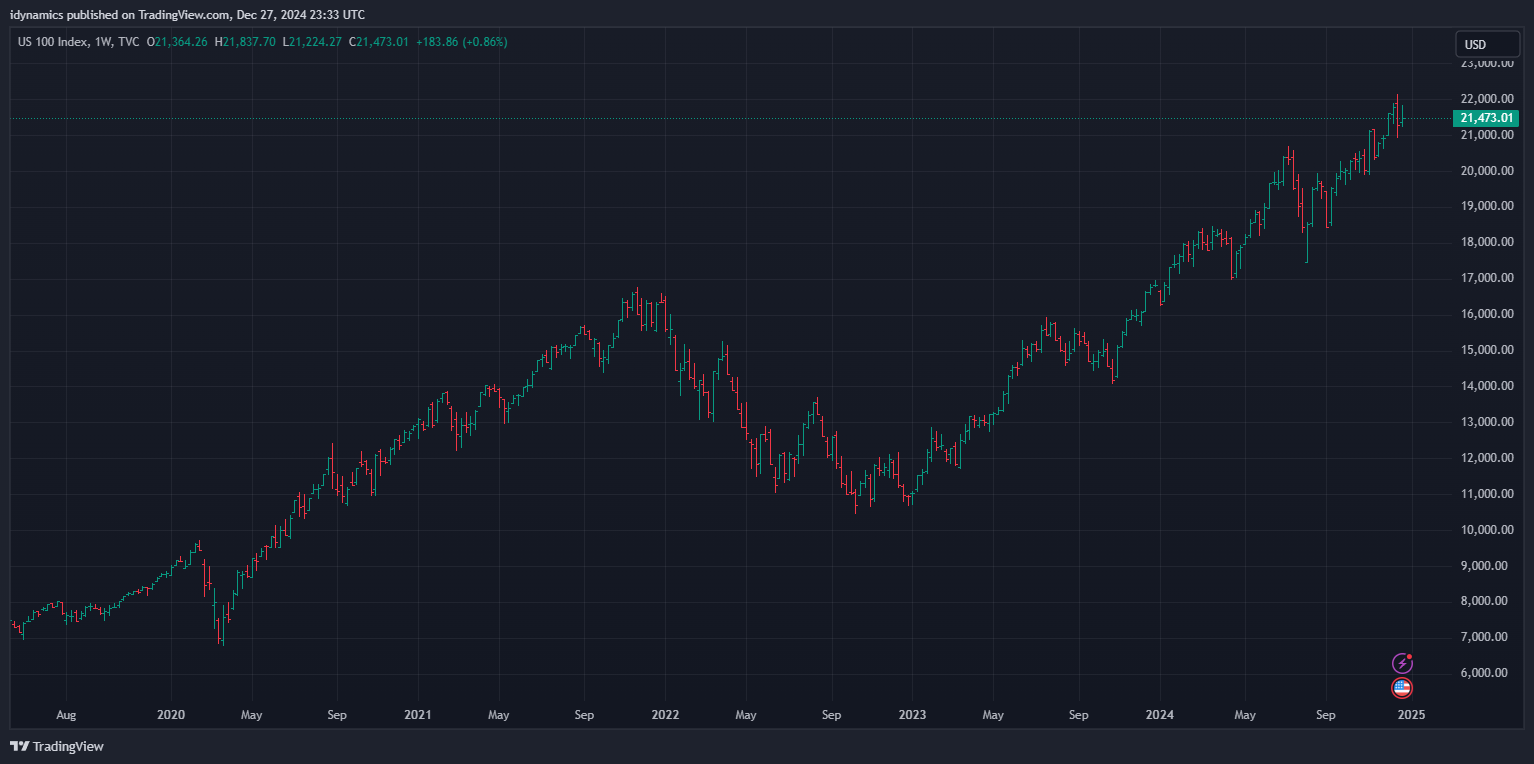
 Nasdaq 100 Weekly H-L-C
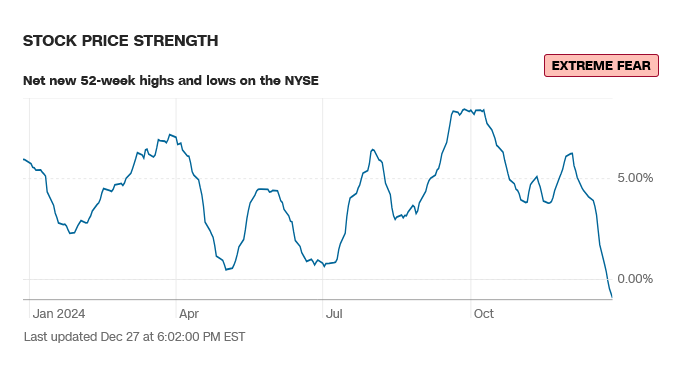
 52-Week A/D Line
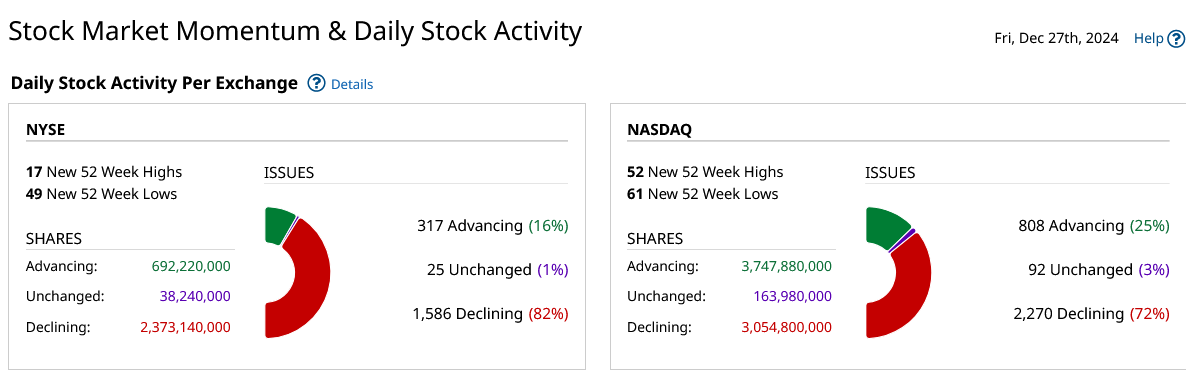
Breadth took a hit as the secondaries suffered. Sentiment shows extreme fear.
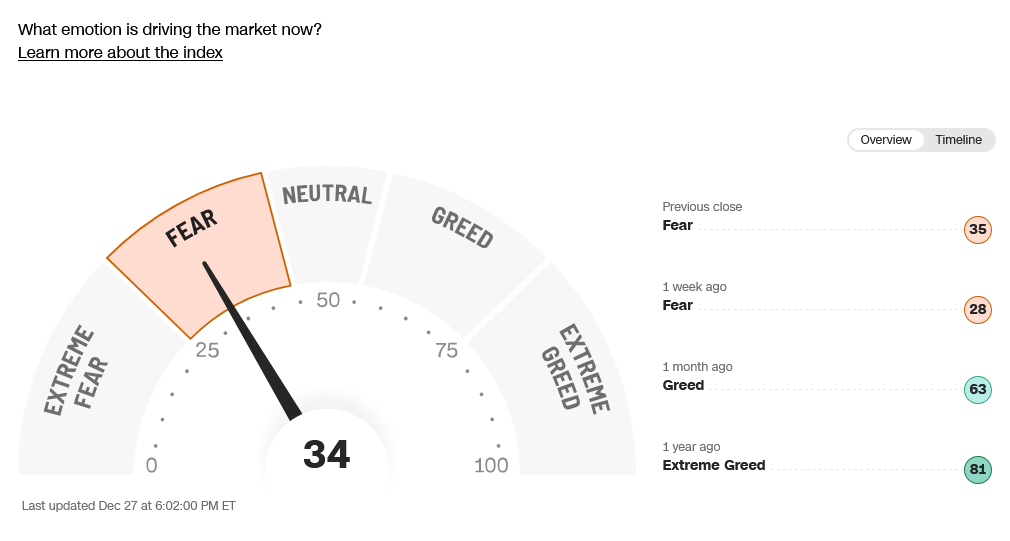
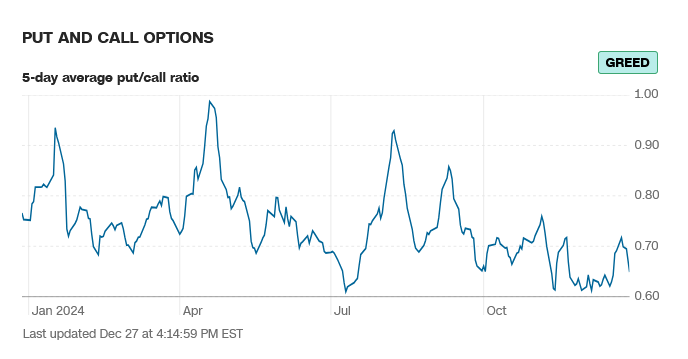
CNN Fear & Greed Index
 AAII Investor Sentiment Survey
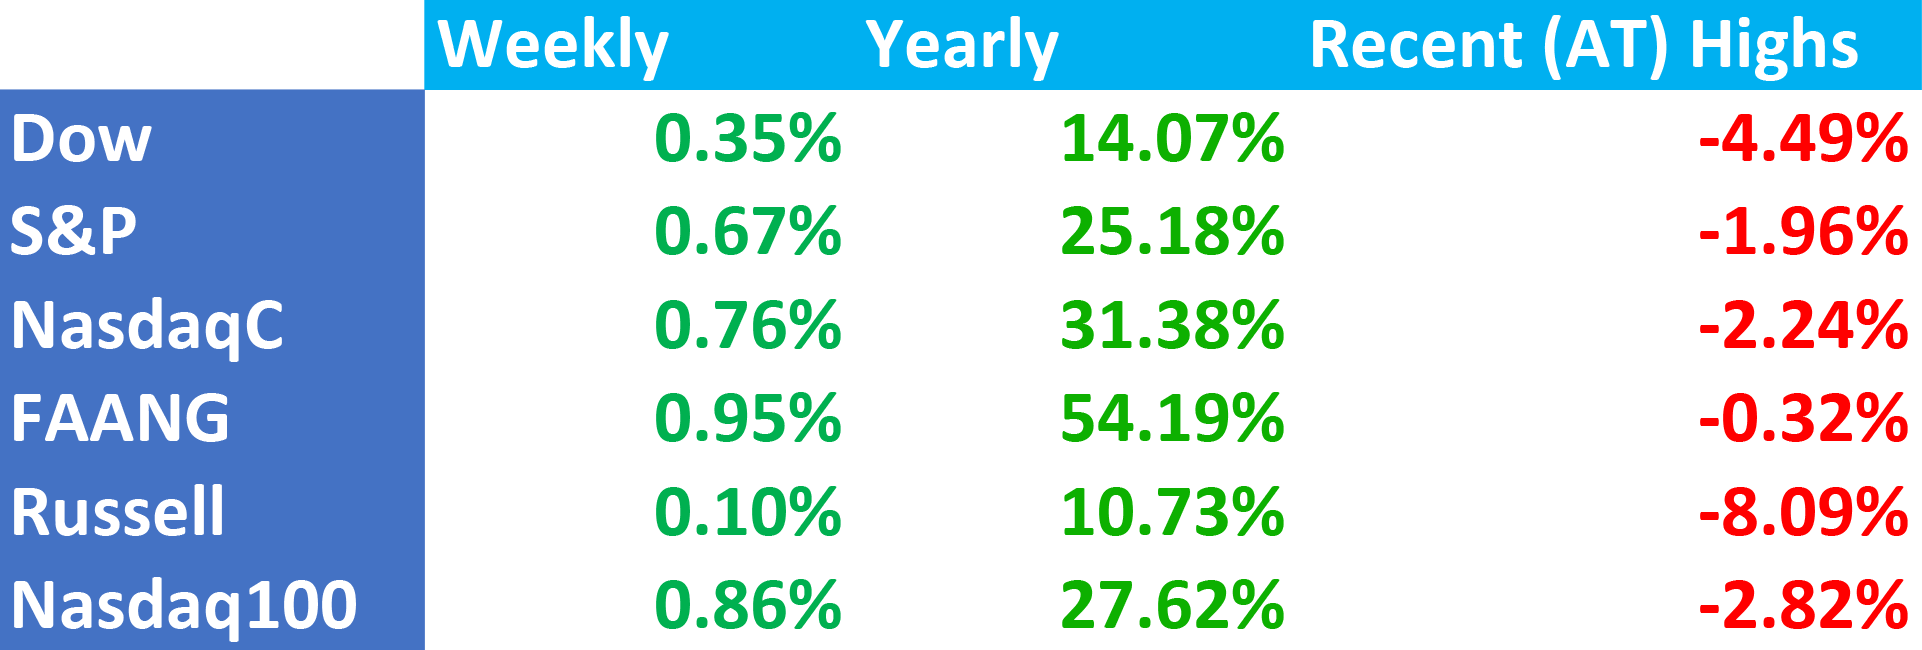
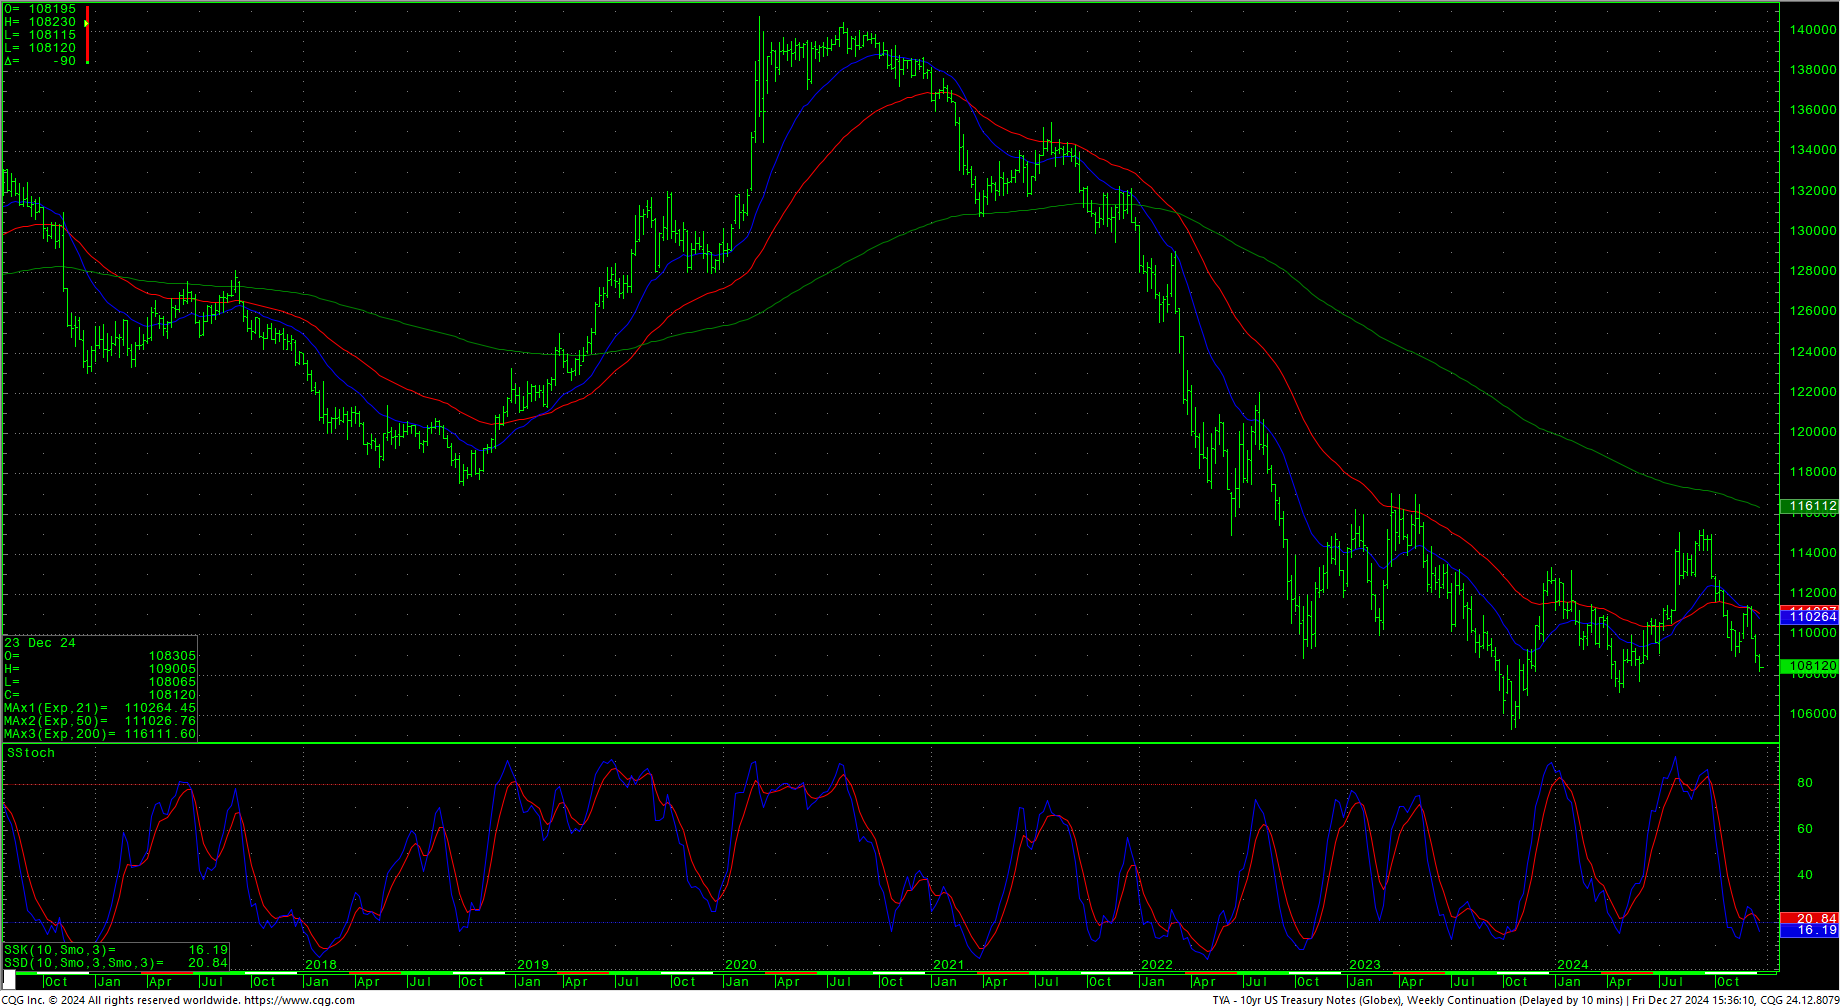
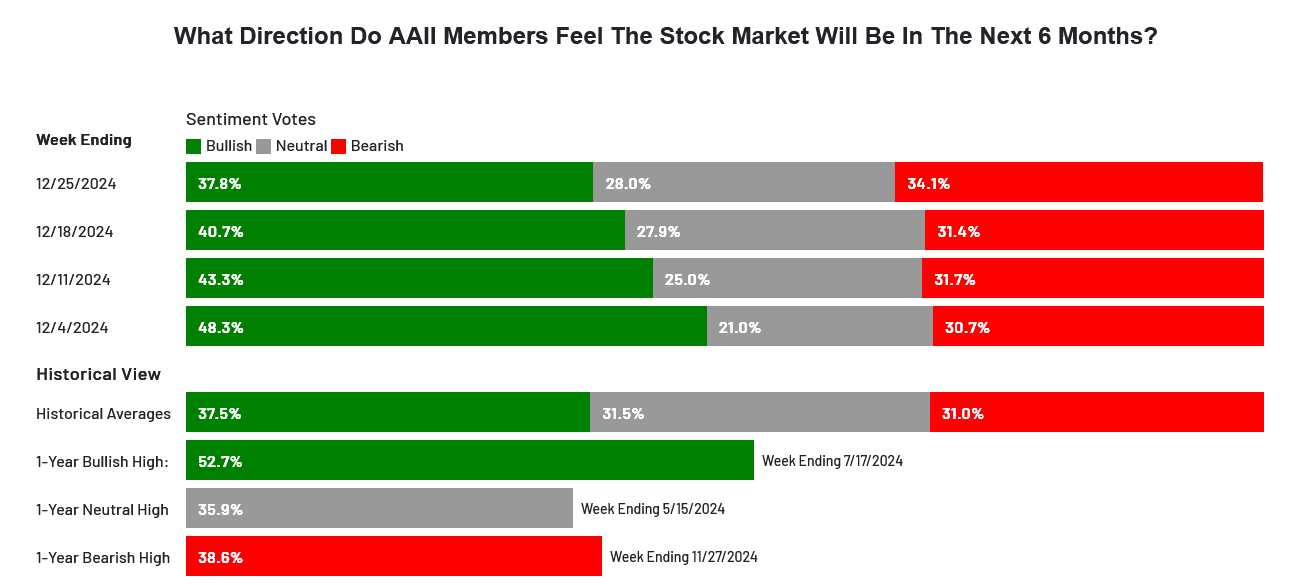 Sentiment leans toward fear. The CNN Fear and Greed Index remains in Fear. Breadth is weak but the McClellan indicator moved off the previous week’s new low for 2024 and shows extreme fear. Latest AAII Sentiment Survey did not update with the holiday: Neutral Sentiment Rises. The Dow A/D ended at 6697 with the MACD reaching low levels. The VIX ended in the lower portion of the weekly range. The Put/Call is at 0.65 and reads greed. The 52-week, A/D has plunged to new 2024 lows and is now negative at -0.92 and reads extreme fear. The Dow closed the week up +0.35%, closing in the middle of an inside week’s range. The S&P was up +0.67% in the middle of an inside week’s range. The Nasdaq Composite was up +0.76% and the Nasdaq 100 was up +0.86%. The FANG once again outperformed the overall market, closing up +0.95% in the lower half of an inside week’s range. The Russell closed up +0.10, also on an inside range. The 10-year notes traded lower most of the week and ended on the bottom of the weekly range at the lowest weekly close since 22 April 2024. The yield on the 10YR closed the week at 4.631%.
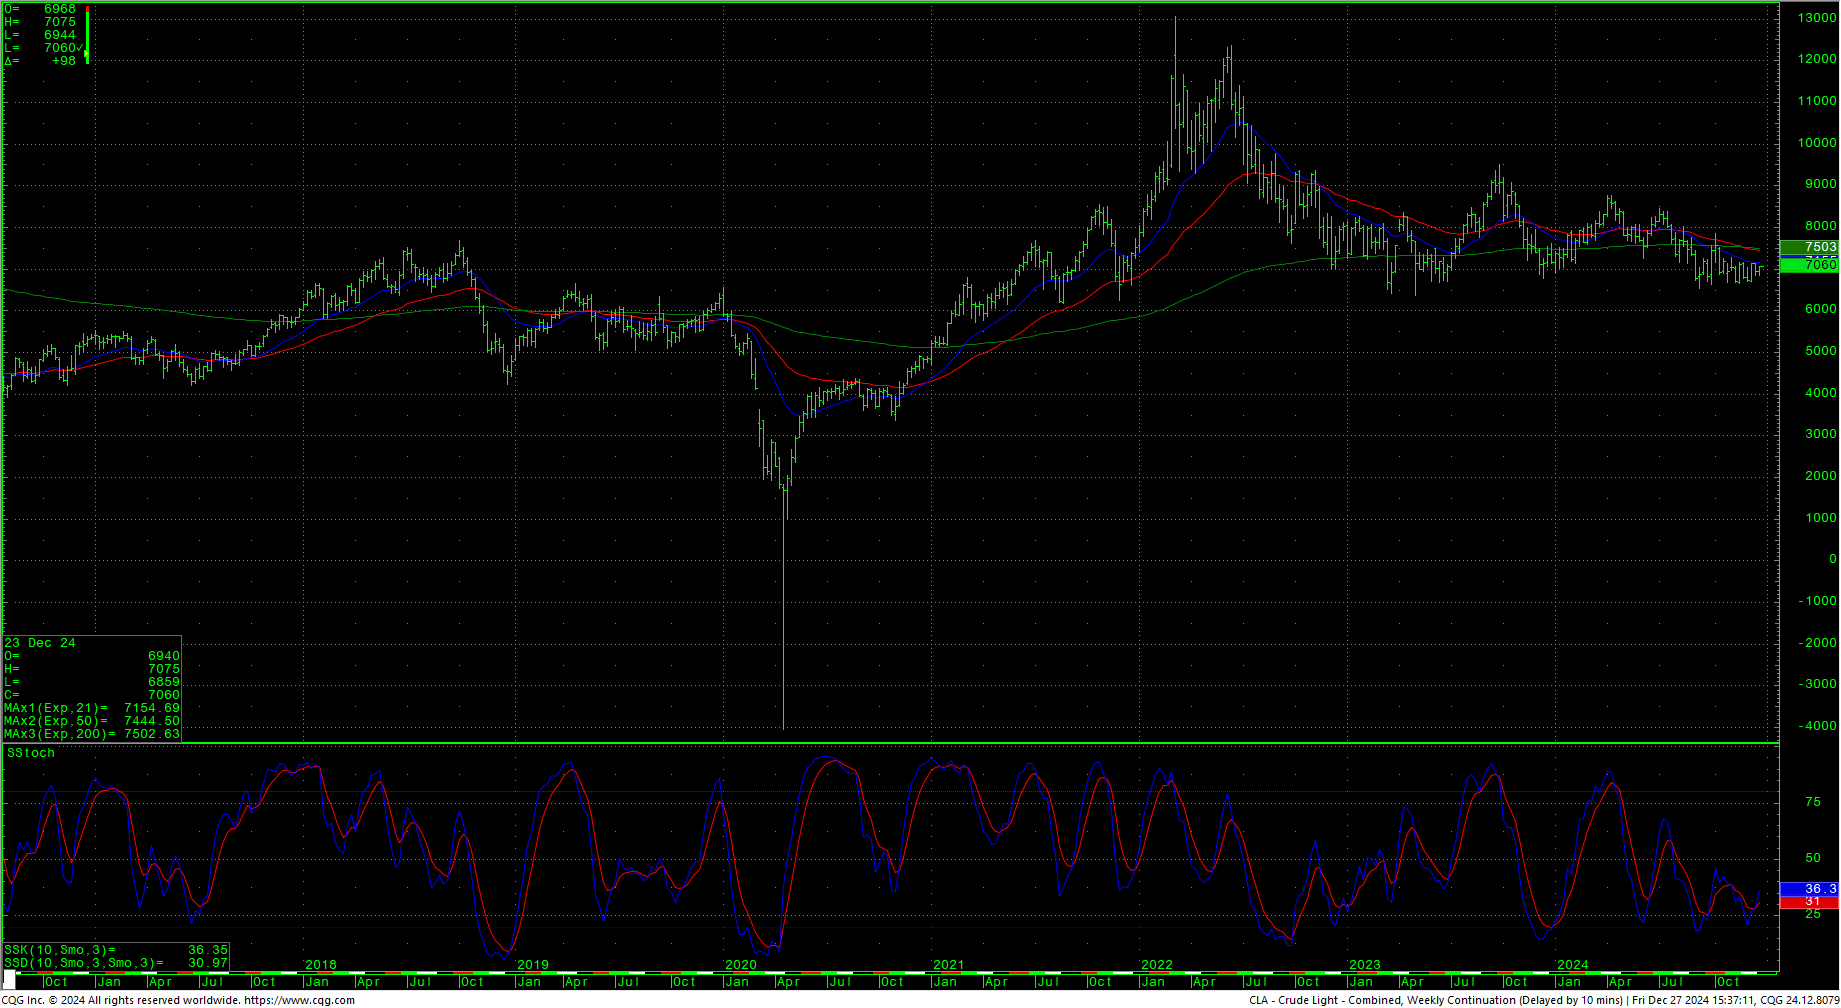
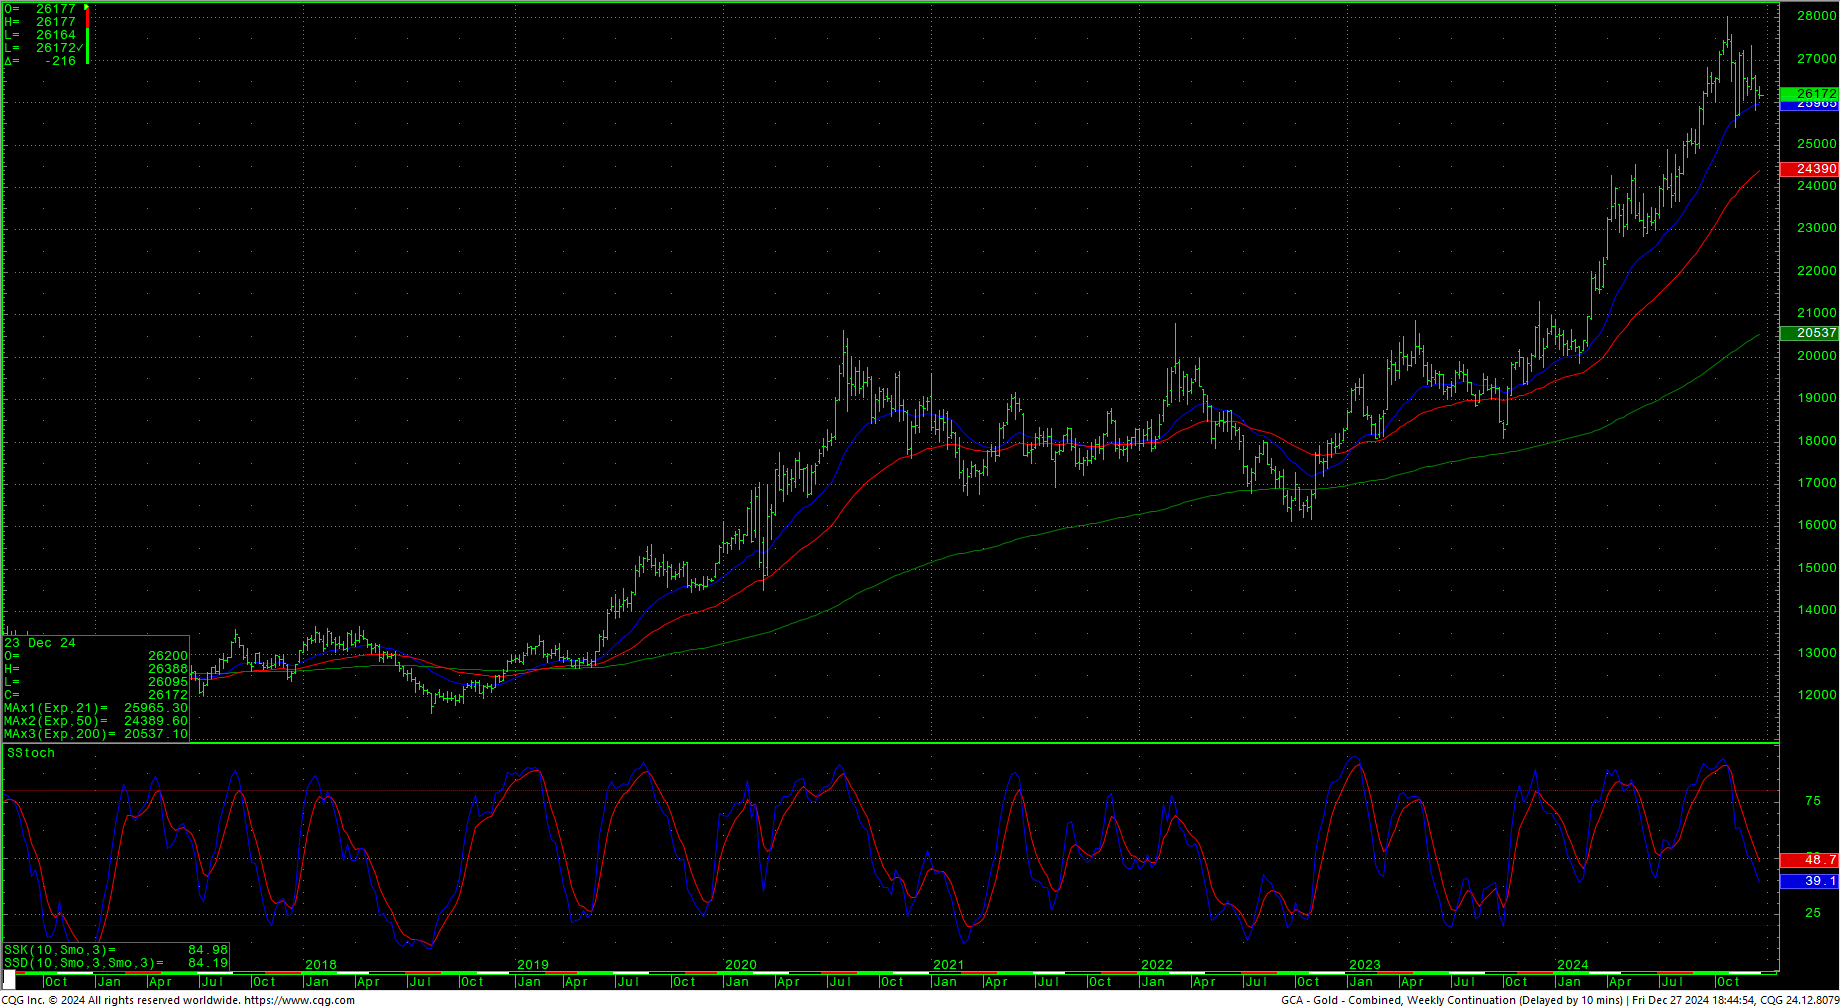
 The CRB Index was flat, closing down -0.12%. Crude oil closed higher, on the top of the week’s range as prices continue to wind up in an extremely tight nine-week trading range of 7228/6661. Gold closed lower on the bottom of an extremely tight holiday range. The CoT for the S&P 500 shows little change in a very quiet week. The CFTC S&P 500 Non-Commercial Net Positions did not report this week and still shows -39.9K which may signal short selling. The non-commercials position is shrunk down to a two-day window.
Timing Points
Monday marks strong daily timing. Happy New Year!
- 12/30 ***
- 01/03 **
- 01/09 ***
- 01/14 *** X critical
Dow Jones Industrial Average
Dow Jones Industrial Average Hourly H-L-C
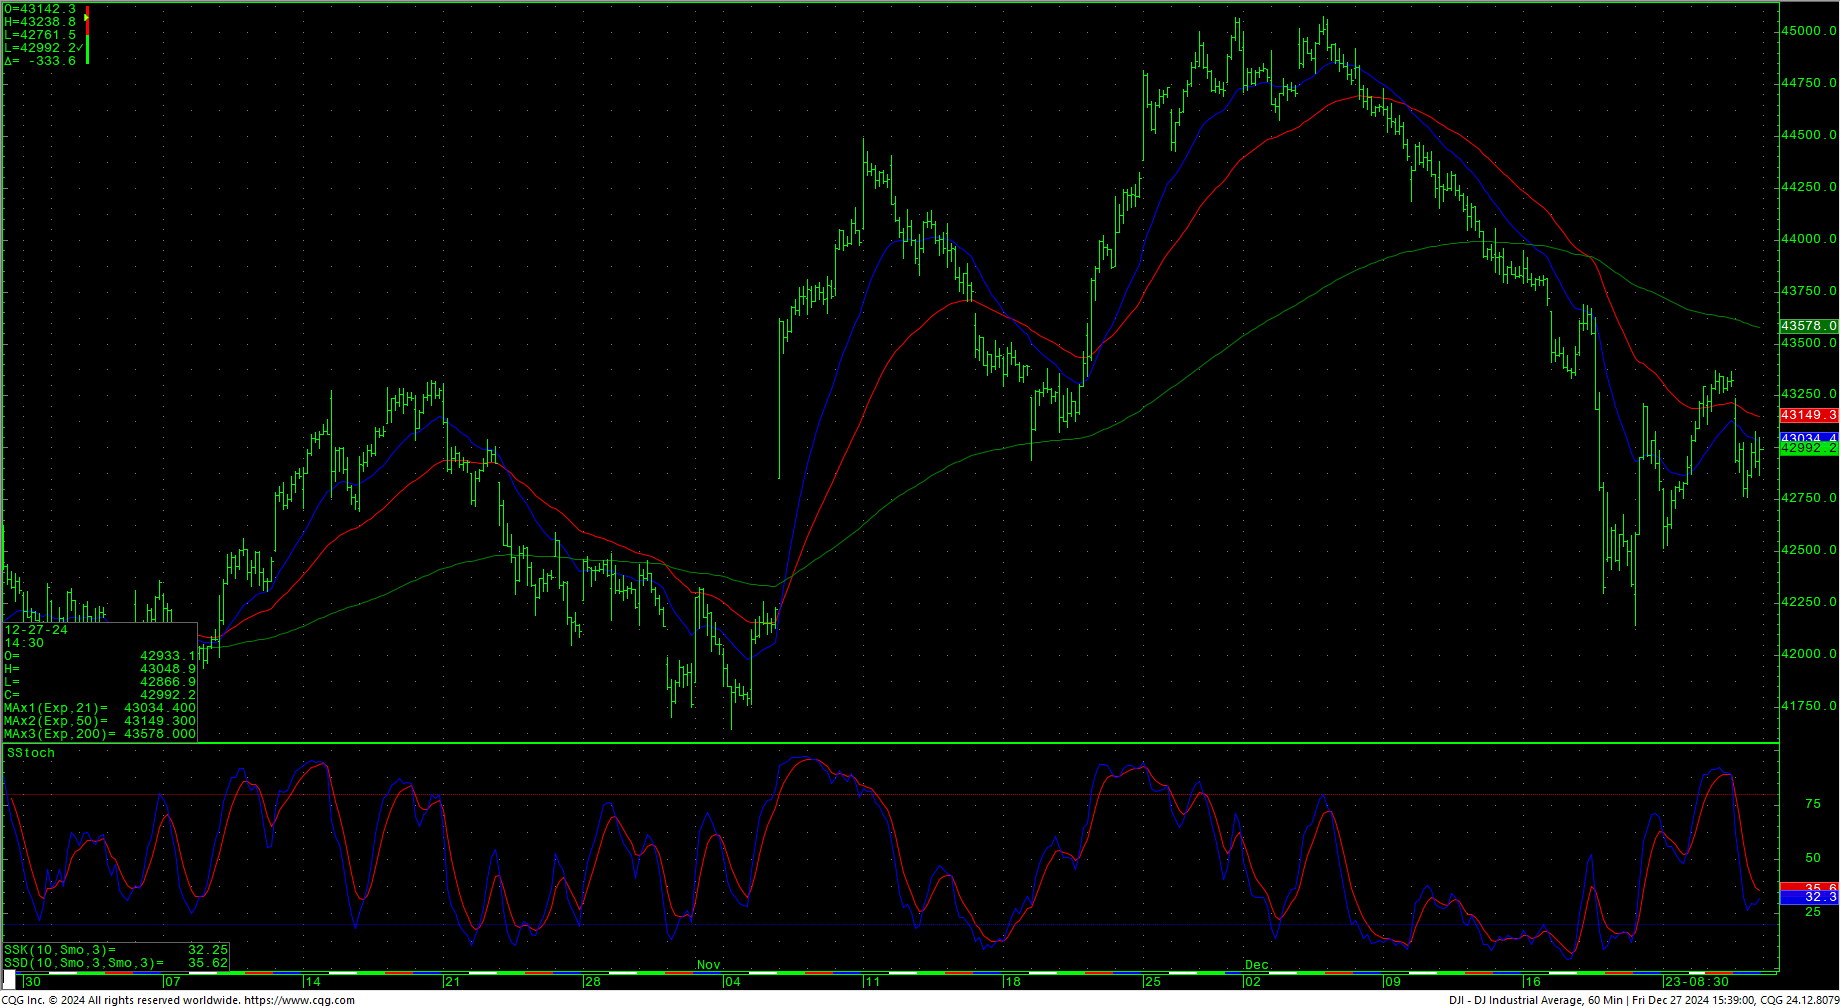 The Dow traded a tight inside holiday week. See the comments above for a deeper analysis of the two key indicators facing the Dow. The daily is building a flag pattern off the previous week’s lows as it relieves the oversold conditions. Prices traded back to the 50-day MA intraweek and remain under that indicator. The weekly is rolling over from overbought conditions as it reacts to a bearish divergence. The hourly ended the week basically neutral and the action does little to the numbers. The 200-day MA starts the week at 41044. The market is heading into the final two trading days of the month at the lower end of a monthly reversal range.
Dow Jones Industrial Average Monthly H-L-C
 Dow Jones Industrial Average Weekly H-L-C
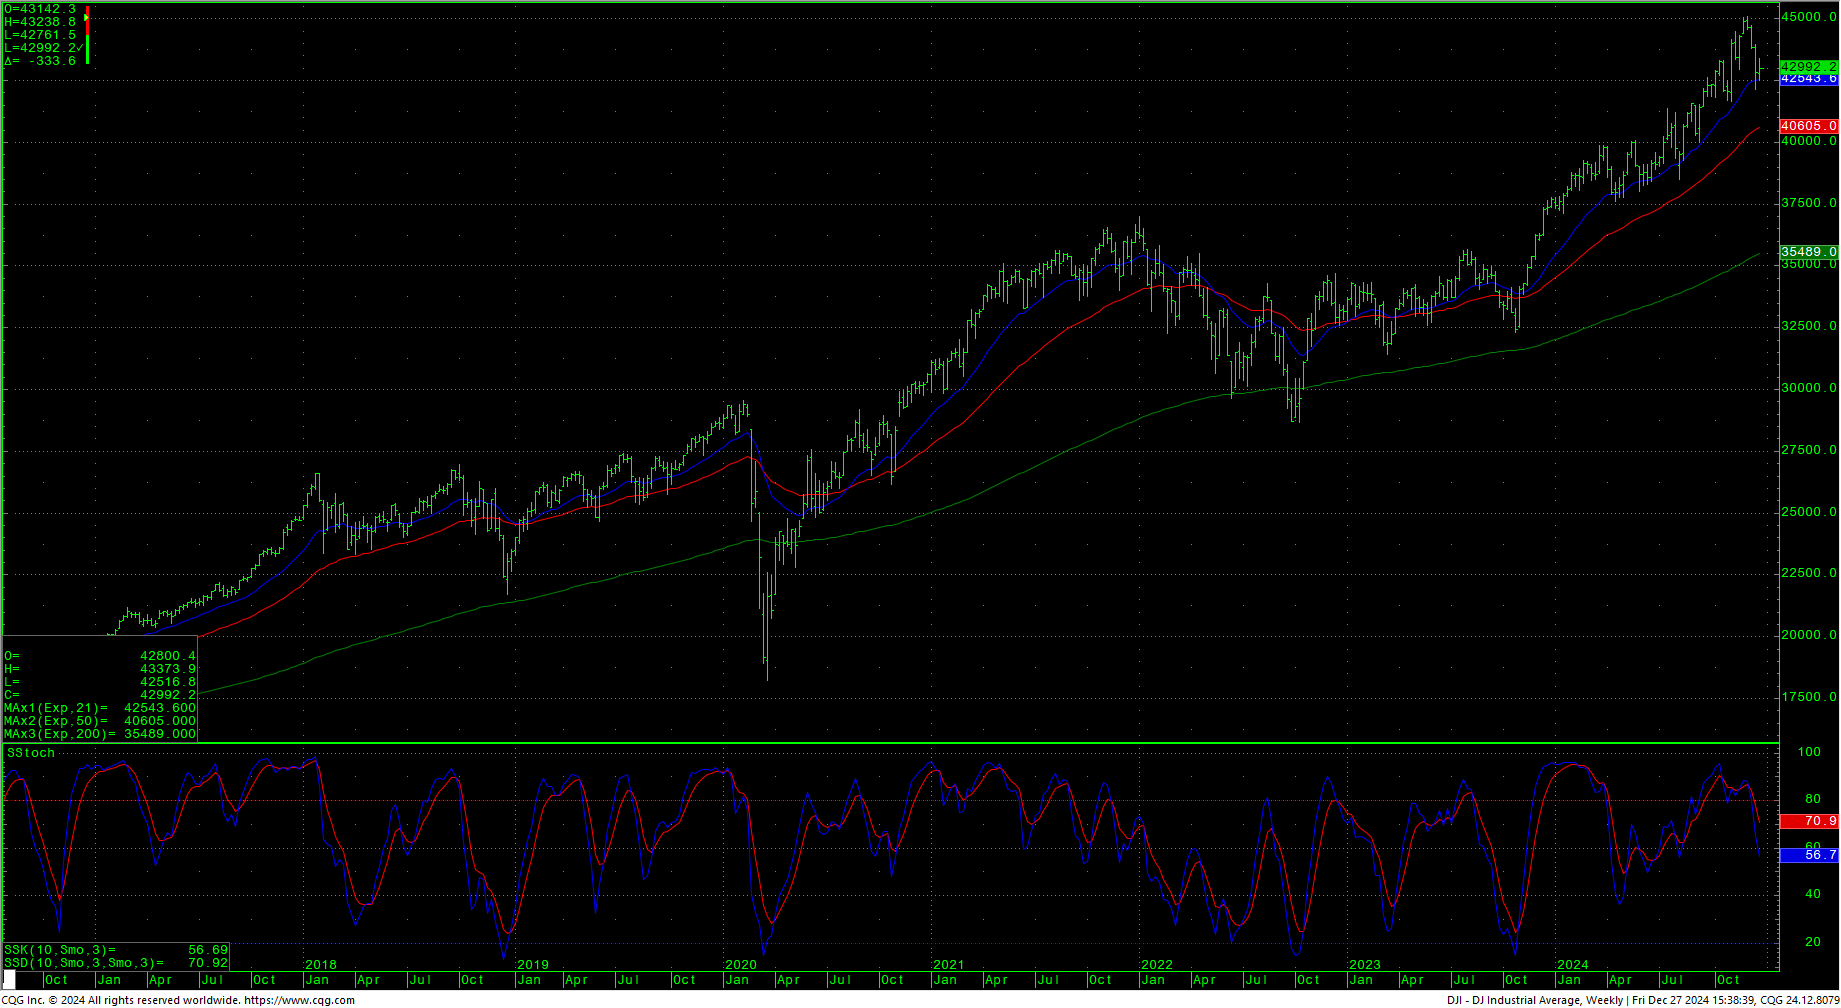 Support short-term is at 42904, key at 42762/42760 and pivotal at 42615/42612. Under 42612 should test 42453 with critical/pivotal near-term support at 42146/42123 and critical short-term support at the 41933/41925 level. Closes under 41925 should test 41647 and 41263 through 41192. Closes under 41192 opens counts toward the 40000/39993 area.
Dow Jones Industrial Average Daily Candles
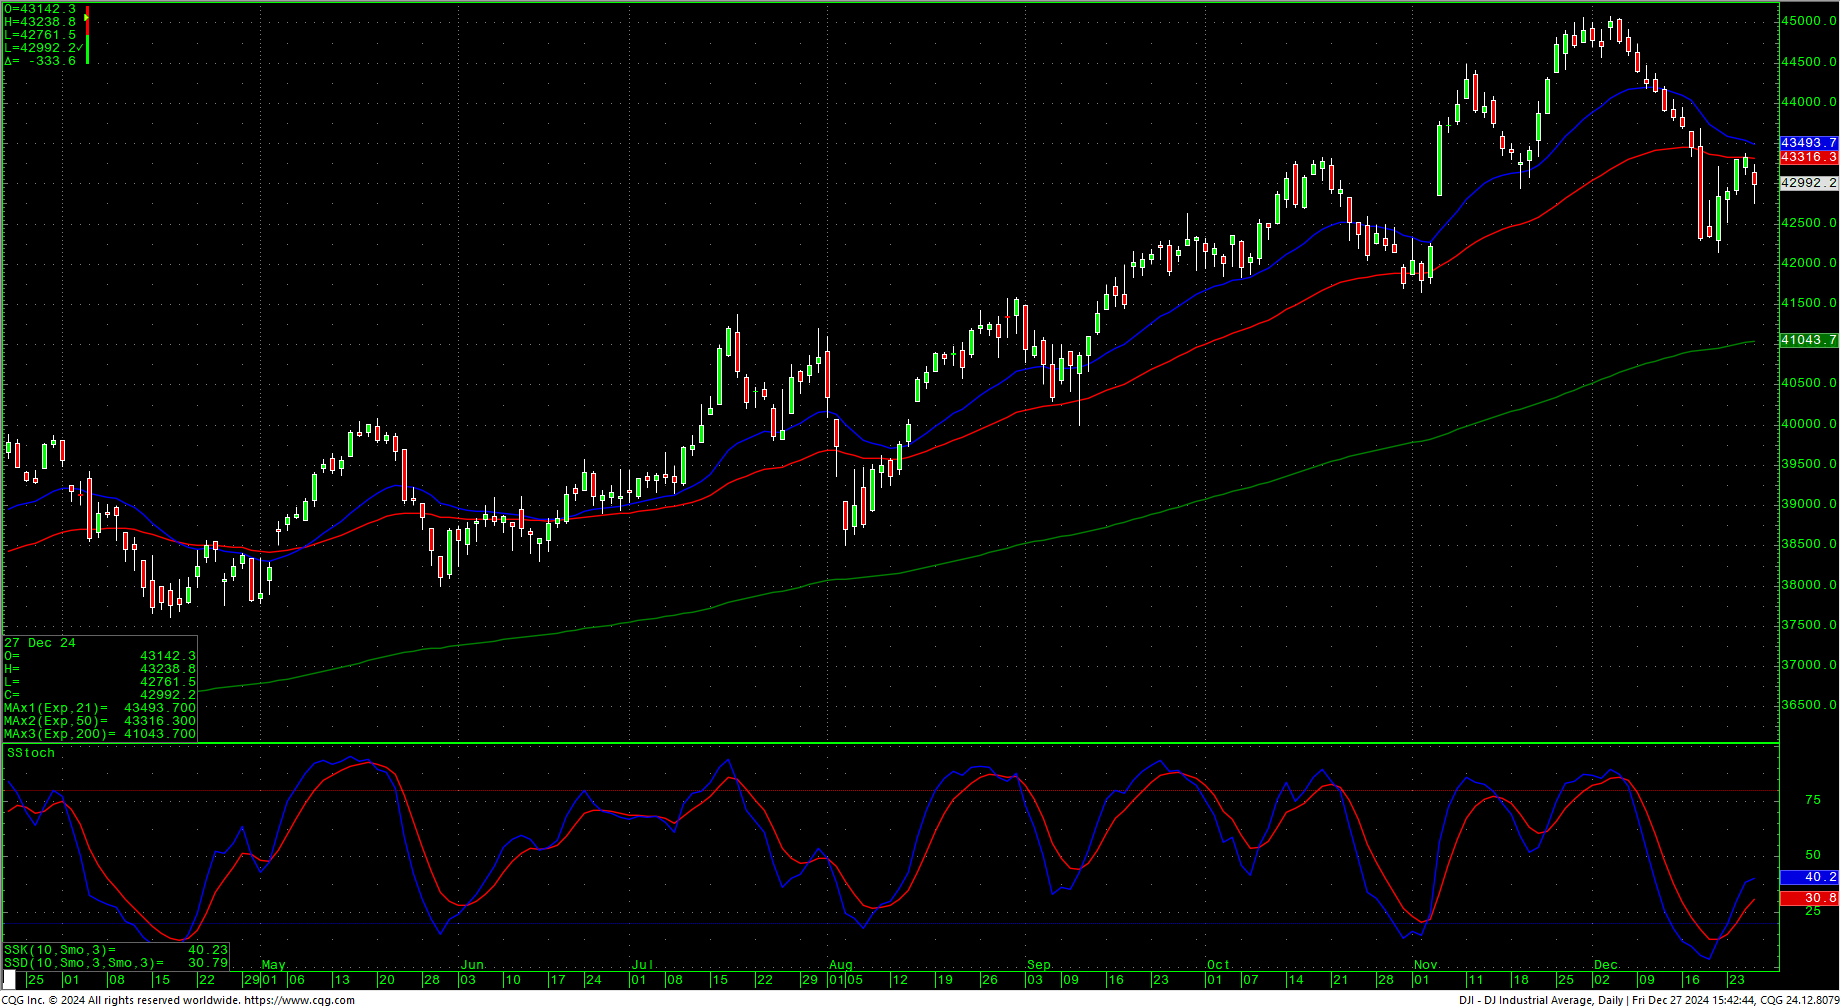 Resistance is 43264, 43373/43375, 43609 and 43955/43960. A breakout over 43960 should test 44341 through 44382. Closes over 44382 set up a retest of the intraday trading highs against the 45073/45074 level. Closes over 45074 opens counts toward 45244 and 45426 (Fibonacci target). Rallies with closes over 45426 will reopen longer-term monthly targets in the 47400 level with targets of 46568 and 46954.
| Resistance | Support |
|
|
S&P 500 Cash Index
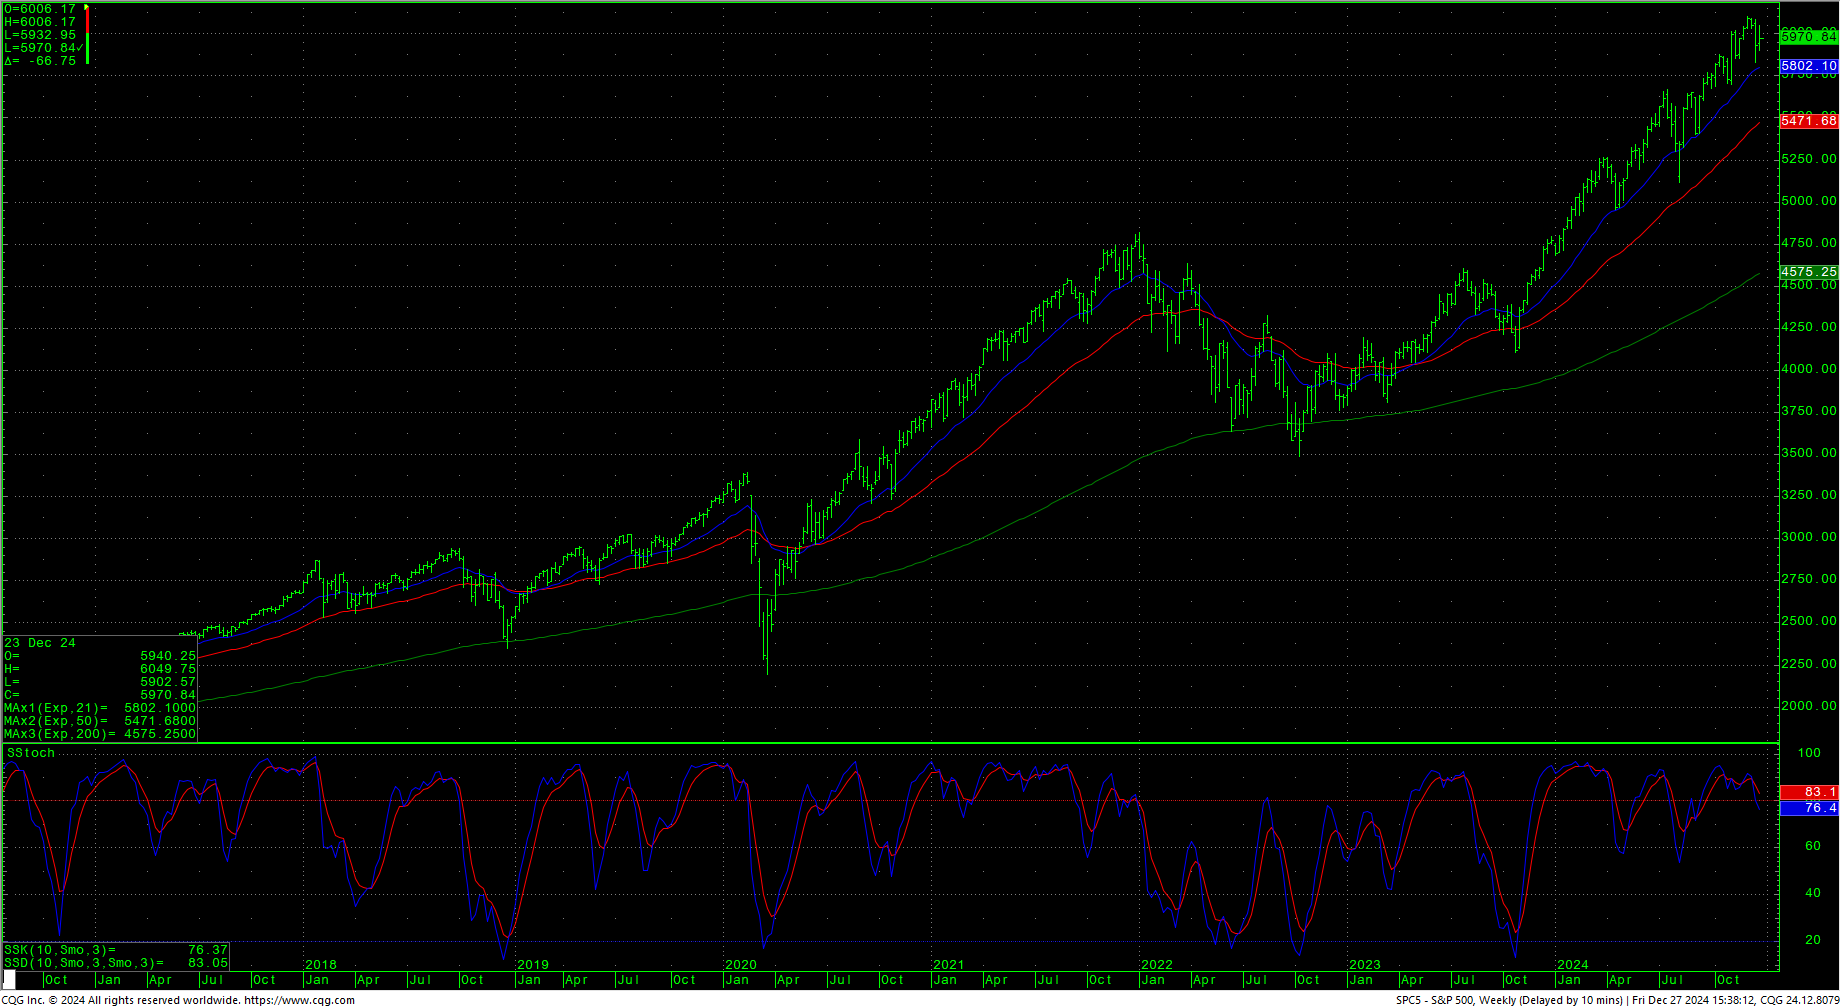
S&P 500 Index Weekly H-L-C
 S&P 500 Index Daily Candles
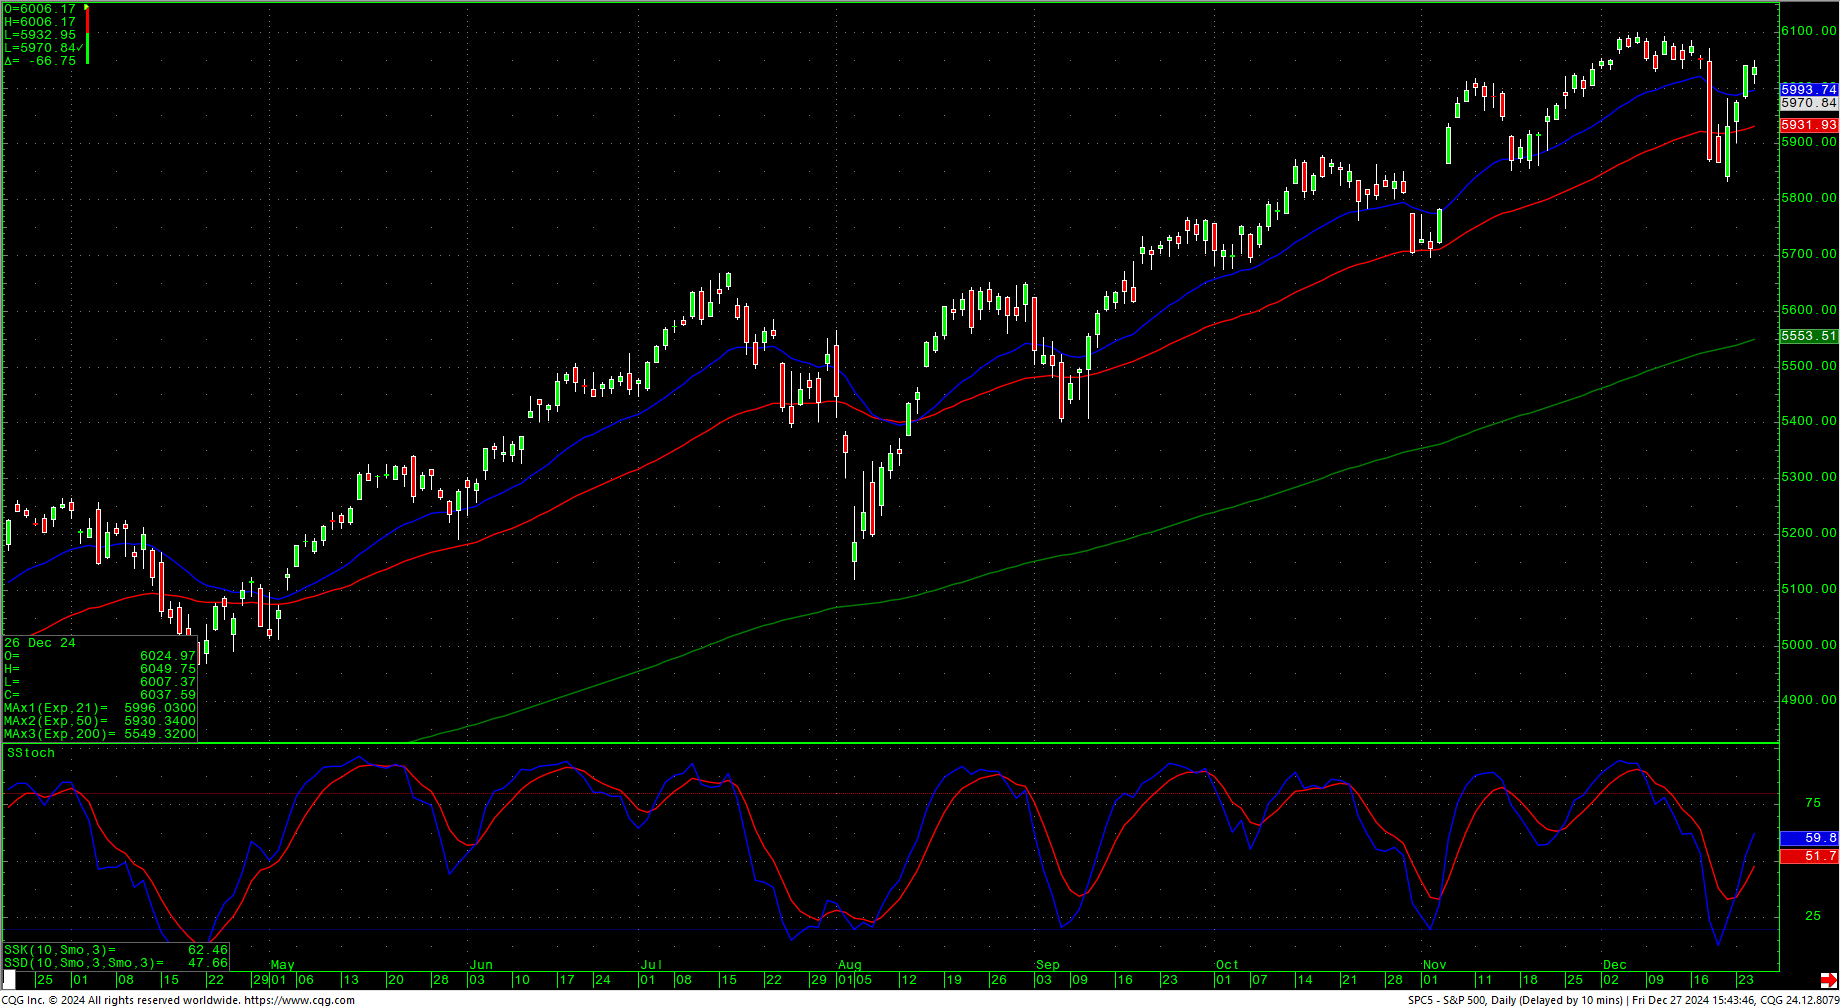 The S&P traded higher most of the week and tested the trendline breakdown before selling off late Friday in quiet holiday trade. The daily is relieving the oversold conditions and weekly is trying to roll over with a bearish divergence showing. The 200-day MA is 5554.
S&P 500 Index Hourly H-L-C
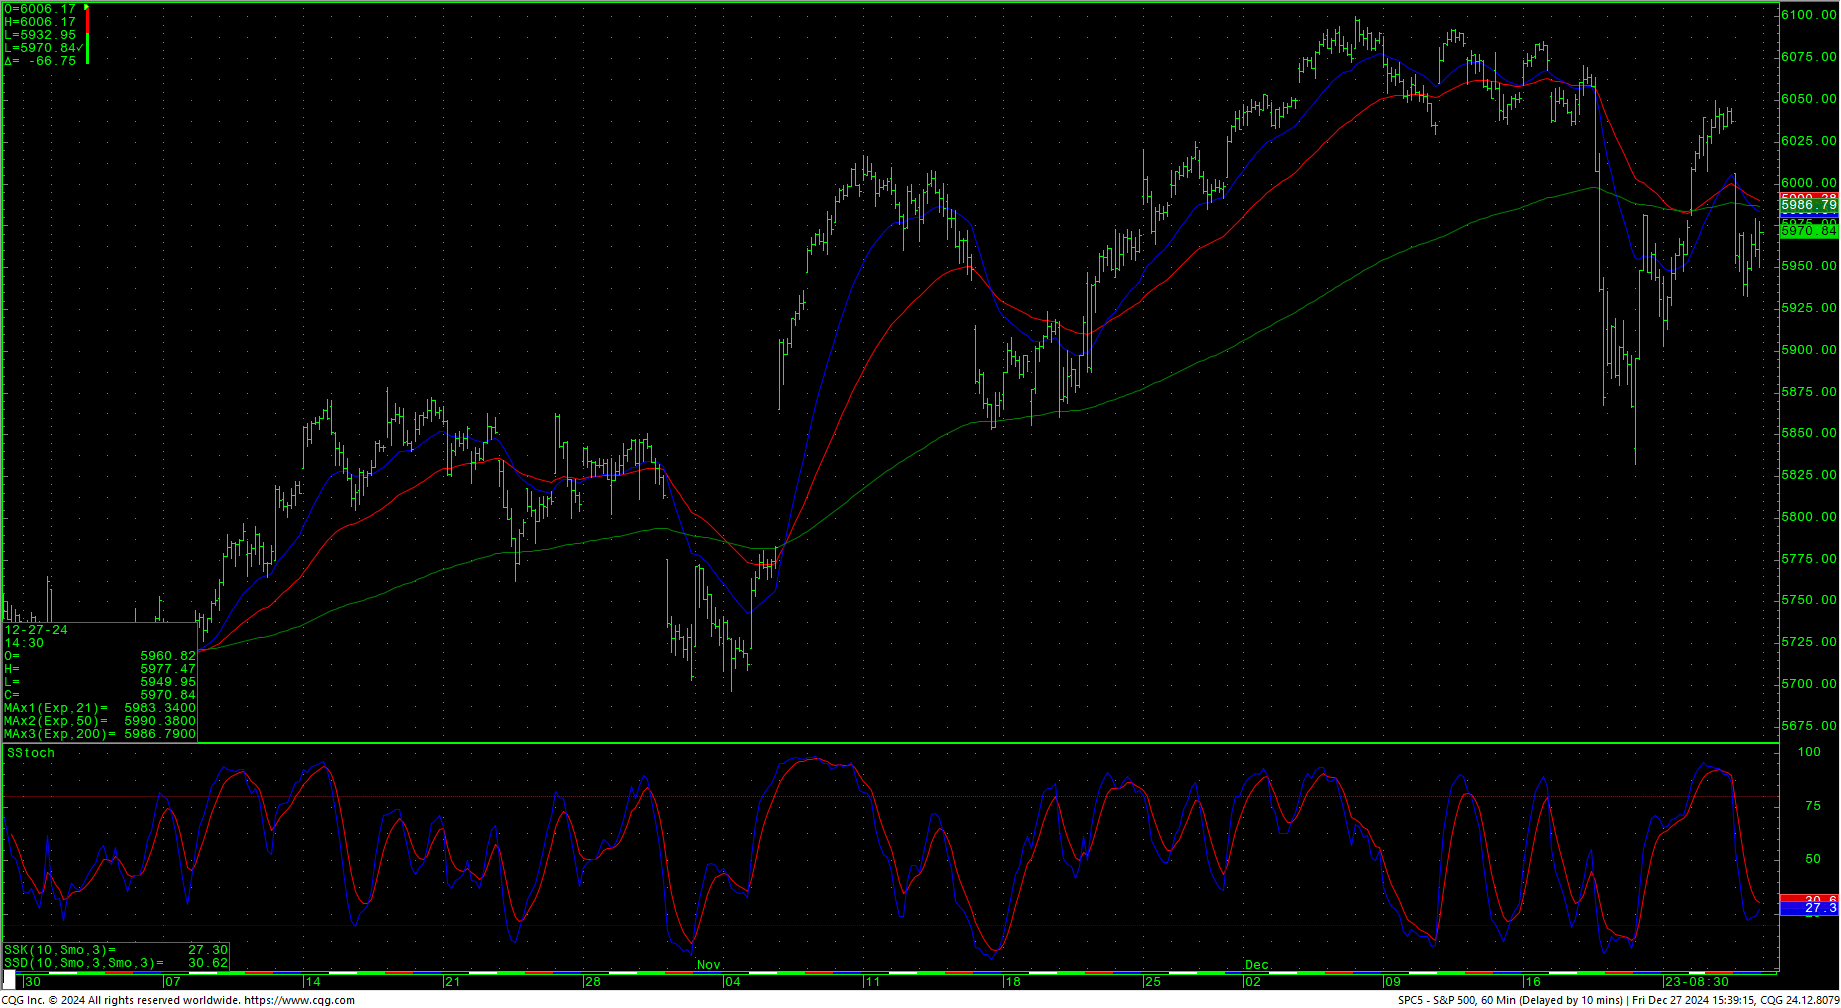 The hourly ended in slightly oversold conditions as it builds a flag. The market recovered 80% of the entire decline as It sites just under 2% from the record high. Resistance remains pivotal at 5997/6000. A drive back above 6000 sets up 6034/6036 and 6049/6050 with potential to carry back to the intraday highs at 6095/6100. Above 6100 should see 6115 and ultimately 6152. Closes over 6152 open counts to 6224 and 6296. Above 6296 can carry to 6368 with counts into the 6440 area. Closes over 6440 will open counts to 6584. A breakout over 6584 sets up 6638 and 6692.
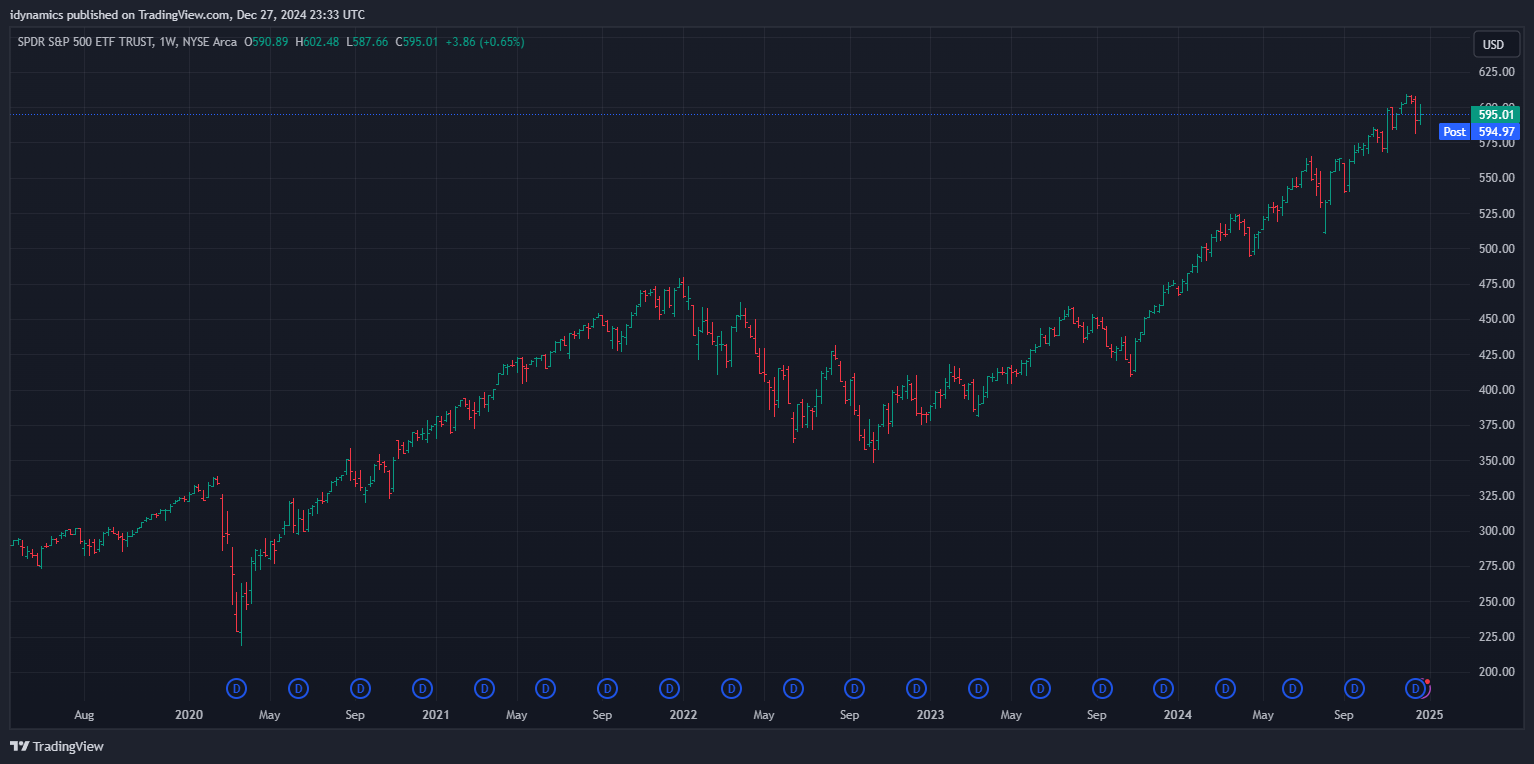
SPY Weekly
 Support remains at 5942 and 5915/5913. A breakdown under 5913 can retest 5886 with counts to 5832/5825. Closes under 5825 have potential to carry toward the 5662 level. Closes under 5662 setup 5526 with potential to critical short-term support of 5391/5388. Daily closes under 5388 sets up 5240/5224 with full counts to 5120/5119.
| Resistance | Support |
|
|
Charts courtesy of CQG, Inc., CNN, Koyfin, Trading View and AAII


