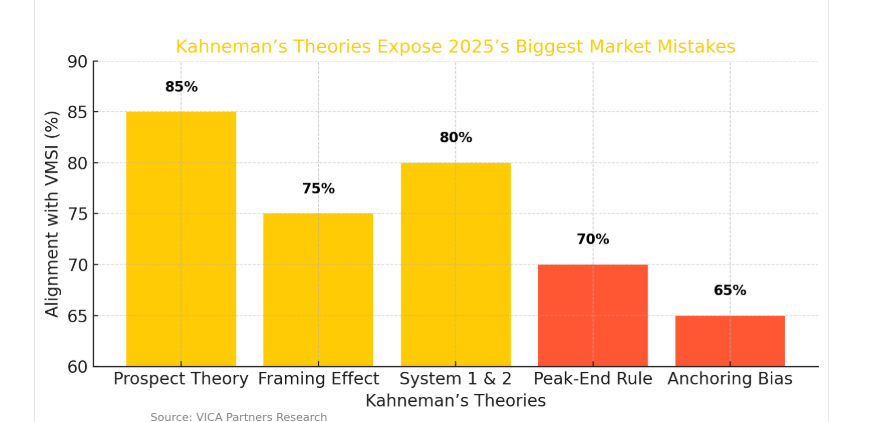
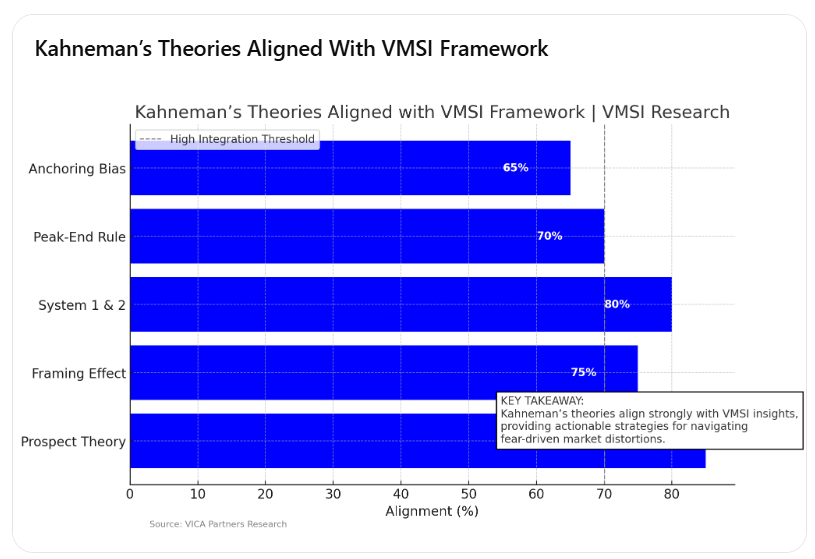
Kahneman’s Theories Aligned with VMSI Framework
Introduction: The Psychology Trap: How Investors Are Missing 2025’s Best Opportunities
In early 2025, defensive sector inflows increased 17% — yet sectors with stable fundamentals faced unjustified selloffs. Institutional investors quietly rotated back into growth sectors, revealing a significant disconnect between perception and reality. This emotional response has created substantial opportunity for those who recognize it.
investors consistently misjudge probabilities, value, and risk — not because they lack data, but because they’re wired to make flawed decisions. By integrating Kahneman’s theories with the VMSI framework, investors can uncover overlooked risks, exploit emotional overreactions, and seize tactical opportunities.
-
Prospect Theory: The Loss Aversion Paradox
Kahneman’s Insight: Losses loom larger than gains — investors overreact to potential losses, driving irrational selling behavior.
Market Impact: Recent defensive sector spikes reveal investors scrambling for safety despite improving earnings in key growth sectors. Fear-driven outflows from tech and consumer discretionary have widened valuation gaps.
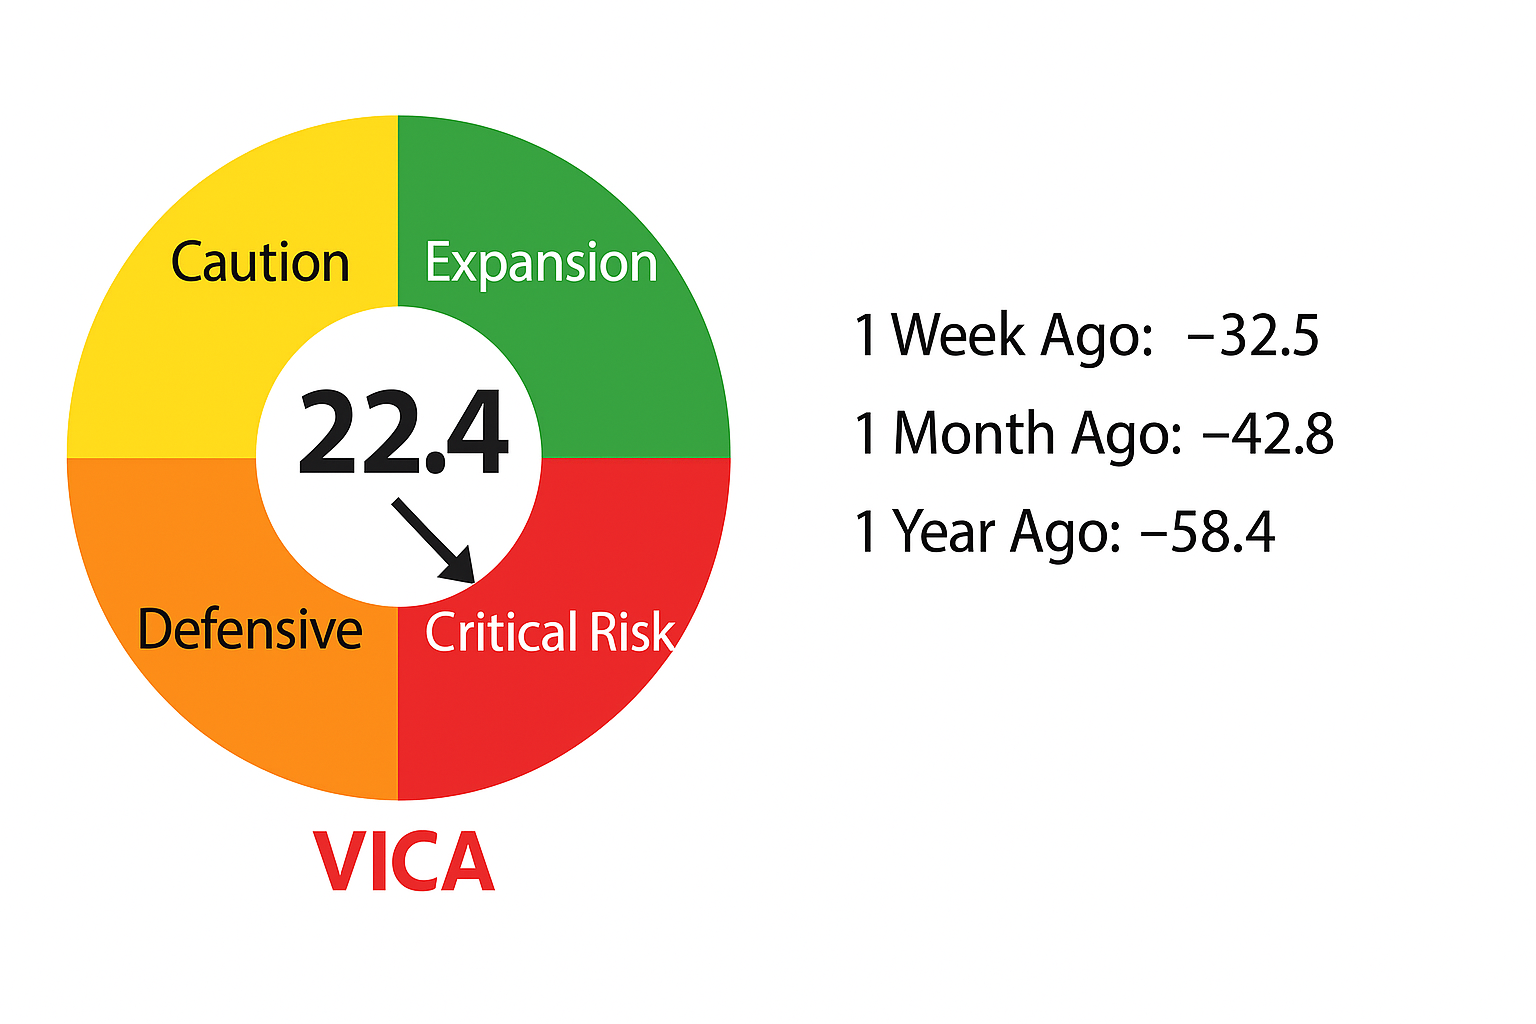
VMSI Insight: The latest Volatility & Risk Hedging Chart reveals defensive positioning accelerating despite stabilizing macro conditions — a textbook loss aversion scenario.
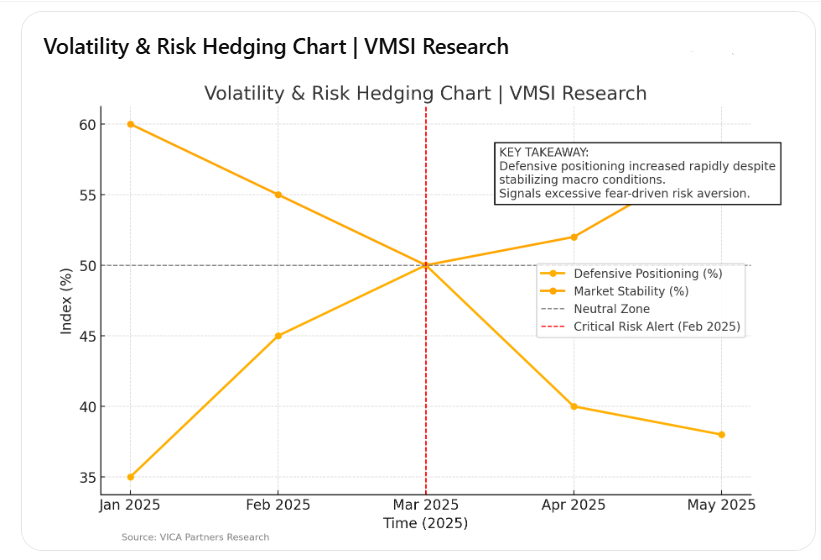
Volatility & Risk Hedging Chart
Strategic Opportunity:
- Identify sectors with earnings stability that have experienced disproportionate selloffs. Undervalued tech and mid-cap growth stocks may present asymmetric upside as risk aversion subsides.
-
Framing Effect: Perception vs. Reality
Kahneman’s Insight: Investors’ choices are shaped by how information is presented, not by its underlying value.
Market Impact: Media narratives framing market corrections as “crashes” have triggered excessive outflows from sectors showing minimal fundamental deterioration.
VMSI Insight: The Liquidity Flows Chart reveals a sharp rise in institutional reinvestment despite public panic — signaling informed positioning in mispriced assets.
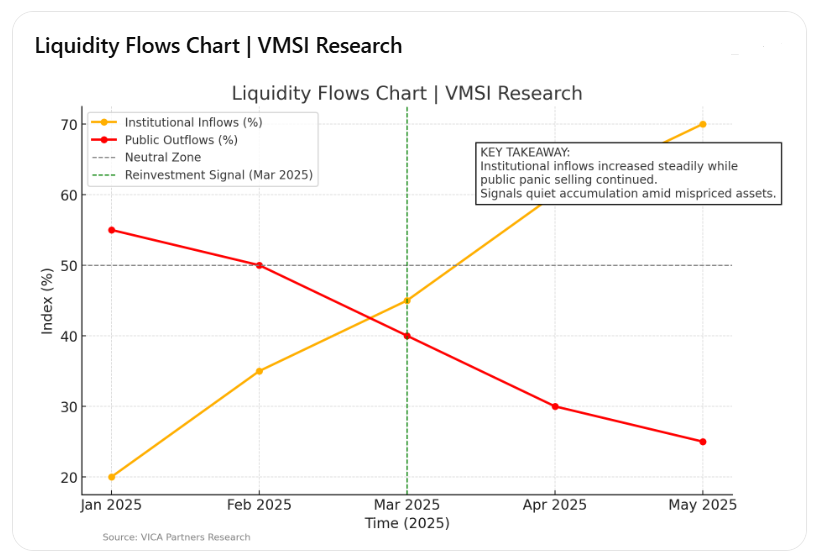
Liquidity Flows Chart
Strategic Opportunity:
- Identify sectors where negative media framing has distorted public perception. Energy, utilities, and select industrials may offer attractive entry points.
-
System 1 vs. System 2 Thinking: The Impulse Trap
Kahneman’s Insight: Investors rely on fast, instinctive (System 1) thinking rather than deliberate, analytical (System 2) reasoning when reacting to volatility.
Market Impact: Recent market selloffs have triggered impulsive selling in ETFs and index funds, despite underlying sector strength in key industries.
Example: In February 2025, ETF outflows peaked at $3.4 billion in one week — yet underlying tech and biotech companies delivered strong revenue guidance. This reaction-driven selloff resulted in rapid rebounds for patient investors.
VMSI Insight: The Market Momentum Chart reveals patterns where impulsive exits created rapid rebounds for disciplined investors.
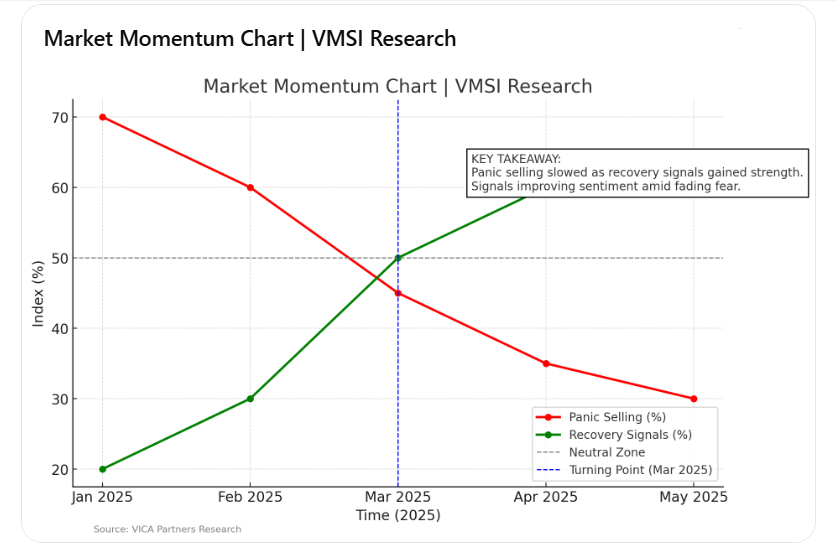
Market Momentum Chart
Strategic Opportunity:
- Counteract emotional trading by identifying sectors that stabilized quickly post-selloff. Healthcare, cloud services, and infrastructure plays stand poised for steady recovery.
-
Peak-End Rule: Misjudging Market Cycles
Kahneman’s Insight: Investors recall market conditions based on emotional peaks and recent performance, not full-cycle analysis.
Market Impact: The early 2025 volatility spike remains fresh in investors’ minds, skewing perception of ongoing risk despite moderating indicators.
VMSI Insight: The VMSI Timeline Chart highlights rapid sentiment shifts, signaling opportunity in sectors where fear-driven pricing has persisted.
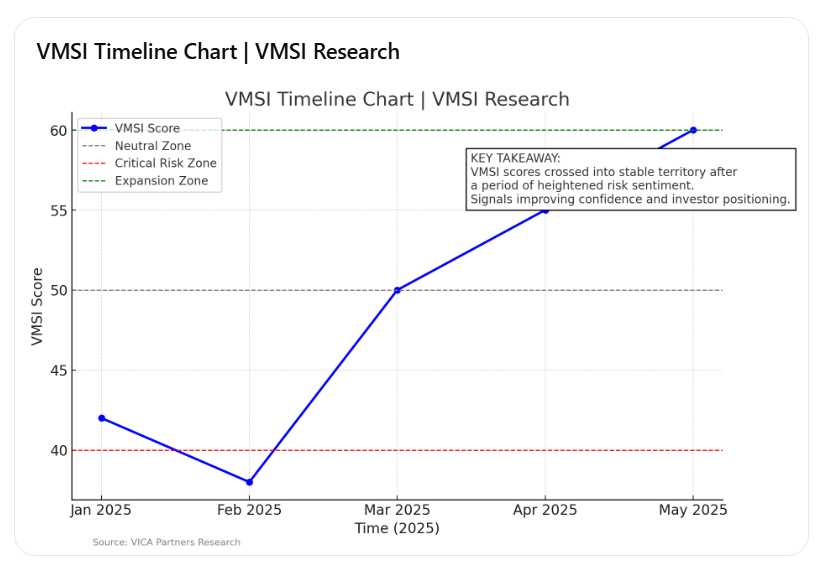
VMSI Timeline Chart
Strategic Opportunity:
- Focus on sectors that suffered from exaggerated downturns yet show improving fundamentals — REITs, green energy, and diversified financials may be poised for recovery.
-
Anchoring Bias: Outdated Valuation Traps
Kahneman’s Insight: Investors rely excessively on historical data, anchoring to outdated benchmarks despite shifting conditions.
Market Impact: Investors continue referencing pre-2022 tech valuations, ignoring recalibrated revenue models and profit structures.
VMSI Insight: The Defensive Sector Performance Chart shows outperformance in sectors long considered “safe,” despite weaker earnings momentum.
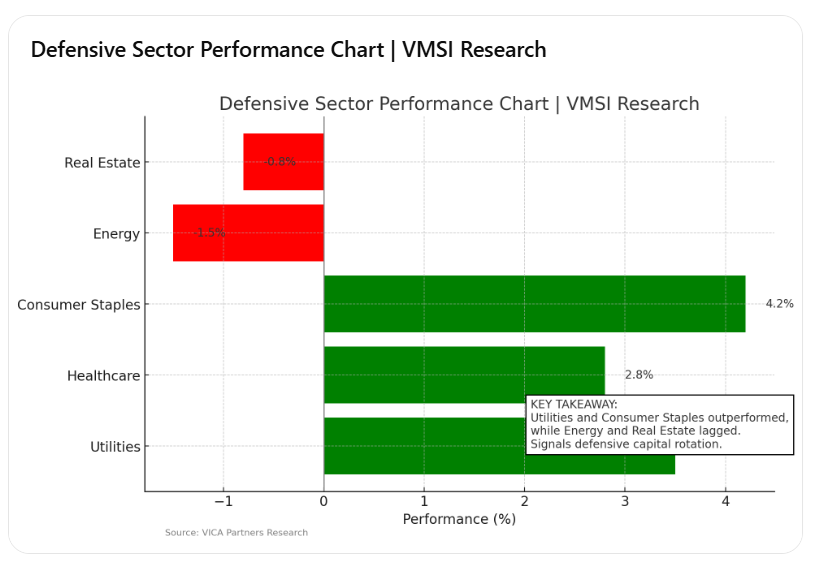
Defensive Sector Performance Chart
Strategic Opportunity:
- Challenge legacy valuation assumptions and target sectors undergoing operational improvements despite outdated narratives — materials, consumer staples, and select digital platforms stand to benefit.
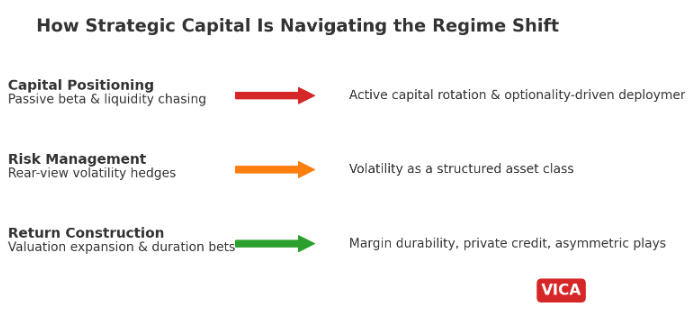
Conclusion: Winning in 2025 by Mastering Market Psychology
Behavioral finance reveals that investors are rarely rational — they are emotional, impulsive, and prone to misjudging risk. By aligning behavioral finance principles with the VMSI framework, investors can recognize fear-driven distortions and uncover tactical opportunities that others overlook.
Strategic Focus for Investors:
- Exploit loss aversion by identifying undervalued sectors amid panic selling.
- Watch liquidity trends for quiet institutional accumulation.
- Use VMSI insights to counter emotional peaks and framing distortions.
Investors who anticipate these behavioral pitfalls — and align strategy with data, not emotion — will have the upper hand in 2025’s volatile markets. For deeper insights on how VICA Partners applies these behavioral principles to market strategy, contact us today.
Disclaimer: This report is for informational purposes only and should not be considered financial advice. Investors are encouraged to conduct their own research or consult with a professional advisor before making investment decisions. Market conditions can change rapidly, and past performance does not guarantee future results.