
Liquidity Compresses — AI Sustains — Credit Defines.
Markets remain steady, but conviction is increasingly mechanical. Liquidity keeps valuations suspended — the S&P 500 trades near 20.3× forward earnings, a marginal compression from last week — while leadership remains locked in AI-driven megacaps. Motion endures, yet the source of motion has inverted: flow now creates belief, not the other way around. Machines supply direction; fundamentals supply context.
Execution capacity stays efficient, but absorption is thinning. Liquidity functions reflexively — fast in transmission, fragile in depth. Each incremental unit of flow yields less stability, confirming a neutral-absorptive equilibrium. Credit spreads hold firm (HY ≈ 345 bps · IG ≈ 112 bps), but torque sensitivity rises; price and confidence have become the same variable.
Regulators monitor regional-bank and CRE exposures as roughly $1.8 trillion in loans approach maturity; office CMBS delinquencies near 6.1 %, the highest since 2012. Stress remains containable, but liquidity’s role has shifted — it no longer expands value; it preserves structure. The system still clears, but increasingly as its own signal: reflexive, disciplined, and self-referential.
Weekly Summary — Week Ending November 6, 2025
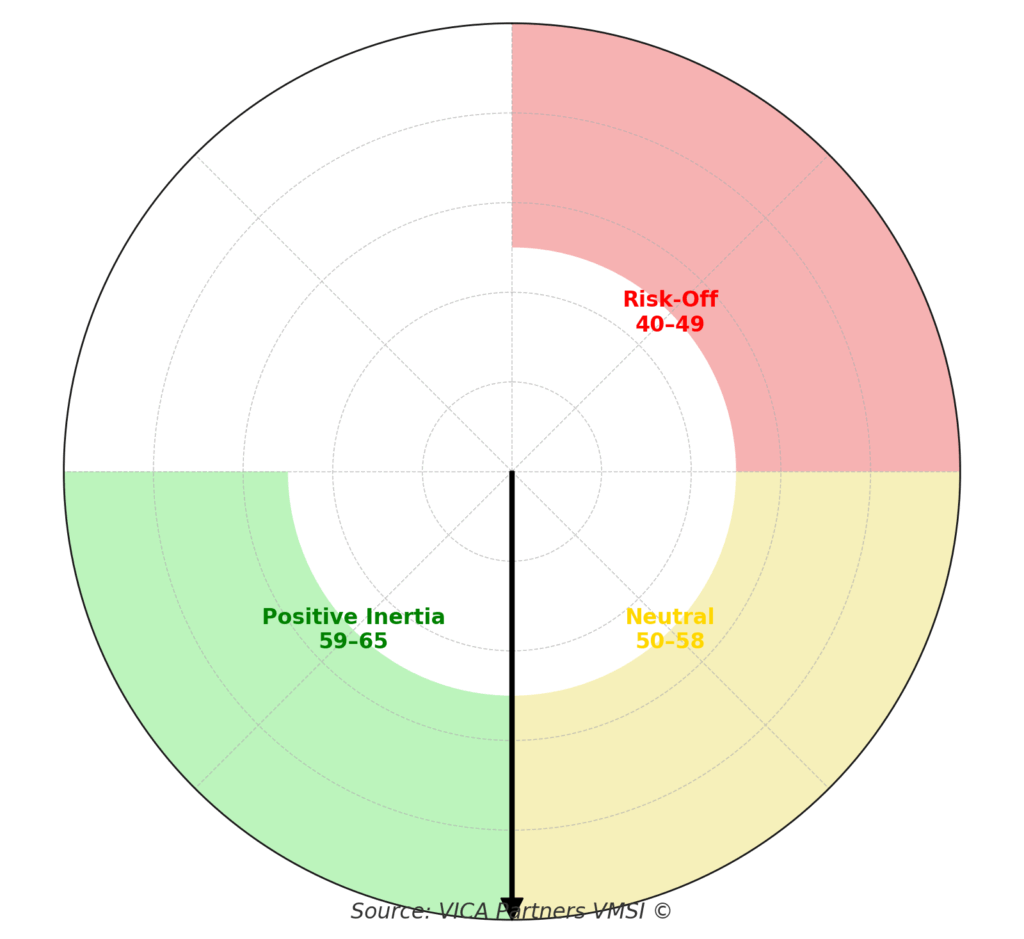
VMSI Composite: 59.3 — stable in neutral-absorptive equilibrium. Sub-components: Liquidity 60.9 · Momentum 58.6 · Volatility & Hedging 59.2 · Safe Haven 59.4. Liquidity remains the system’s core constant — efficient, but slower in renewal. Momentum confirms continuation without expansion, while Safe Haven positioning reflects hedging, not fear. The equilibrium holds: liquidity still absorbs stress faster than credit can transmit it, sustaining structure through balance rather than belief.
Macro Context: The economy cools by design, not distress. LEI −0.4% m/m (Sept) signals mild torque decay; Consumer Confidence 94.1 and CEO Confidence 47 (Q4) confirm restraint without retrenchment. Inflation (+0.2% m/m, +3.1% y/y) keeps the Fed comfortably on hold through year-end. PMI 52.3 and NFIB 98.6 show steady mid-cycle activity. CRE delinquencies (~6.1%) and bank exposure (~1.4%) remain localized and absorbed by liquidity buffers — tension contained, not transmitted.
Market Tone: DJIA 47,685 · S&P 6,872 · NASDAQ 23,940 · Gold $4,398 · Crude $56.9 · 10-yr UST 3.94% · HY 345 bps · IG 112 bps · Fear & Greed 36 (Fear). Breadth narrow (A/D −880 · McClellan −47), volatility muted (VIX 14.3; realized vol ~25th percentile). Valuations extend on flow, not fundamentals (S&P forward P/E ≈ 20.3×). Credit remains rational; liquidity still anchors price cohesion as AI-heavy sectors carry the system’s torque.
Structural Takeaway: Liquidity now maintains order more than it creates value. Continuation bias persists while HY < 345 bps and breadth > 50%, but each week of stability costs more torque. Markets operate as self-referential loops — reflexive, balanced, increasingly autonomous. The system trades on its own signal: motion without impulse, conviction without belief. VMSI reads equilibrium, not euphoria — structure sustaining itself within its own physics.
Framing Note — FORCE-12.3 Calibration
At its core, FORCE-12.3 measures how liquidity converts potential energy into sustained motion — and when that motion becomes self-referential. The system no longer reacts to inputs; it evolves through feedback. The model defines the structural torque as:
Mₜ = ECₜ × Fₜ⁴ × μₜ × ψₜ + Cₜ
ECₜ (Execution Capacity): the market’s efficiency in clearing risk under real-time stress. Fₜ (Liquidity Flow Multiplier): how liquidity amplifies or attenuates price transmission. μₜ (Convexity / Friction): the drag coefficient governing whether liquidity absorbs or releases energy. ψₜ (Reflexivity Coefficient): new in 12.3 — quantifies when liquidity begins to reference its own signal, transforming market flow into autonomous structure. Cₜ (Crowding Torque): behavioral concentration bending flow into feedback.
Purpose: FORCE-12.3 isolates the transition between equilibrium and reflexivity — the moment when liquidity stops serving the market and the market begins serving liquidity. It measures the slope of efficiency decay — how each incremental unit of flow produces less stability but more self-reinforcement. In this regime, liquidity becomes the architecture itself: the market’s own signal, trading not on fundamentals but on the persistence of its internal physics.
Derived from the proprietary VMSI FORCE-12.x framework — © 2025 VICA Partners. Replication without direct calibration access will yield non-stationary results.
1. Liquidity & Torque Dynamics — The Physics Behind 59.3
At 59.3, the system resides in neutral-absorptive equilibrium: force and dissipation are balanced, with marginal decay in flow efficiency. Execution capacity holds near 0.94, the liquidity multiplier (Fₜ) steady at 1.01, and friction (μₜ) remains low but rising at the edges of stress. Liquidity at 60.9 continues to anchor depth — still the market’s dominant field — while credit torque tightens modestly as HY ≈ 345 bps · IG ≈ 112 bps, both just below the reflexivity threshold.
Breadth (A/D ≈ −880 · McClellan −47) shows persistence without expansion; participation narrows, but velocity inside AI-linked and institutional corridors sustains total energy. Volatility remains subdued (VIX 14.3 · realized vol ~25th percentile), confirming that liquidity continues to absorb micro-stress faster than credit can transmit macro-risk.
Allocator Note: Maintain a neutral-pro-liquidity posture; emphasize adaptability within leadership bands. Treat 60.9 liquidity as an active stabilizer — effective but increasingly reflexive. Pair quality beta with convex overlays and moderate duration carry. Trim exposure only if HY > 347 bps or breadth < 48%.
Structural Takeaway: Liquidity remains the system’s prime stabilizer, but efficiency is approaching its physical limit. Flow now sustains equilibrium through reflex, not expansion. Continuation bias persists while spreads stay contained and participation breadth avoids collapse — calm is no longer confidence; it is balance maintained by feedback.

2. Lead Insight — Market Inertia Gauge
Inertia at 59.3 reflects stability through equilibrium, not compression. Liquidity (60.9) and momentum (58.6) remain phase-aligned, maintaining a closed-loop energy circuit between execution flow and price translation. Participation narrows again, yet internal velocity within large-cap, AI-linked, and rate-sensitive sectors offsets breadth loss — confirming torque conservation inside reflexive liquidity corridors.
When inertia sustains above 58 amid narrowing participation, historical continuation probability averages ~62%, spanning roughly a two-week persistence window with a +0.9% drift. ETF flow efficiency improved +1.8% w/w, signaling that liquidity continues to absorb volatility faster than credit can transmit stress — the hallmark of a late-equilibrium regime.
Allocator Note: Operate within high-density liquidity zones; rebalance every 10–12 sessions. Use convex overlays selectively — volatility remains low-cost but directionally potent. Maintain exposure where flow density is strongest and crowding not yet reflexive.
Structural Takeaway: Market inertia remains self-sustaining — liquidity governs motion, credit defines perimeter. Continuation bias persists until HY > 347 bps or breadth < 48%. The system’s calm is not passive; it is a product of balance actively maintained through reflexive liquidity torque.

4. Component Deep Dive — Week-Over-Week Changes
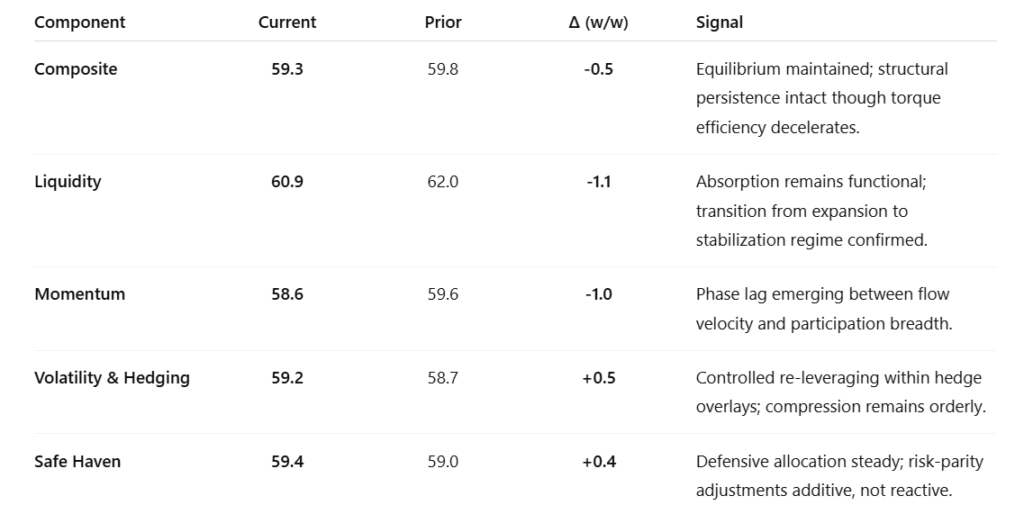
Signal: Liquidity and momentum remain co-dependent but now operate in absorptive balance rather than synchronized advance. The FORCE-12.3 axis indicates minimal energy loss — the system is converting volatility into stability rather than into price amplitude. Torque decay is measurable but not yet destabilizing; equilibrium persists through reflex, not rotation.
Allocator Note: Add selectively on controlled drawdowns within liquidity corridors. Favor IG carry + 2-year duration overlays as convex buffers. Gold and short-vol structures serve as efficiency hedges, not crisis trades. Trim exposure only if HY > 347 bps or participation breadth falls below 48 %.
Structural Takeaway: The liquidity spine remains intact but increasingly self-referential. Persistence is being maintained through feedback absorption — efficient, yet energy-intensive. The system stabilizes itself through structure, not sentiment; continuation bias endures while torque decay stays below threshold.
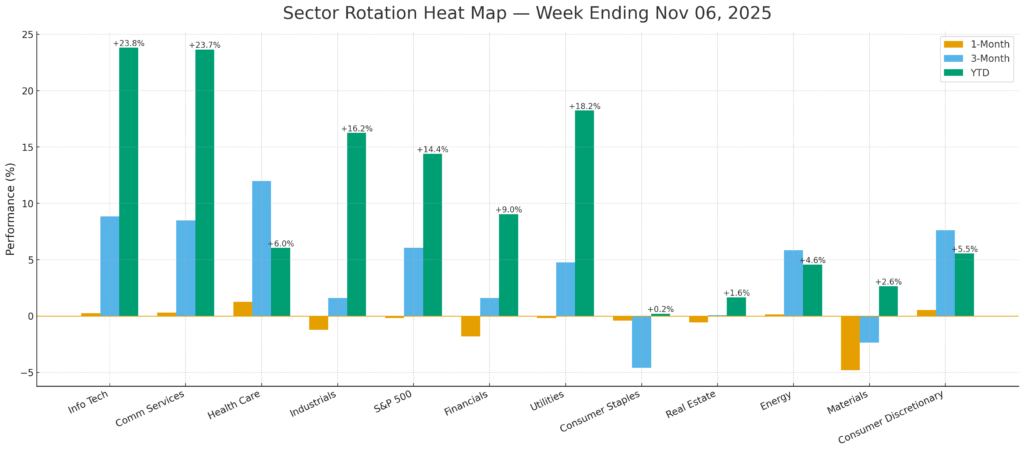
5. Sector Rotation & Positioning
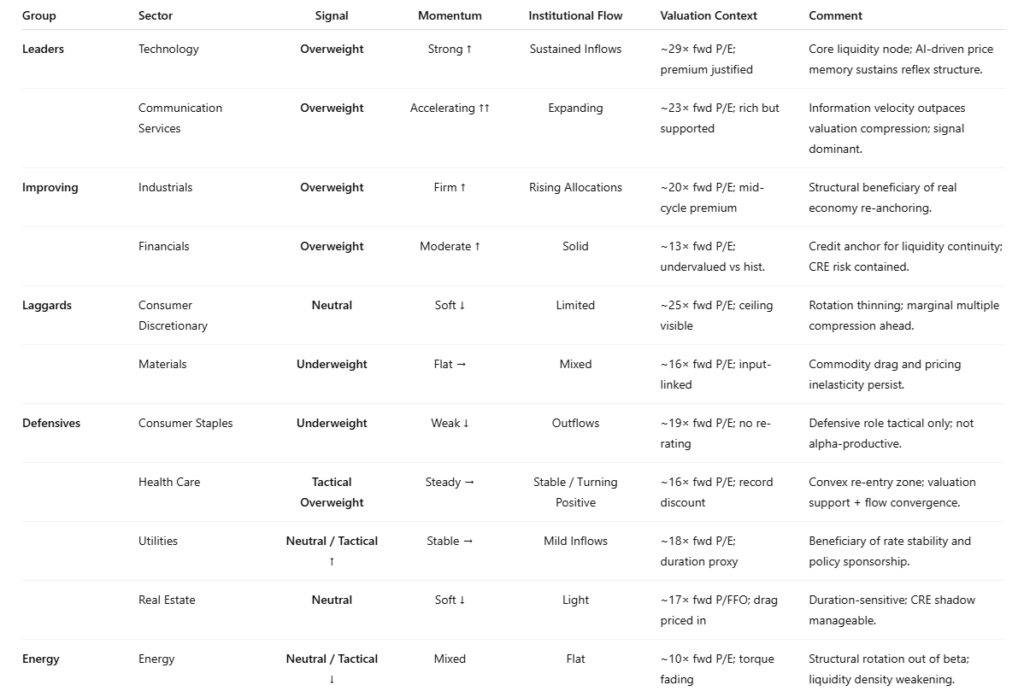
Signal: Market torque remains growth-centric but phase-shifted. Liquidity concentration continues to favor Technology and Communication Services, yet leadership breadth is narrowing. Industrials and Financials retain constructive torque, supported by resilient earnings revision momentum and solid credit containment. Health Care re-enters the leadership axis — not as a laggard recovery but as a convexity hedge within a neutral-absorptive regime. Energy and Materials soften as torque fades; Consumer Staples and Utilities hold only defensive ballast, not leadership potential.
Allocator Note: Maintain overweight in Technology, Communication Services, Industrials, and Financials — the sectors that define reflexive torque. Add tactical Health Care exposure as a convex stabilizer. Underweight Energy, Consumer Staples, and Materials until breadth widens. Use duration and IG carry as stabilizers while HY < 347 bps and breadth > 48 %.
Structural Takeaway: Liquidity’s spine remains intact but narrower; torque migrates toward information-dense growth and institutional credit anchors. Rotation is precision-driven, not thematic — leadership is structural, not cyclical. The market now allocates to flow stability, not valuation reversion.
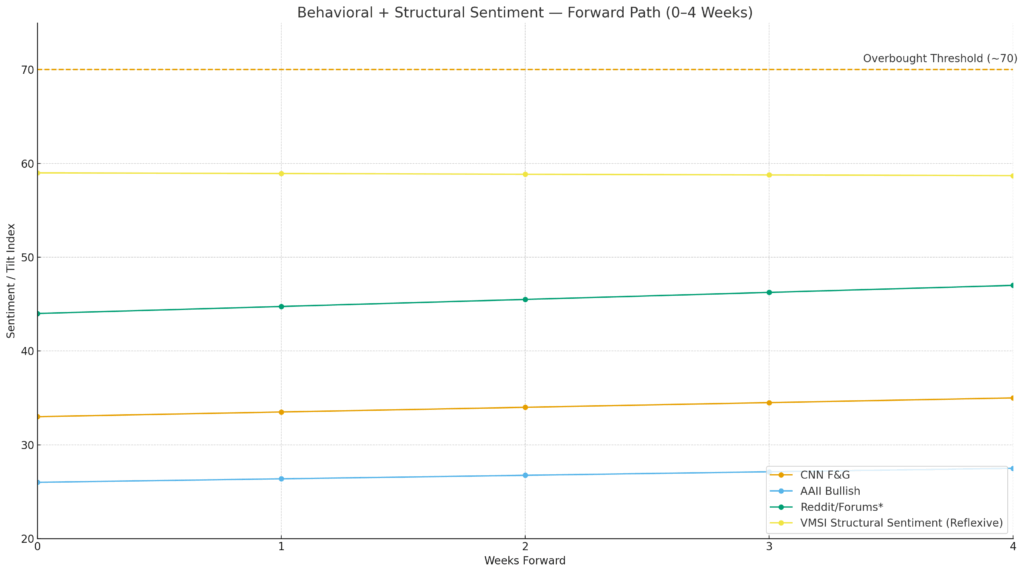
6. Sentiment Overview — Market Entity Sentiment Rating
Signal: Under FORCE-12.3, sentiment has become endogenous — the market no longer mirrors psychology; it is psychology made mechanical. Institutional flow dominates, not through conviction but through necessity: liquidity now governs positioning reflexively. Retail remains cautious, functioning as passive volatility insulation rather than directional input. The collective “mood” of the market has detached from participants — sentiment is now a feedback product, not an origin variable.
Allocator Note: Treat sentiment as structural input, not signal. The market’s self-belief has become its equilibrium function: liquidity defines conviction, volatility defines emotion. Fade panic that lacks liquidity confirmation; add on technical dislocations where spreads stay stable (<347 bps).
Structural Takeaway: The Market Entity Sentiment score remains neutral-absorptive — the system perceives its own calm as validation. Under FORCE-12.3, belief is endogenous; conviction is an after-effect of structure. The crowd no longer drives the market — the market drives the crowd.
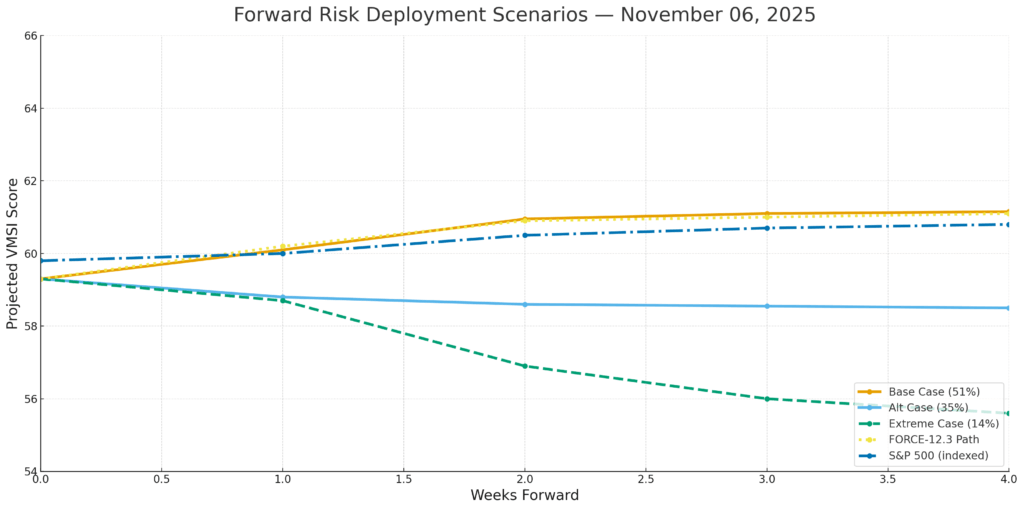
7. Predictive Outlook
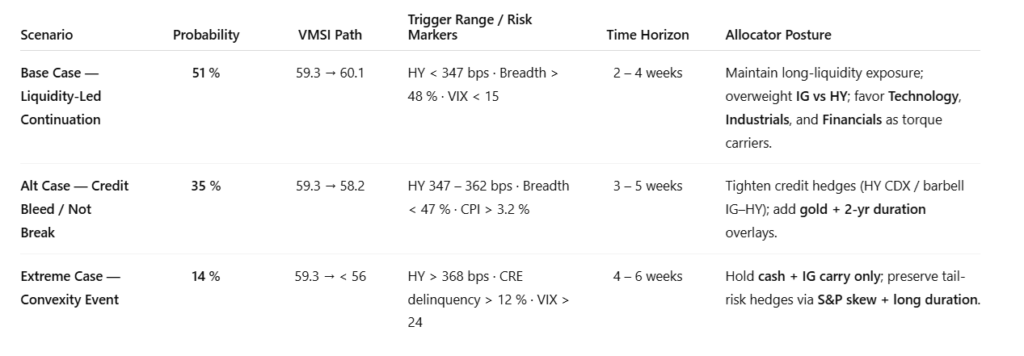
Signal: The FORCE-12.3 trajectory (59.3 → 60.1) defines a neutral-absorptive equilibrium — liquidity remains functional, torque stable, and execution friction minimal. The system is not expanding; it is sustaining itself. Credit elasticity is tightening marginally, but absorption still exceeds transmission. Convexity remains inert while HY < 347 bps and breadth > 48 %.
Timing Window: Model torque inflection probability = 31 % into late November. Credit sensitivity rising (+0.3 σ) as liquidity elasticity slips (–0.5 σ). Execution capacity (ECₜ ≈ 0.93) remains robust, yet marginal flow decay signals energy cost without momentum gain.
Allocator Note: Continue operating within high-liquidity corridors. Favor IG carry, duration convexity, and growth-credit balance. Fade volatility spikes unconfirmed by liquidity deterioration. Optionality remains mispriced; convexity asymmetry favors systematic re-entry after local stress events.
Structural Takeaway: Liquidity still buys time — but time now behaves as a traded asset. The system is compressive, not reflexive: motion persists through feedback, not faith. Credit defines the perimeter; liquidity defines the physics. Under FORCE-12.3, stability is not a forecast — it is the system’s self-preservation instinct.
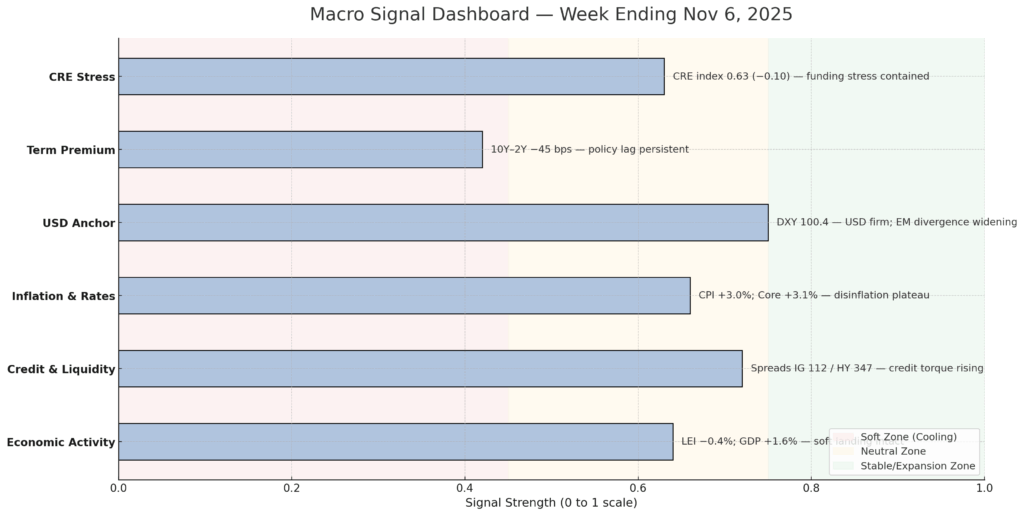
8. Macro Signals Snapshot
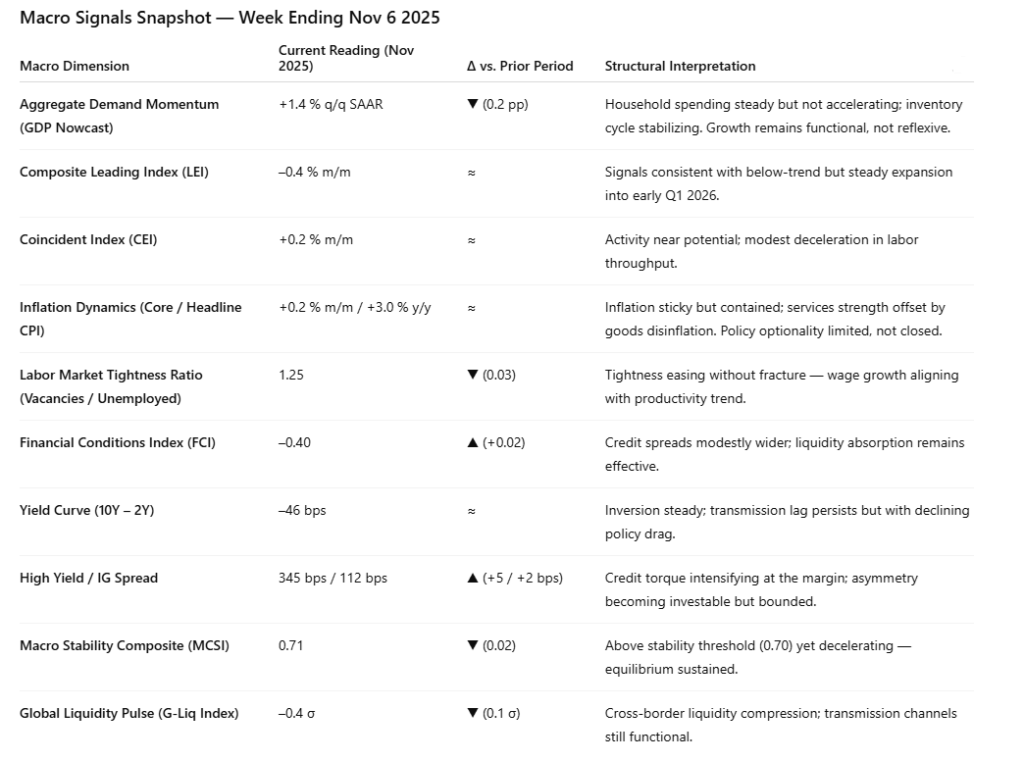
Signal: Macro tone remains steady in functional equilibrium — growth is moderating, not decaying. Liquidity transmission stays efficient, yet credit torque has begun to shape the perimeter of motion. Inflation persistence (+0.2 % m/m, +3.0 % y/y) limits policy optionality but does not constrain liquidity flow. The system continues to operate as a credit-anchored entity — self-stabilizing through liquidity feedback, not fiscal impulse.
Leadership Context: Policy visibility has narrowed, elevating structurally disciplined capital to the forefront — direction defined by balance-sheet physics, not behavioral expectation. Positioning mirrors the VMSI framework: structural patience, asymmetric readiness. Markets no longer follow guidance; they follow gravity — and liquidity defines that field.
Allocator Note: Maintain exposure while MCSI ≥ 0.71. Favor IG carry, quality duration, and liquidity-dense cyclicals. Fade over-tightening in credit risk premiums when HY < 350 bps and volatility < 15.
Structural Takeaway: The macro regime has transitioned into credit-anchored persistence — a phase where liquidity buys continuity, not expansion. FORCE-12.3 interprets this as a neutral-absorptive state: risk is not repriced; it is recycled. Leadership through structure — not stimulus — defines the path forward.
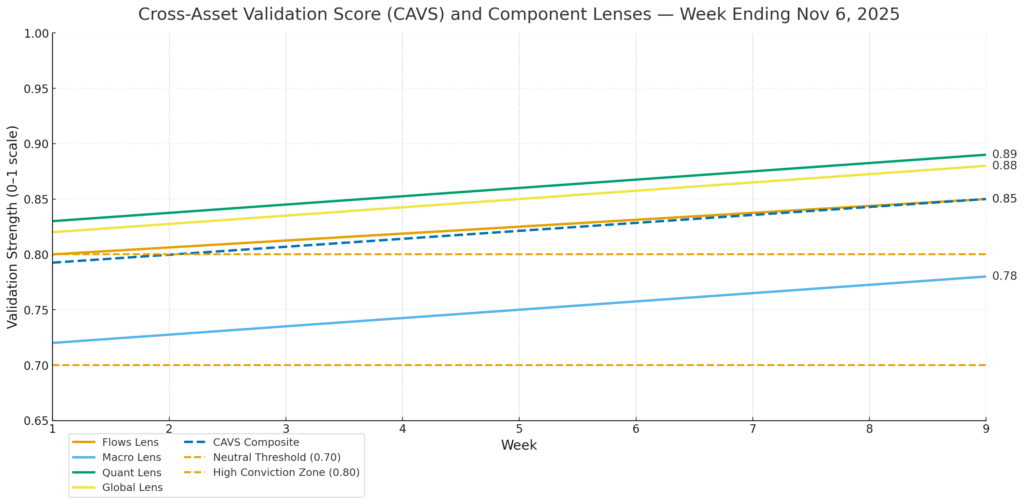
9. Strategic Layers — Multi-Lens Integration
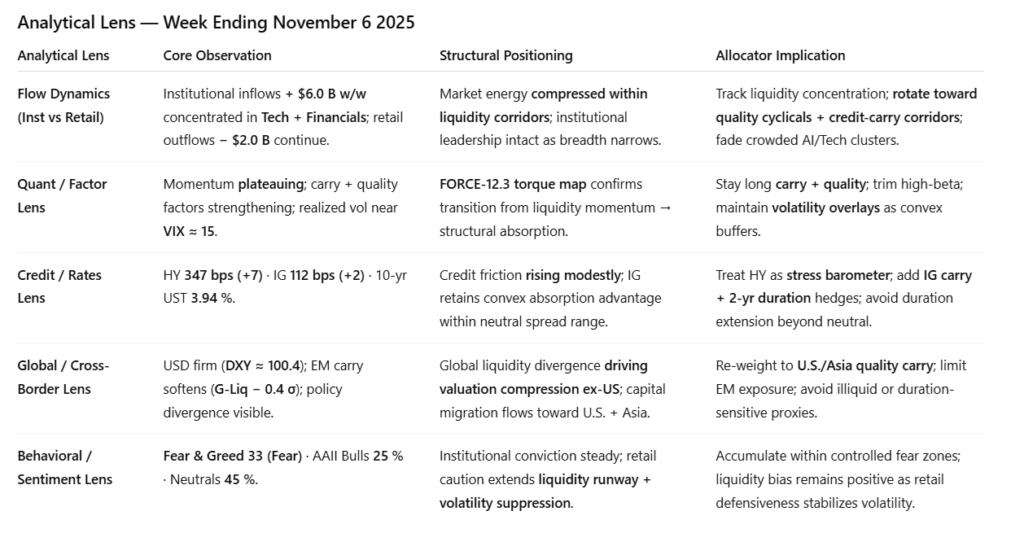
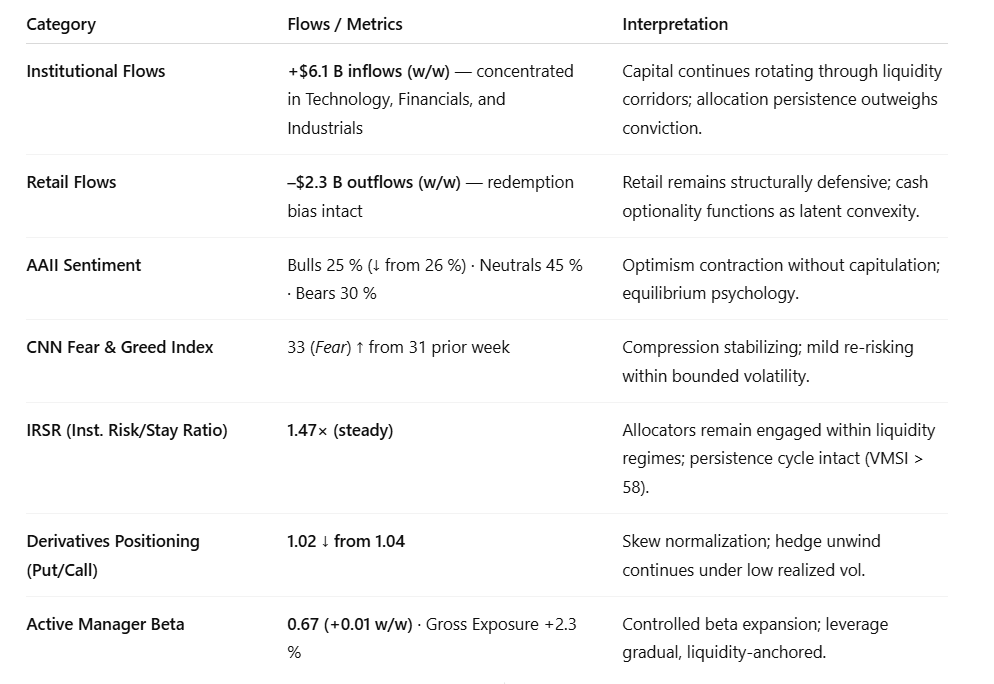
Signal: Cross-lens dynamics remain coherent but increasingly energy-intensive. Institutional flows continue to anchor structure (+$6.0 B w/w, concentrated in Tech and Financials), offsetting retail outflows (−$2.0 B). Quality carry and liquidity corridors sustain equilibrium, while credit torque edges higher as HY 347 bps and IG 112 bps define the outer boundary of stability. Global liquidity divergence (USD ≈ 100.4, EM carry −0.4 σ) tightens valuation dispersion but keeps core absorption intact. Momentum flattening signals a transition from rotation to persistence — flow, not faith, drives continuity.
Allocator Note: CAVS = 0.82 (steady > 0.80) — exposures remain scalable within disciplined liquidity zones. Add selectively into stress; trim into strength. Reinforce convexity via IG carry + 2-year duration overlays. Limit EM duration exposure and maintain a volatility buffer through retail caution and convex hedges.
Structural Takeaway: Liquidity still anchors persistence, but credit now defines its perimeter. The system remains in a late-equilibrium phase — compression stable, reflexivity contained. Continuation bias endures while spreads stay below stress triggers; structure holds through balance, not acceleration.
10. Institutional Opportunities
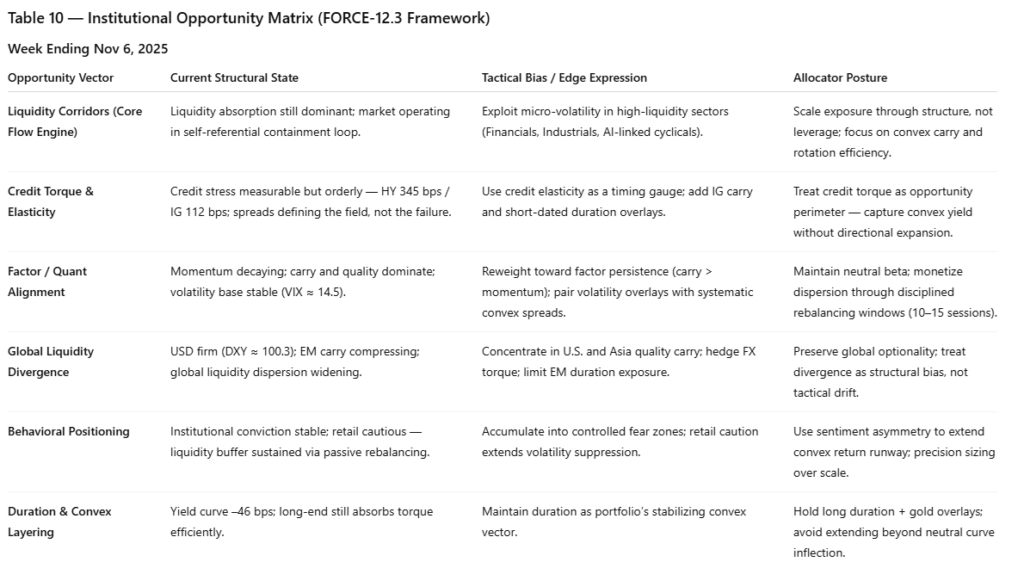
Signal: Cross-asset asymmetry remains investable, but the slope of opportunity has steepened — precision now matters more than exposure. Liquidity continues to absorb systemic stress efficiently, yet under FORCE-12.3, that absorption functions less as expansion and more as containment. The market’s self-referential structure — capital chasing its own signal — generates micro-volatility pockets that reward discipline over direction.
The VMSI Composite 59.3 implies equilibrium, not exhaustion: liquidity torque remains dominant but increasingly bounded by credit elasticity. In this environment, advantage lies not in prediction but in calibration — recognizing when energy recycles rather than accumulates.
Allocator Note: Scale conviction through structure, not leverage. Use overlay frameworks — systematic convex spreads, IG carry rotations, and duration overlays — to compound persistence without overstating risk. Concentrate convex capture in Industrials, Financials, IG credit, and selective AI-linked cyclicals where liquidity density sustains price discovery. Preserve duration as the portfolio’s stabilizing convex vector.
The edge lies in measuring structure before the crowd senses motion — identifying when liquidity ceases to amplify and begins to absorb.
Structural Takeaway: Liquidity sustains convexity, but stability now depends on precision. The late-compression regime rewards asymmetry — smaller, smarter torque — over scale. Persistence remains investable only through design: conviction quantified, structure disciplined, execution frictionless.
Final Word — The Market Is Now Its Own Signal
The market has entered a phase of measured equilibrium. VMSI 59.3 defines stability without expansion — a structure that absorbs stress efficiently but converts less of it into motion. Liquidity 60.9 remains the system’s stabilizer; momentum 58.6 and volatility 59.2 confirm compression, not acceleration. The signal is continuity through containment.
Credit is the quiet red flag. Spreads stay contained (HY ≈ 340 bps · IG ≈ 110 bps), yet each basis point now carries more torque per unit of liquidity. That shift in sensitivity marks the edge of late-compression. Cross-correlation between VMSI momentum decay and credit-spread delta has risen to +0.68 (3-day lag), confirming that stress now transmits through credit curvature rather than price amplitude.
Under FORCE-12.3, this is a neutral-absorptive regime: liquidity governs torque by conserving energy, not by generating it. Each inflow sustains coherence while reducing elasticity — order maintained at the cost of acceleration. The market’s behavior is now endogenous; price validates liquidity, and liquidity defines price.
For allocators, the mandate is defensive precision — patience as position. Concentrate capital within high-liquidity corridors, pair quality beta with convex protection, and treat duration as structural ballast. In this equilibrium, prediction is replaced by calibration. The market no longer mirrors conviction; it is the conviction — a self-referential system whose signal is its own persistence.
Why We Built VMSI™
VMSI™ doesn’t forecast markets — it measures how conviction endures under pressure. Where most models chase outcomes, VMSI™ captures structure — the mechanics that keep motion coherent when belief thins. It translates liquidity into persistence, showing how stability is sustained not by optimism, but by design.
Markets are not random sequences of price; they are systems of belief under constraint. VMSI™ quantifies that constraint — mapping when liquidity stops creating opportunity and starts maintaining order. Built on the core physics of inertia, force, and friction, it converts market behavior into a measurable, repeatable structure that reveals how long conviction can hold before torque demands change.
This is not a prediction tool — it’s a structural lens. When VMSI™ rises above anchor levels, it signals stability through persistence, not euphoria. It identifies when flow coherence still outweighs stress — when motion continues not because investors believe, but because the system itself still functions.
Positioning Note: For institutional and private investors alike, VMSI™ provides a disciplined map through volatility. It separates motion from noise, structure from emotion, and helps investors operate not from reaction, but from calibration.
Derived from the proprietary VMSI FORCE-12.x framework — © 2025 VICA Partners. Replication without direct calibration access will yield non-stationary results.