The DJIA is rallying today with prices taking out Tuesday’s intraday highs. The market is responding to oversold conditions on both the hourly and the daily charts along with some generic ‘consensus’ from analysts that stocks are in a correction in a continuing bear market that will yield to ‘recession’ conditions in 2023. Some of these same analysts are the ones who downplayed the entire correction of 2022 as a ‘normal’ correction.
DJIA Hourly Chart
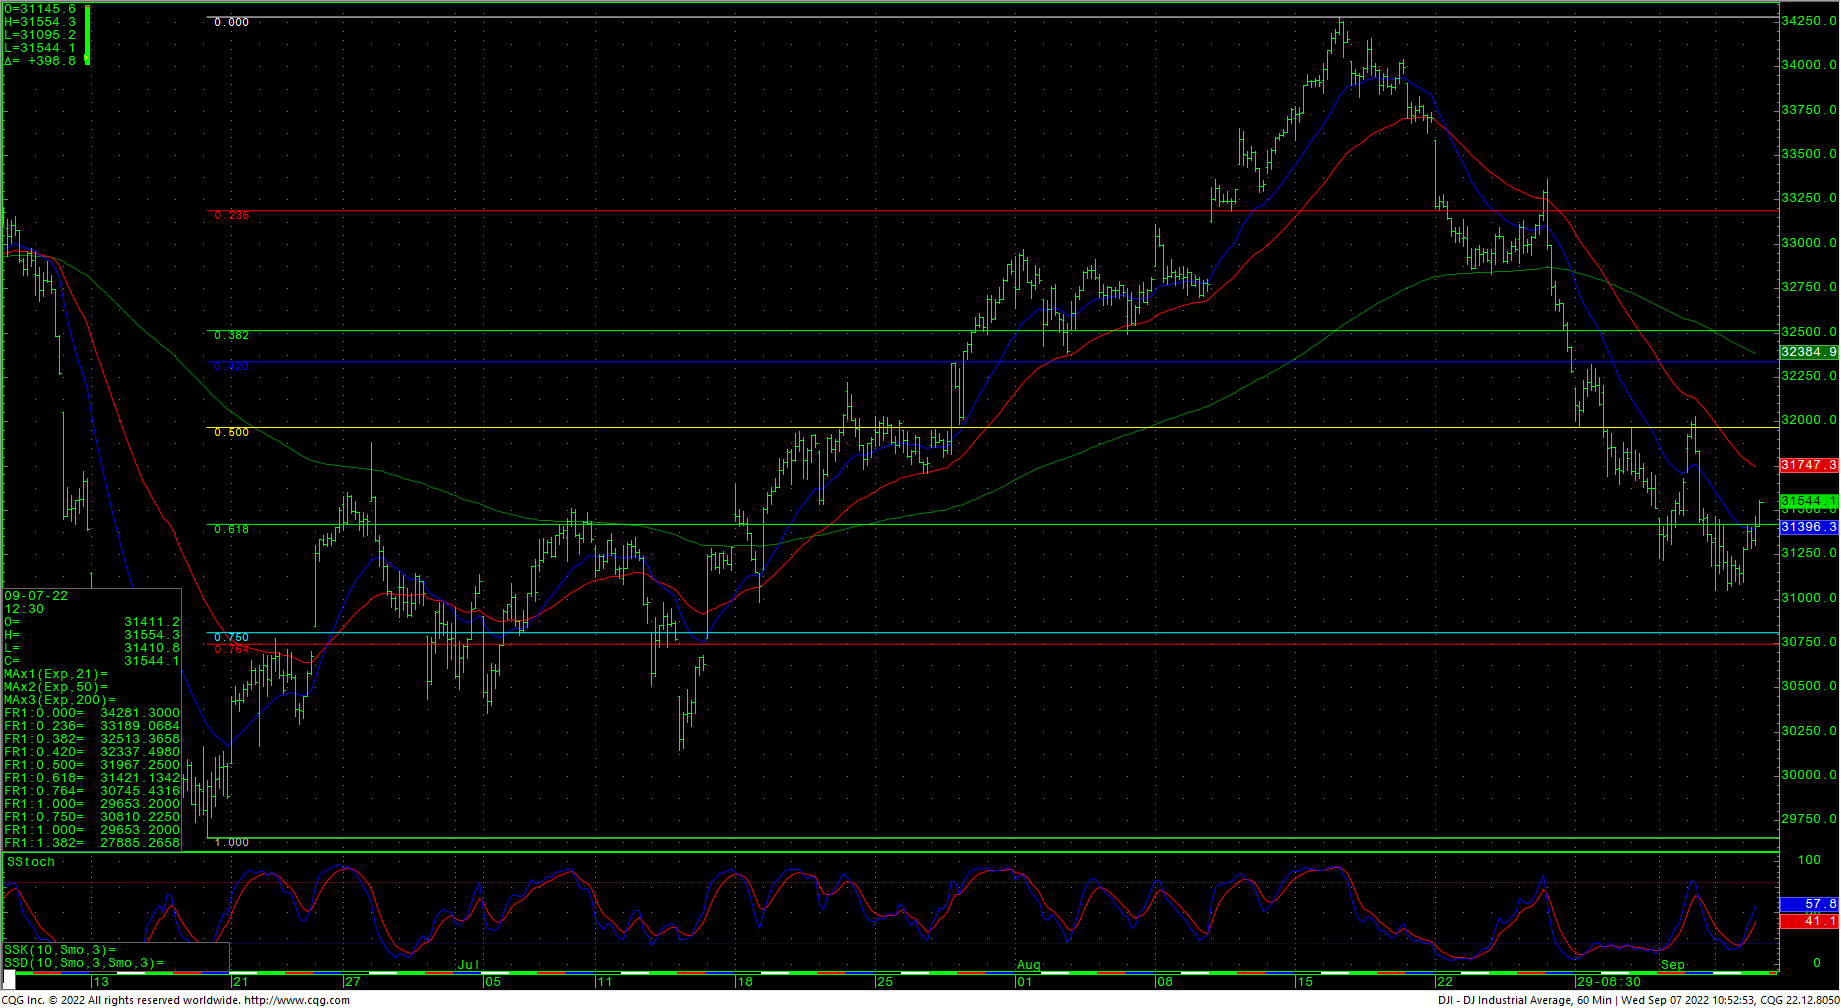
The hourly chart has completed a five wave decline just under the 31116 target that was outlined in last Friday’s update. The current low of 31048 will likely hold for the short-term and should lead, minimally, to a test of the 4th wave swing high at 32026.
The downside parameters remain basically the same with one note that the 21-day MA crossed under the 50-day yesterday. Repeating last weeks comments: “Right now, technically, if you believe that the Dow is in a bullish retracement, prices need to hold the gap area left on the daily chart at 30775/30680. Major long-term support is now 30810 to 30680 and this would be the area to enter the market long with stops under the June lows.”
Short-term, resistance is 32026, 32283, 32406, key at 32664 and pivotal at 33046/33055. Rallies with closes over 323066 are bullish and would indicate more rallies and buying dips.


