MARKETS TODAY March 8 (Vica Partners)
Overview
A good Wednesday to all!
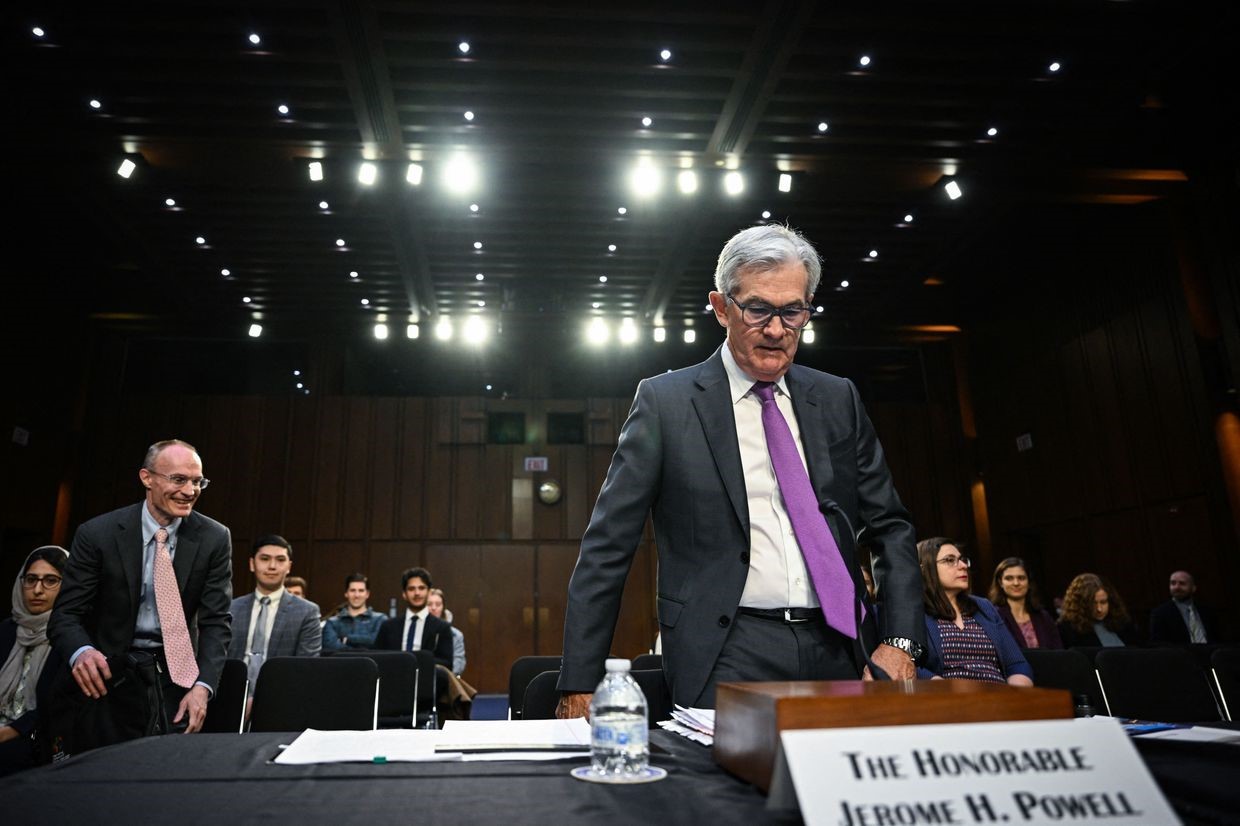
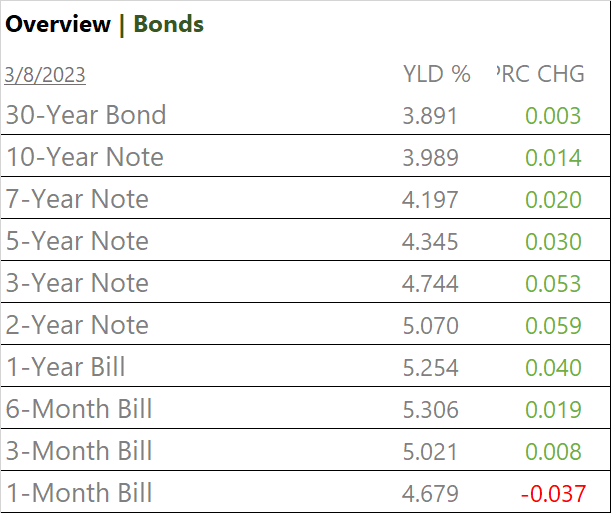
Yesterday, Fed Chair Powell hawkish testimony to Congress renewed the markets rate hike concerns and a possible accelerated 50bps move. Indexes retreated as S&P 500 ended the session down 1.5% and reversing last Friday’s gains. The yield curve moved deeper into inversion, its largest gap between shorter-dated and longer-term yields since Sept. 1981. The 2y note closed at a 15 year high of 5.015% and the 2/10 spread metrically significant (rate/ yield curve supplemental below). Premarket, Asian markets were mixed with HK Seng down, +2.5% with European indices trading mostly flat
Today, ADP Jobs Survey and JOLTS came in above expectations. ADP hiring strength came from larger companies whereas. US Job Openings declined in Jan but remained historically high with a problematic tight labor market.
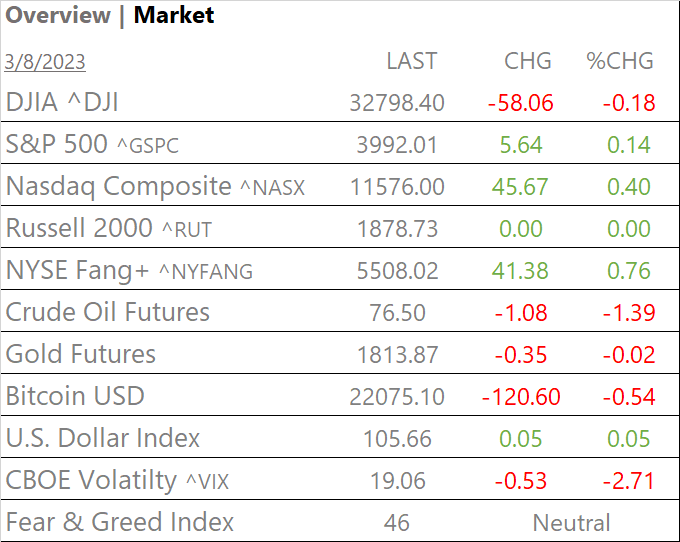
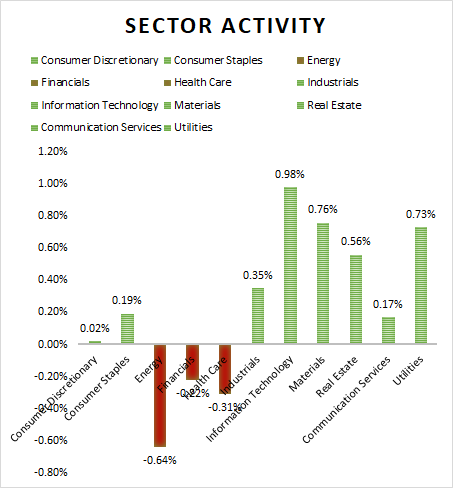
Indexes were mixed, Nasdaq led advancers. The NYSE FANG+ index was up 0.76%, boosted by Mega Caps and the + ICE Semiconductor index up +2.5%. 8 of 11 S&P Sectors higher: Information Technology +0.98% and Materials +0.76% outperform.
- The Markets mixed as Powell’s continues 2nd day of hawkish testimony
- Fear & Greed Index is shifting from neutral to fear
- Jolts and Employment no real factor today
- Indexes mixed, DOW lags and drops 58 points
- Yields rise, inversion curve can indicate recession
- 8 of 11 S&P Sectors higher: Information Technology +0.98% and Materials +0.76% outperform/ Energy -0.64%, and Health Care -0.31% underperform
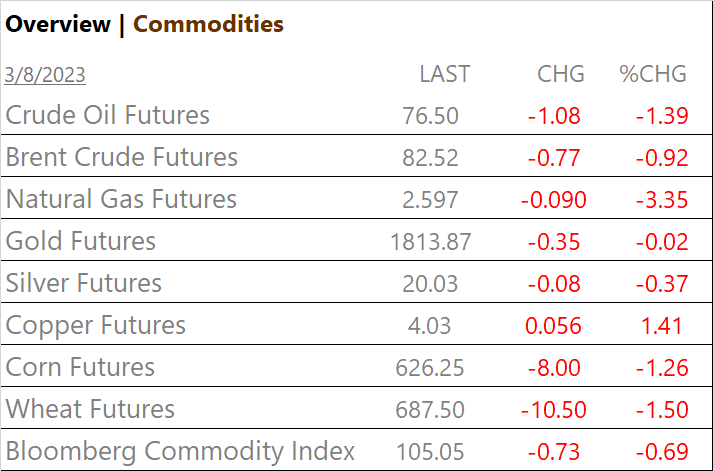
- Crude Oil Futures drop >1%
- USD Index, flat
Later this Week; Overnight, China inflation data, Thursday, President Biden will outline his budget proposal for the upcoming fiscal year to Congress and Friday the February jobs reports.
Sectors/ Commodities/ Treasuries
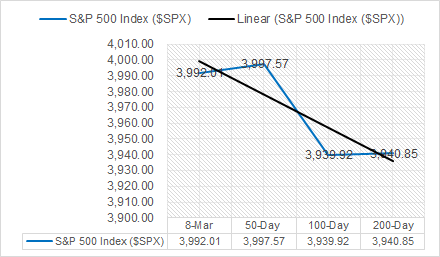
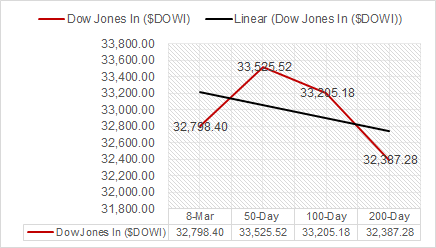
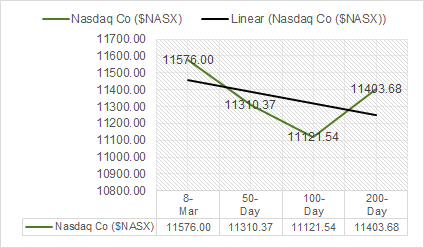
Key Indexes (50d, 100d, 200d)
- 8 of 11 S&P Sectors higher: Information Technology +0.98% and Materials +0.76% outperform/ Energy -0.64%, and Health Care -0.31% underperform
Commodities
US Treasuries
Economic Data
US
- ADP employment; period Feb., act 242,000, fc 205,000, prev. 119,000+
- U.S. trade balance; period Jan., act -68.3B, fc -$68.7B, prev. -$67.2B
- Job openings (JOLTS); period Jan., act 10.8m, fc 10.6m, prev. 11.2m
- Fed Chairman Powell testifies to House; Powell reaffirmed his message of higher and potentially faster interest rate hikes, but emphasized that debate was still underway with a decision hinging on data to be issued before the U.S. central bank’s policy meeting in two weeks.
News
Company News
· Nvidia, AMD grapple with latest U.S. curbs on China’s Inspur – Reuters
· Adidas Wonders What to Do With Yeezy Shoes After Ye Split – US News
Central Banks/Inflation/Labor Market
- Bank of Canada leaves rates unchanged, sees inflation falling as forecast – Reuters
- Fed Chair Opens Door to Faster Rate Moves and a Higher Peak – NY Times
Energy
- China’s energy transition sees ‘staggering’ progress on renewables — and a coal power boom – CNBC
- Renewable Giant NextEra: Offshore Wind Is A Poor Investment – Oilprice.com
China
- Studying Ukraine war, China’s military minds fret over US missiles, Starlink – Reuters
Supplemental
Interest Rates/ Yield Curves
Yield curve; investors watch parts of the yield curve as recession indicators, primarily the spread between three-month Treasury bills and 10-year notes, and the two- to 10-year (2/10) segment.
Curve patterns; Basic – slopes upward as the payout increases with the duration. Yields move inversely to prices. Steepening curve – signals expectations for stronger economic activity, higher inflation, and higher interest rates. Flattening curve – investors expect near-term rate hikes and are pessimistic about economic growth further ahead.
When the yield curve steepens, banks can borrow at lower rates and lend at higher rates. A flattening curve means tight margins, which often suspends lending.
An inverted yield curve; when yields on shorter-dated Treasuries rise above those for longer-term ones. It’s a closely watched metric by investors as it has preceded past recessions.
Why it most often happens; investors expect interest rates to rise in the near term, they believe that higher borrowing costs will eventually hurt the economy, forcing the Fed to later ease monetary policy.
What’s going in March 2023; the inversion reached negative 103.1 basis points on Tuesday as shorter term yields quickly increased, the largest gap between shorter-dated and longer-term yields since Sept. 1981. At that time, the economy was in the early months of a recession that would last until Nov. of 1982. For the last six recessions, a recession on average began six to 36 months after the curve inverted. The 2/10 spread is extreme currently -1.08%.
The current inversions suggest that investors expect higher short-term rates, however it raises doubts about the Fed’s ability to control inflation and protect the economy.
Market Outlook and updates posted at vicapartners.com

