
TECHNICAL ANALYSIS
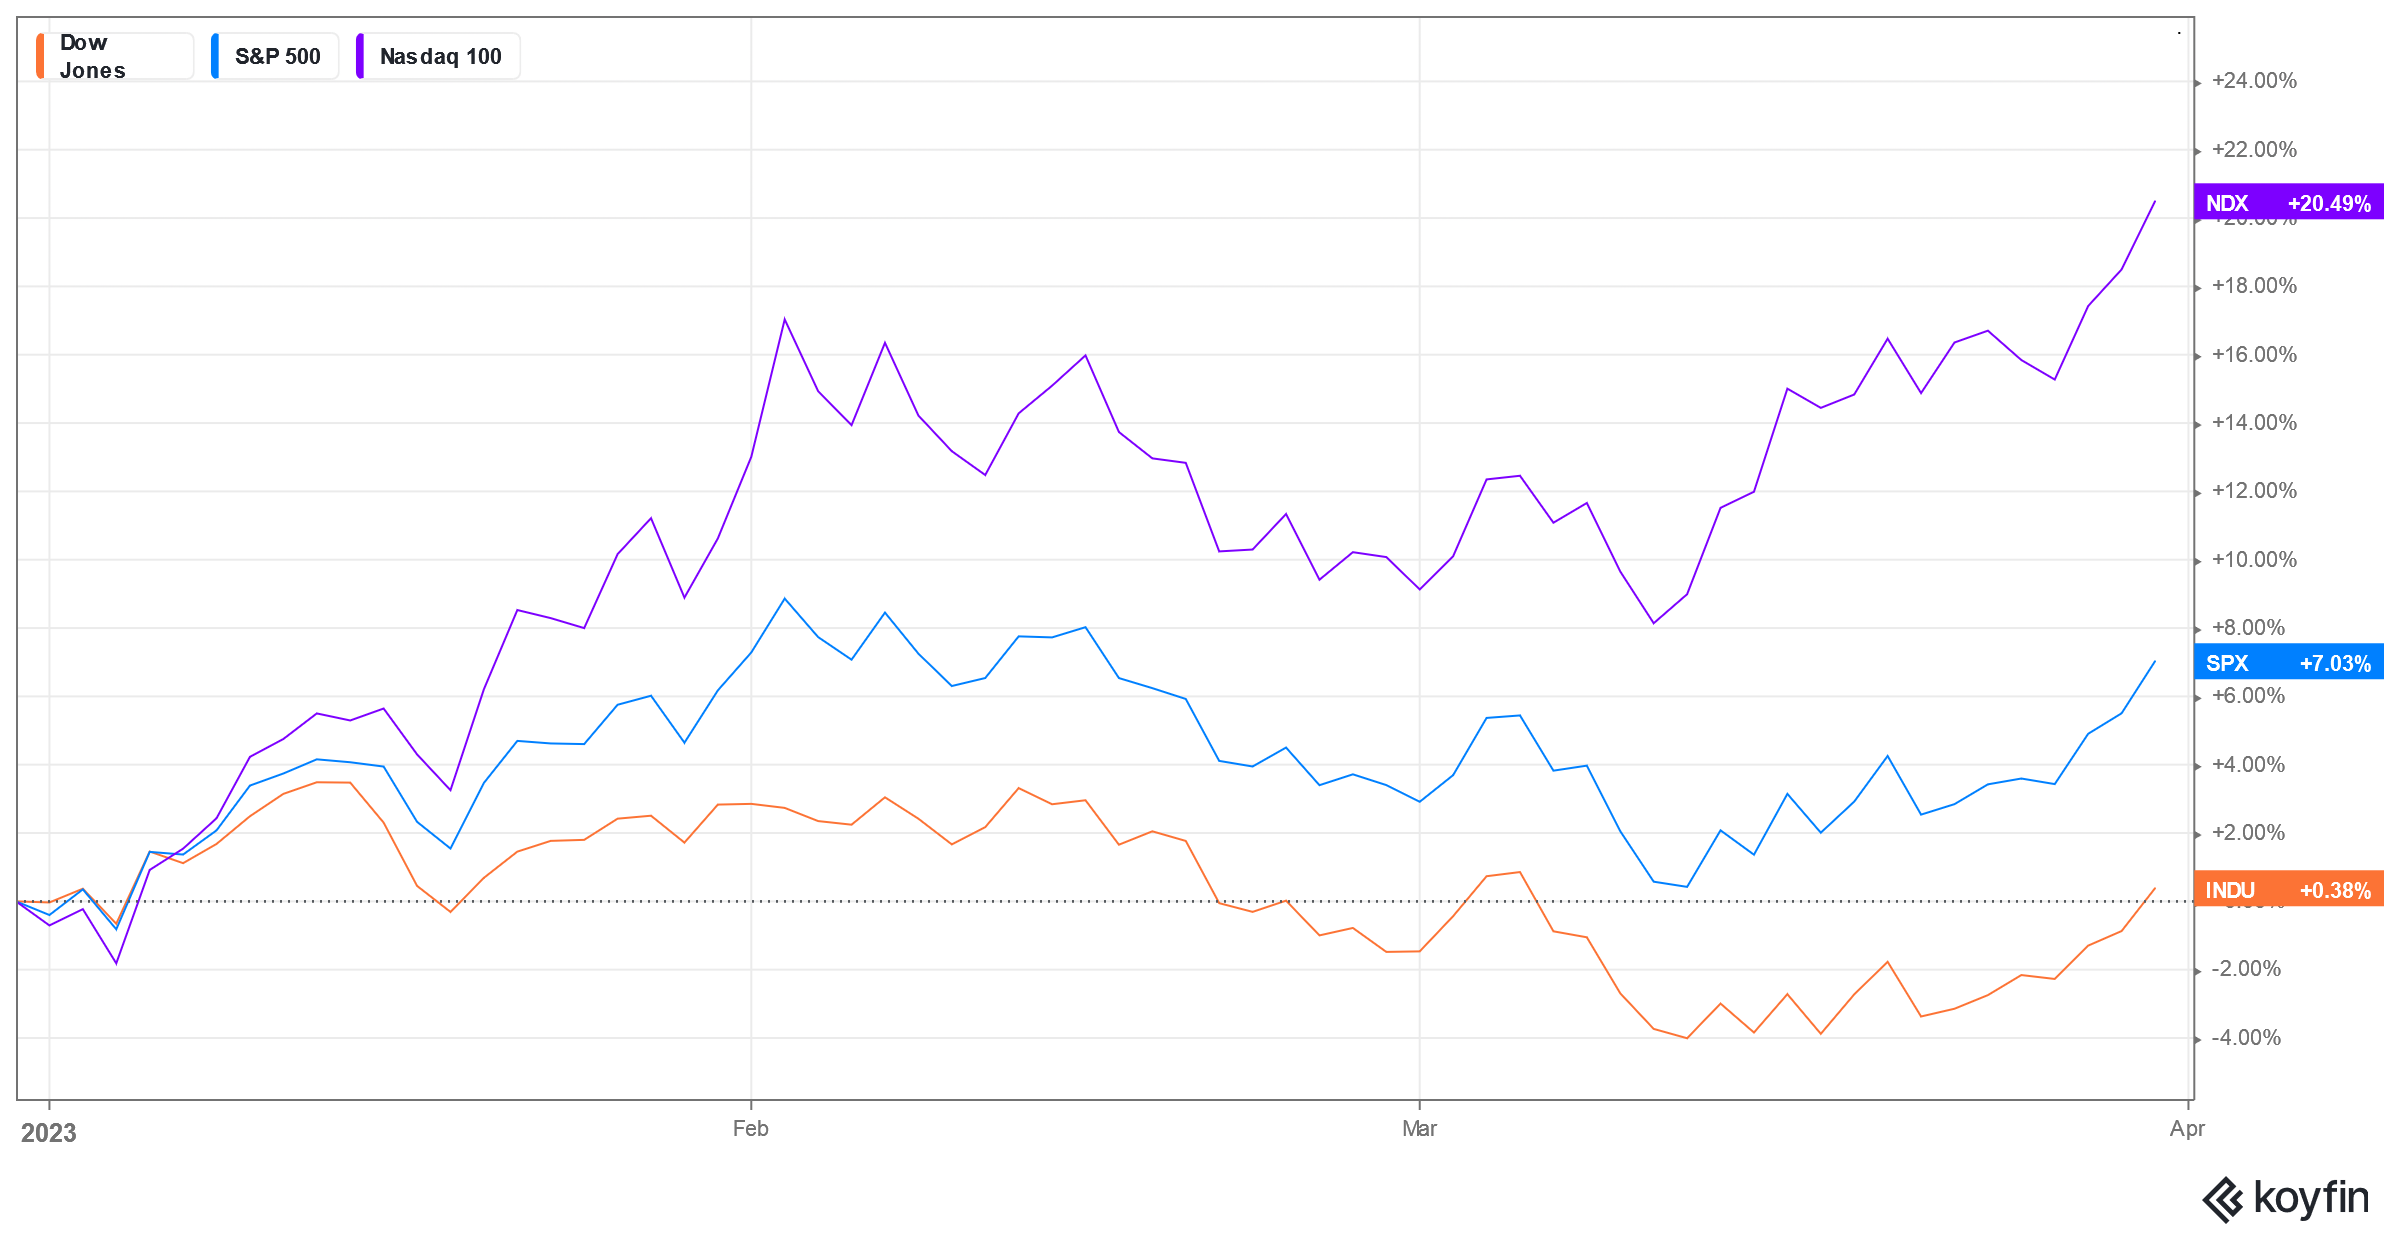
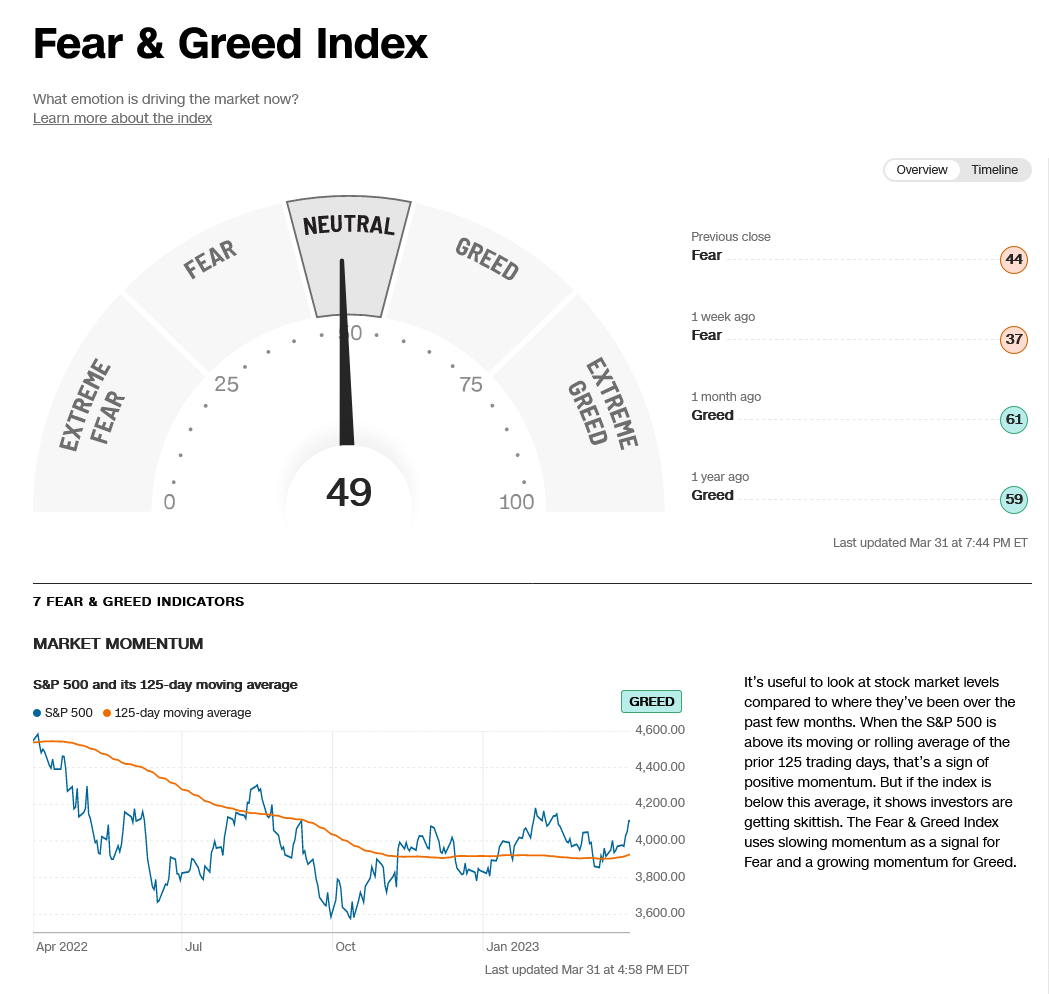
Stocks traded higher all week to stage a big recovery week as the first quarter came to an end. US bank stocks recovered as well with an advance of +4.57% with the Dow up +3.22%, the S&P500 up +3.48% and the Nasdaq up +3.37%. The action moves sentiment out of the fear side and 52-week H/L ratio ended the week at -3.97%. For the first quarter, the Dow closed up +0.38%, the S&P500 up +7.03% and the Nasdaq had one of its best quarters since 2020 ending with an advance of +20.49%. The Dow hourly is extremely overbought on the close Friday and the next pivotal area above is at 33458/33470.
1st Quarter 2023 Main Indices
Dow Jones Industrial Average Hourly HLC
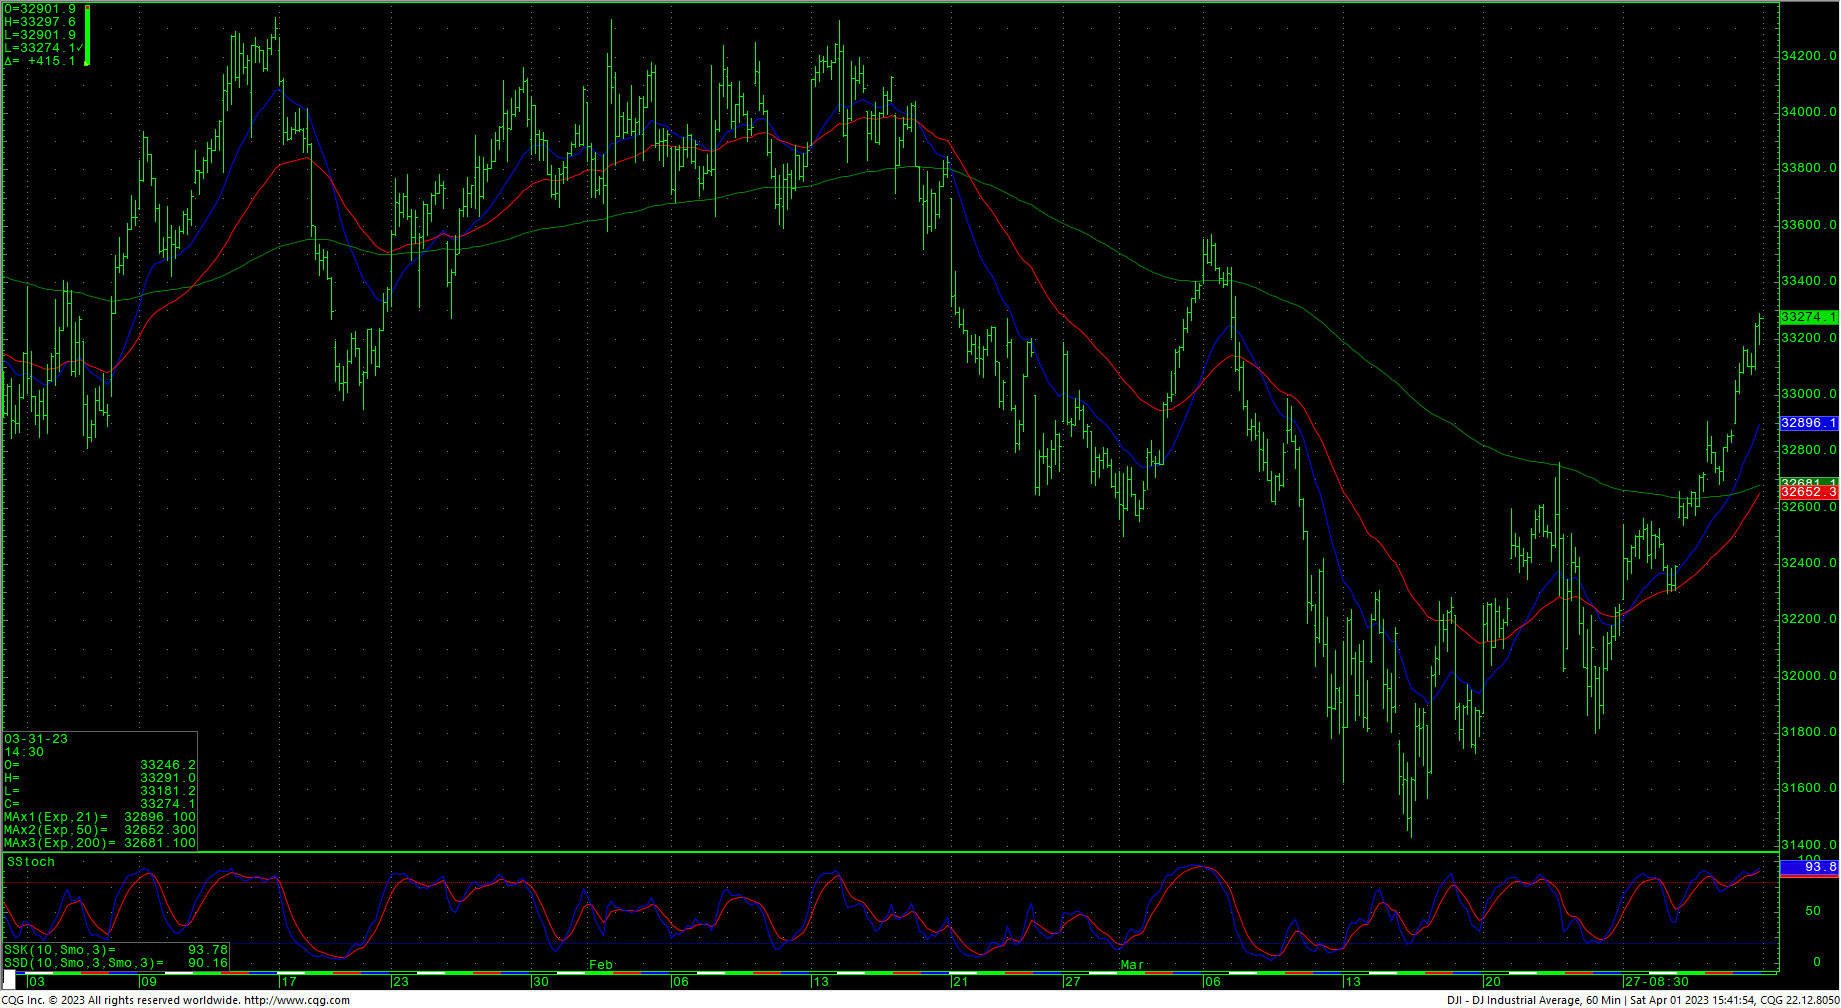
Continued rallies should test pivotal overhead resistance at 33458/33470. A drive above 33470 should minimally test 33572 with potential toward 33891/33937 with trading resistance at 33699. A breakout over 33937 is bullish and opens counts to 34712 with resistance at 34222 and 34334/34342. Closes over 34712 ultimately offers full counts back critical resistance at 34589. A drive over 34712 can test significant long-term resistance at 34879 and 34995.
Dow Jones Industrial Average Weekly HLC
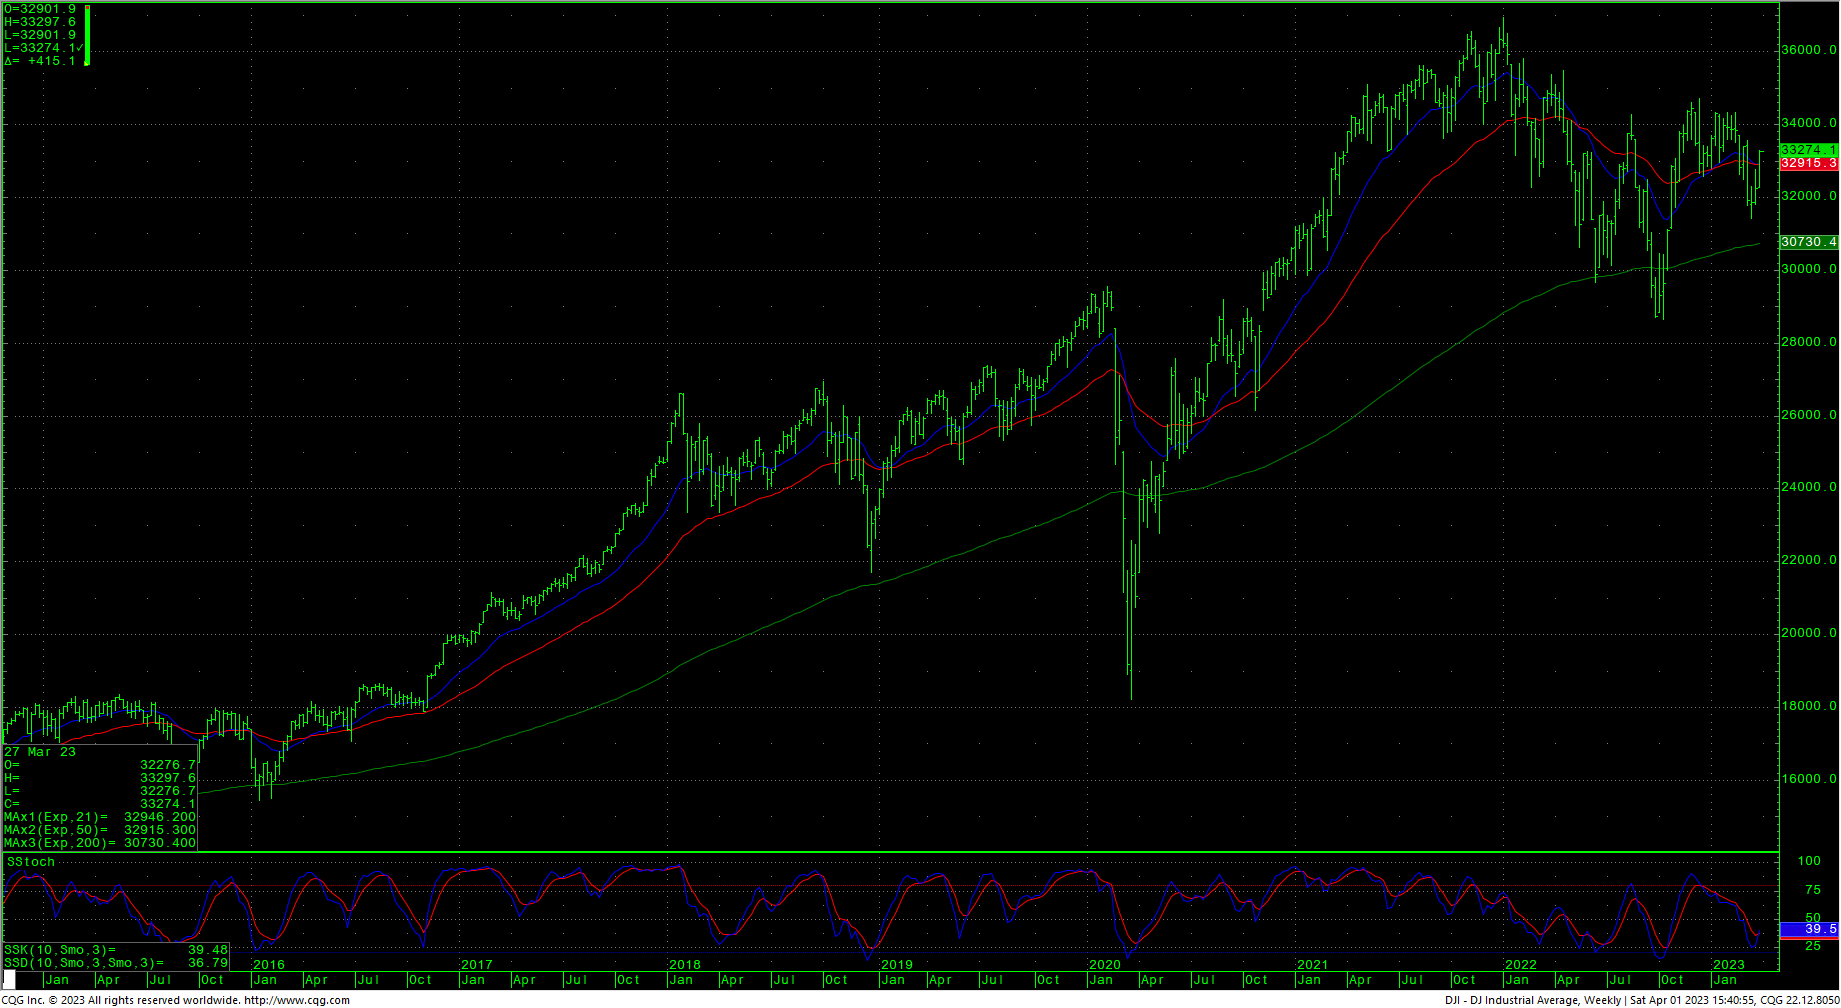
Support for the Dow is 33018 and 32850. A breakdown under 32850 can test 32714 with counts to pivotal support of 32578/32575. Closes under 32575 setup a test of 32360 with counts to critical short-term support of 32140/32130. Daily closes under 32130 setup a retest of intermediate support in the 31727/31686 level. A breakdown with closes under 31686 will open counts into the 30972/30960 level with support of 31429/31423 and 31160. There is a gap on the daily chart that runs from 31160 to 31119.
Resistance
- 33458/33470 *** ↑
- 33572 *** ↑
- 33699 ***
- 33790 **
- 33891/33937 *** ↑
- 34041 **
- 34130 **
- 34222 *** ↑
- 34334/34342 *** ↑
- 34395 **
- 34495 **
- 34595 **
- 34712 *** ↑
- 34879 ***
- 34995 *** ↑
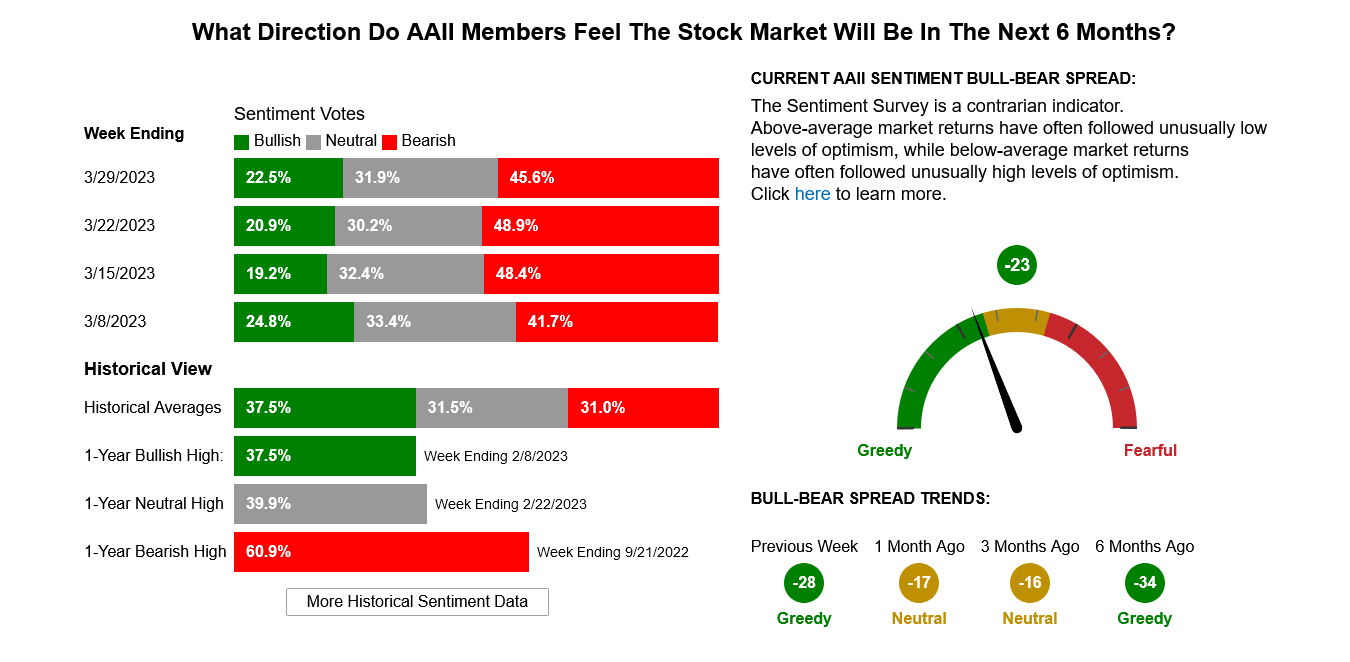
CNN Fear & Greed Index
AAII Investor Sentiment Survey
Support
- 33018 **
- 32950 **
- 32850 *** ↓
- 32714 **
- 32578/32575 *** ↓
- 32465 **
- 32360 *** ↓
- 32150 **
- 32140/32130 *** ↓
- 32040 **
- 31950 **
- 31809 ***
- 31727 *** ↓
- 31686 *** ↓
- 31575 **
- 31429/31423 *** ↓
S&P 500 Cash Index
Support is 4063 and 4039/4033. A breakdown under 4033 should test 4009 with counts to 3986/3980. Closes under the 3980 level should test 3959 with potential to pivotal near-term support of 3924/3920. Closes under 3920 setup a retest of 3868/3865. A breakdown under 3865 can test 3808 through 3797. A breakdown with closes under 3799/3797 opens counts to critical support against the 3760/3750 level. Under 3750 sets up a move to 3657 and full potential back to critical long-term support of 3505/3491.
S&P 500 Index Weekly HLC
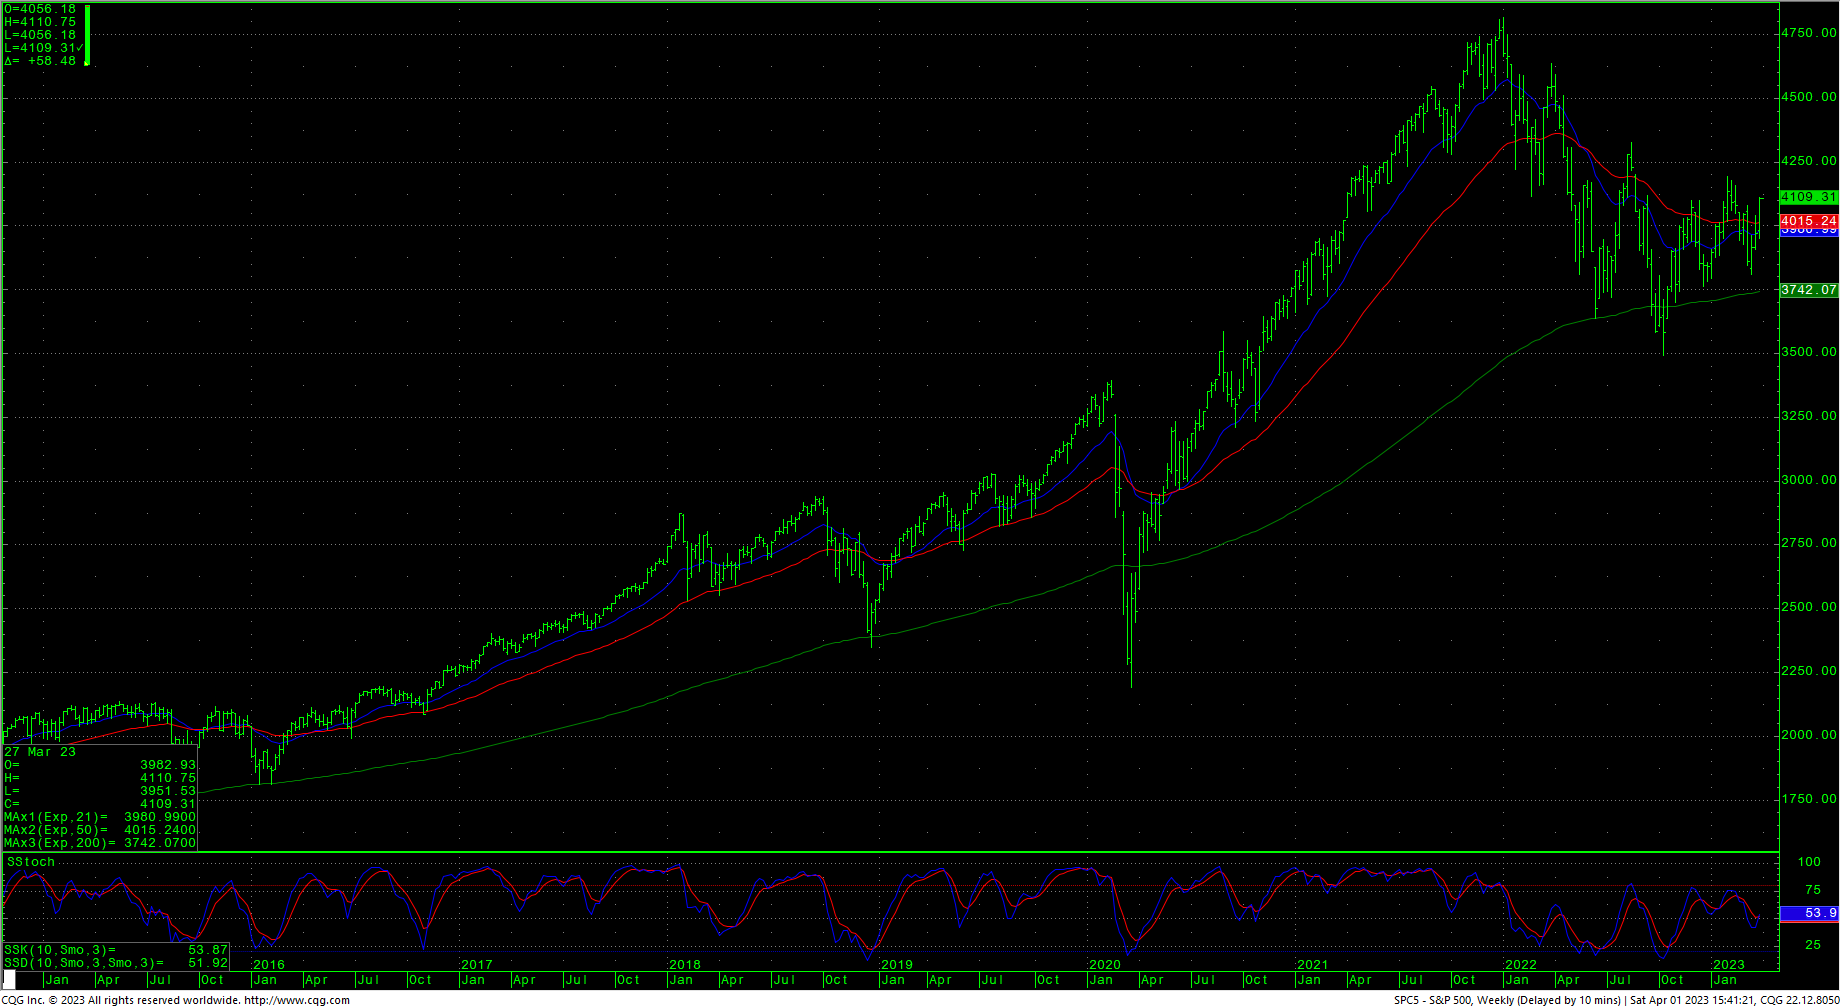
Resistance is 4128 and key at 4155. Daily closes over 4155 should test the overhead gap area at 4203 to 4218 and longer-term counts to critical resistance of 4311/4315. Daily closes over 4315 open counts to 4385 with full potential to long-term critical resistance of 4486/4505. Closes over 4505 can carry to 4593 with full potential toward 4637. A breakout above 4637 opens potential toward 4748 and ultimately 4818.
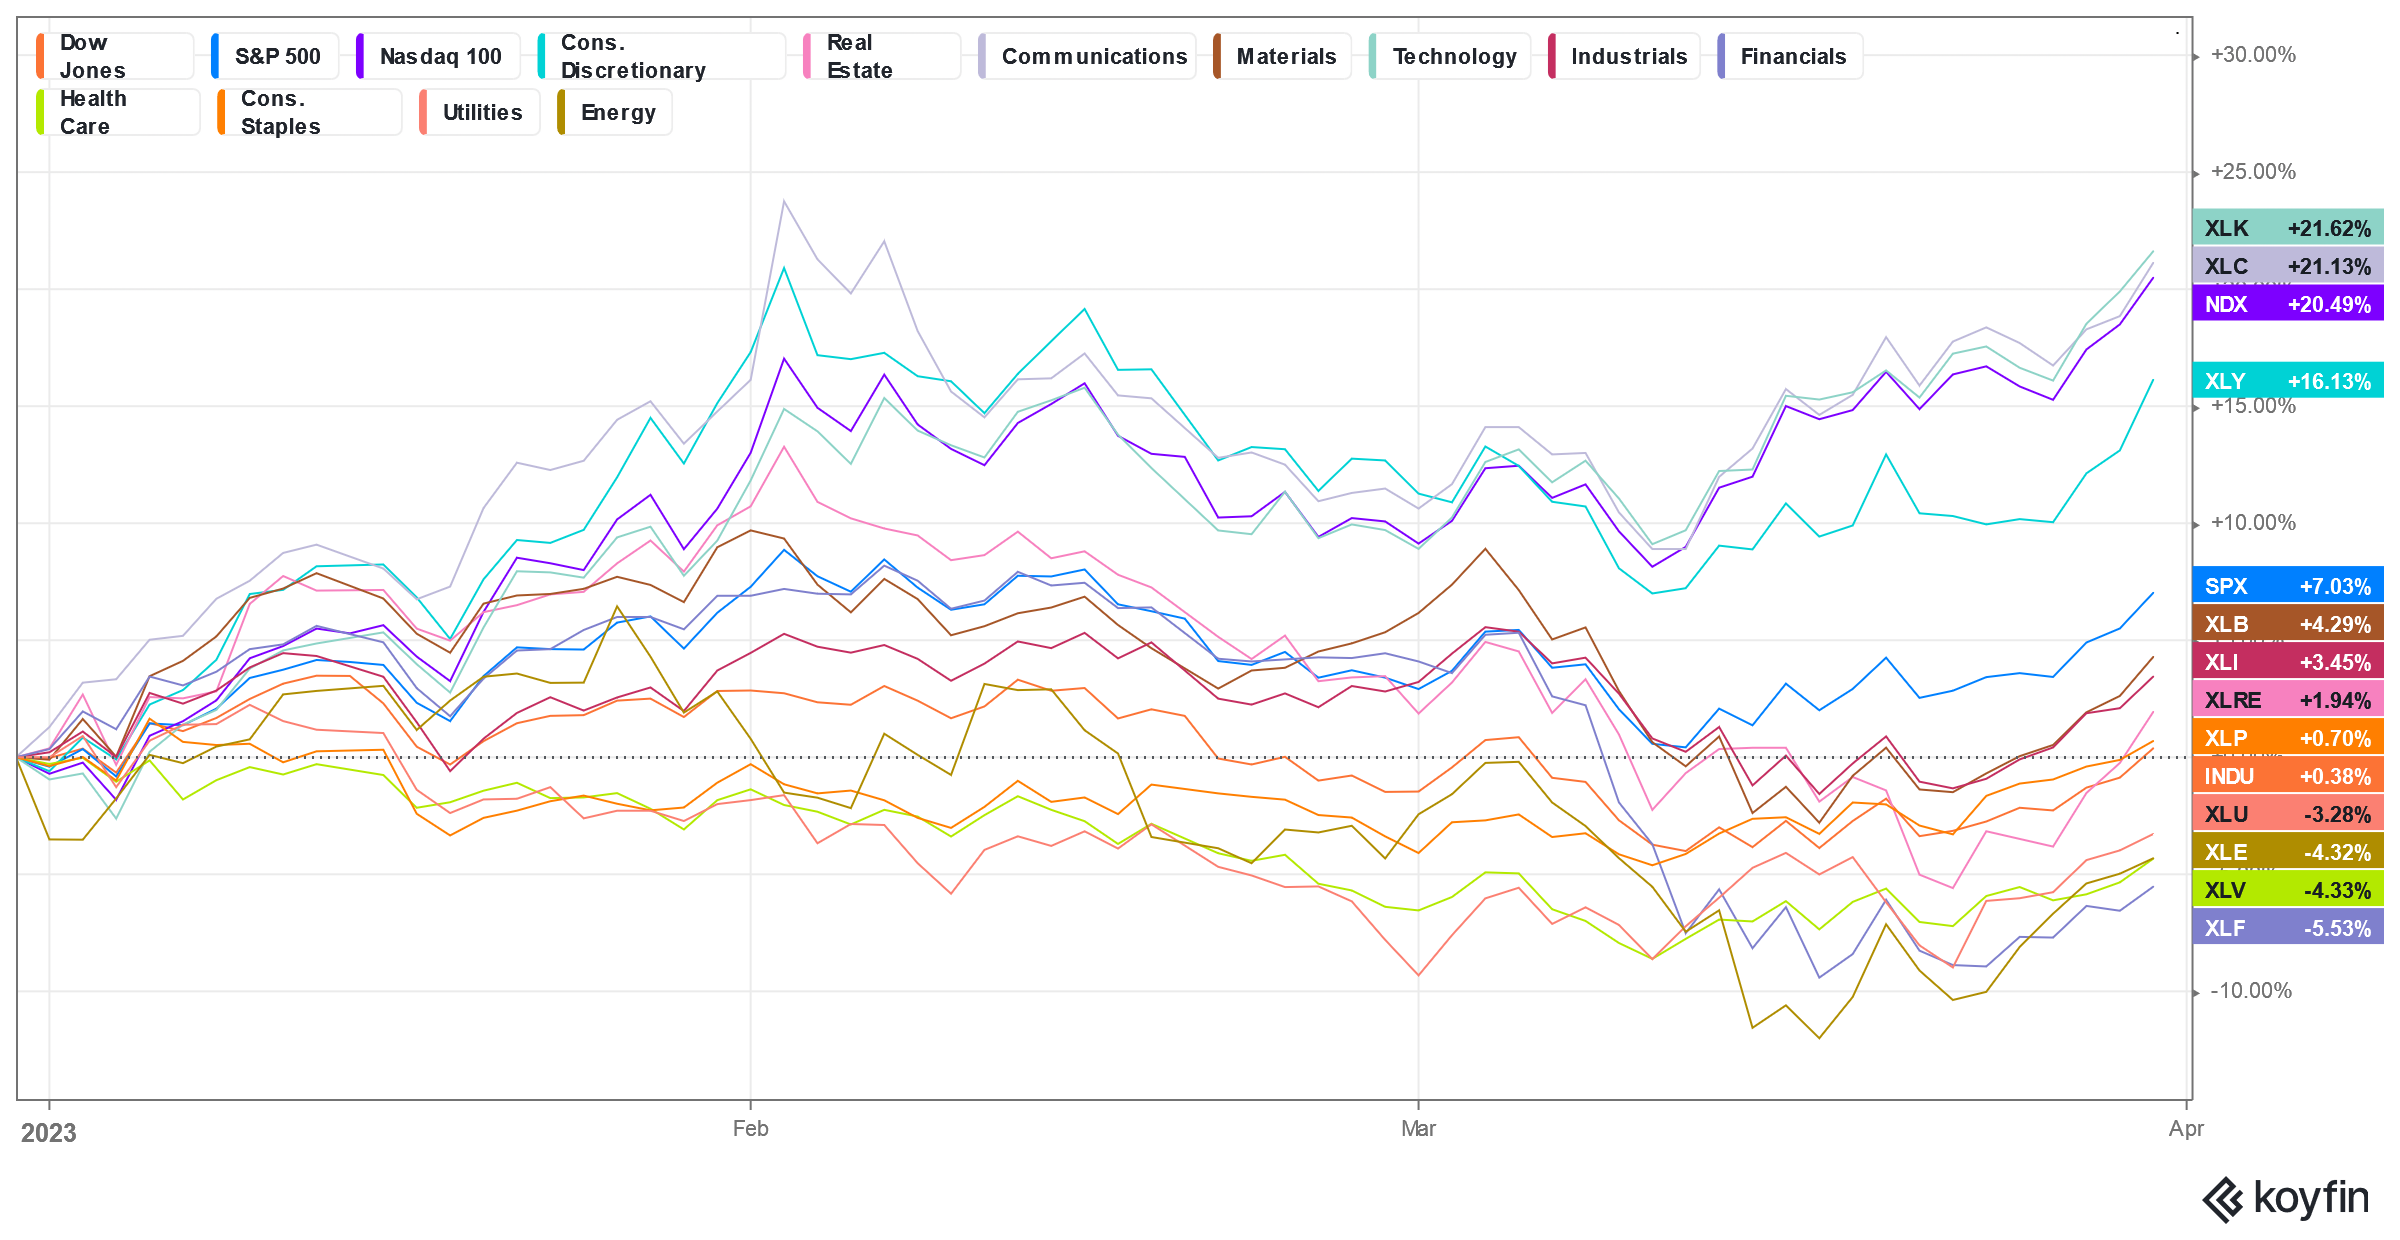
S&P Sectors Performance
Resistance
- 4128 ** ↑
- 4155 *** ↑
- 4203/4218 ***
- 4311/4315 *** ↑
- 4350 **
- 4385 *** ↑
- 4430 **
- 4486 *** ↑
- 4505 *** ↑
- 4593 **
- 4637 *** ↑
Support
- 4063 **
- 4039/4033 *** ↓
- 4009 ***
- 3986/3980 ***↓
- 3926 **
- 3868/3865 *** ↓
- 3845 **
- 3808 *** ↓
- 3799/3797 *** ↓
- 3760/3750 *** ↓
- 3667/3657 *** ↓
- 3584 **
- 3505/3491 *** ↓

