
TECHNICAL ANALYSIS
Major Indices Week of April 14, 2023
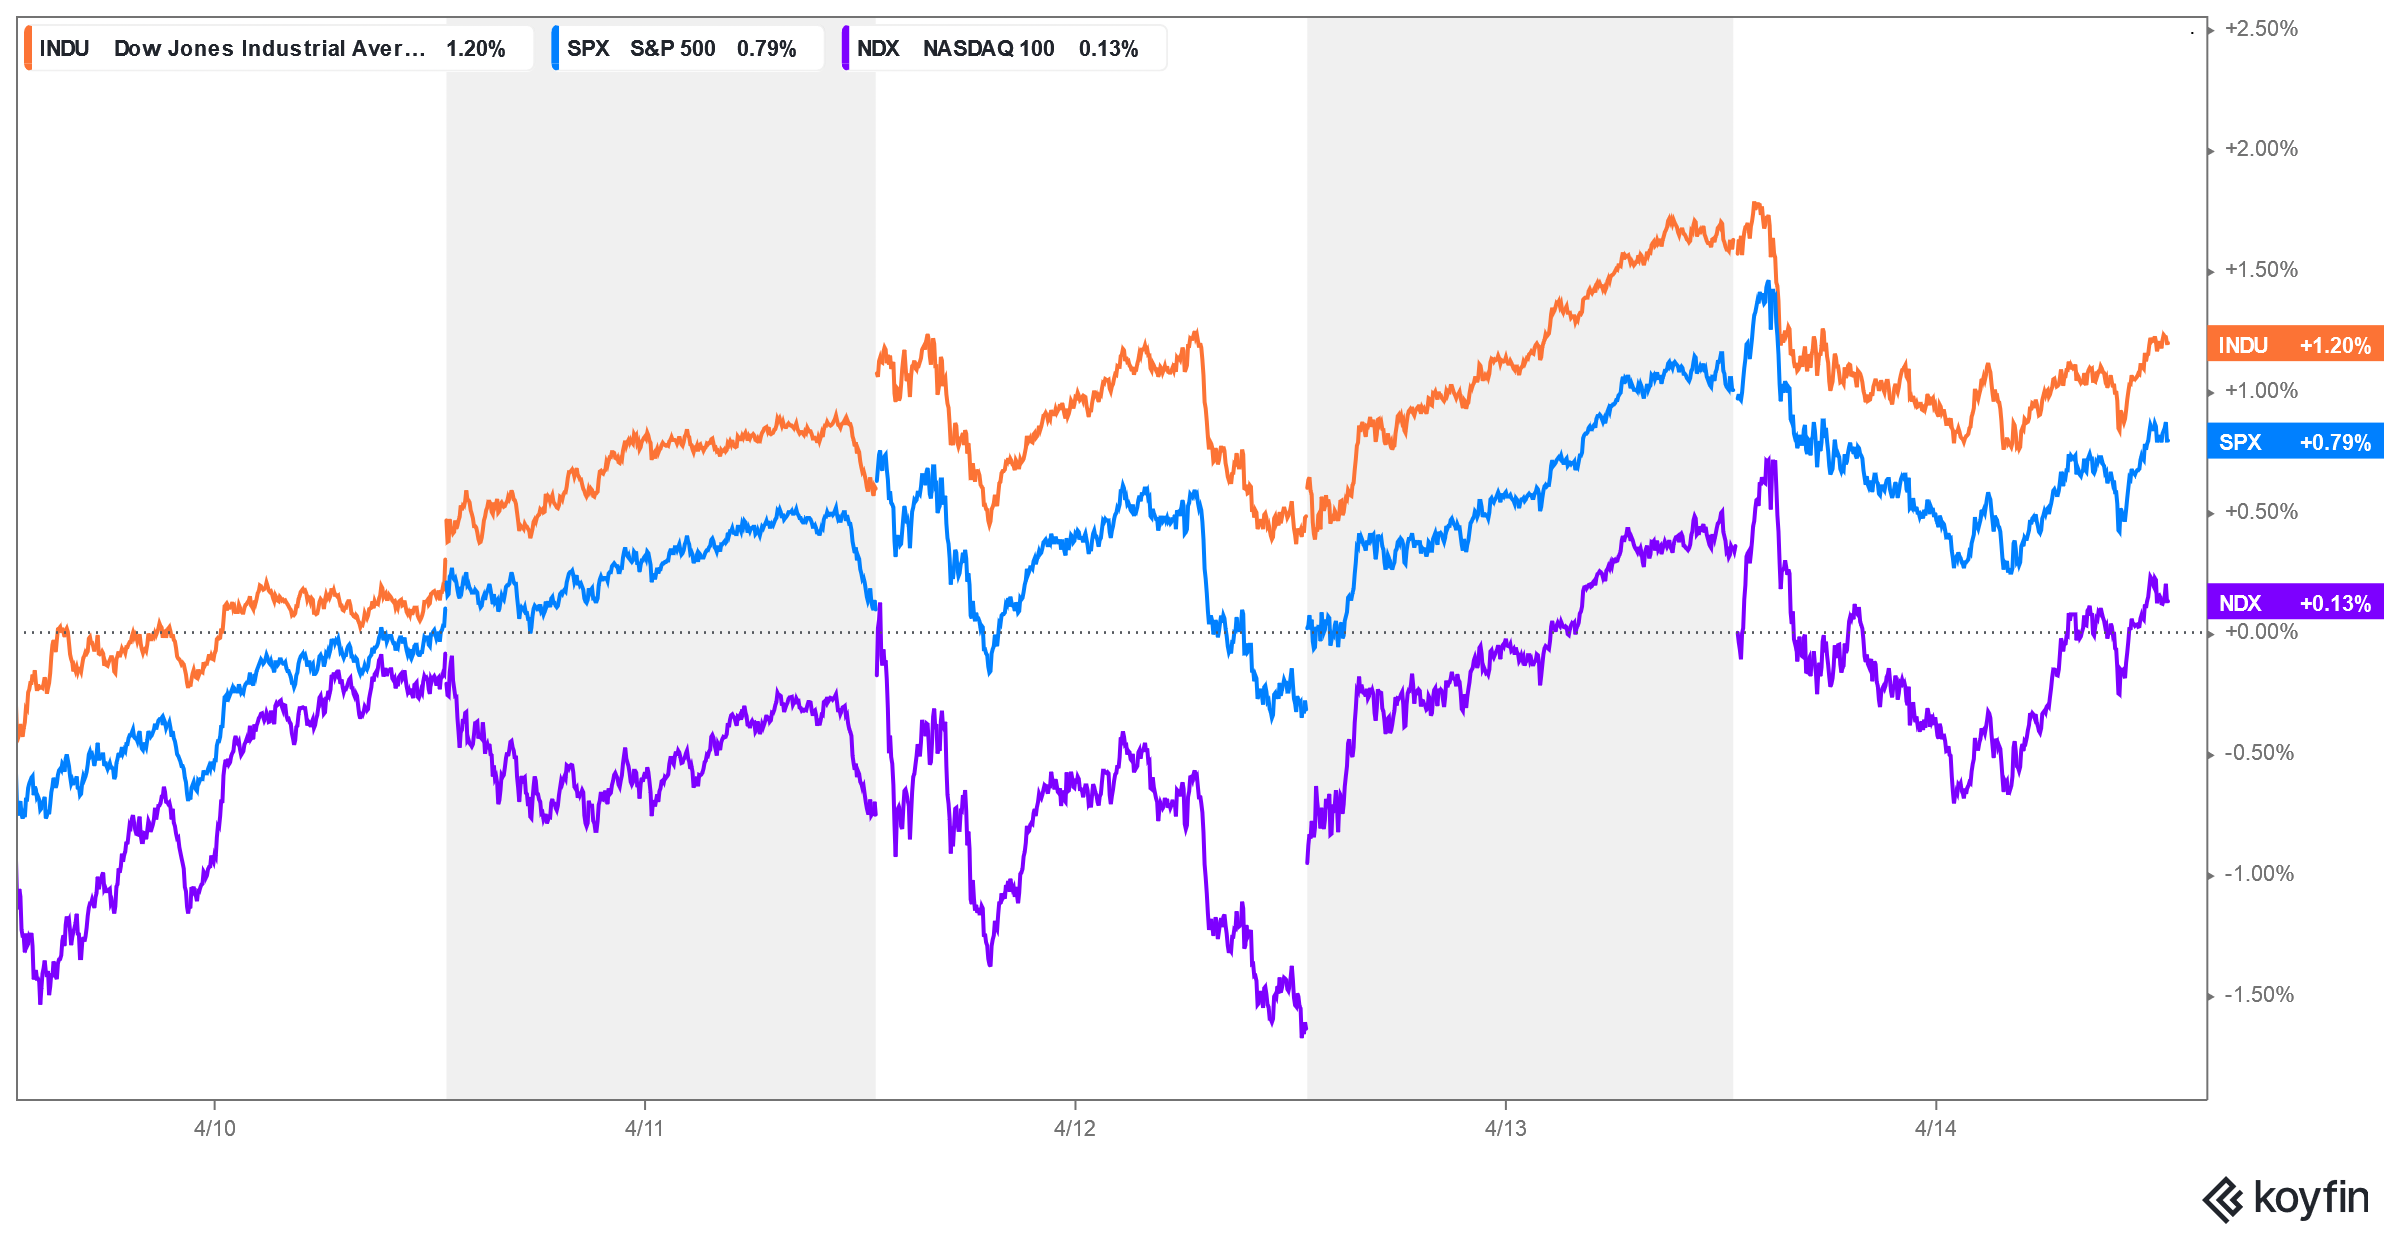
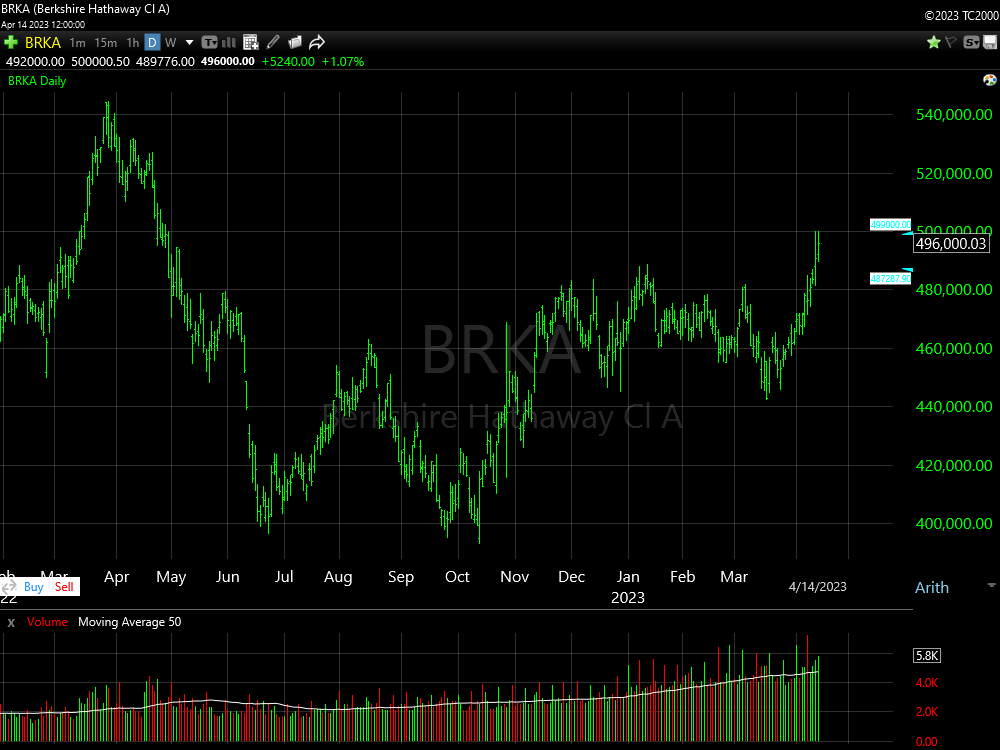
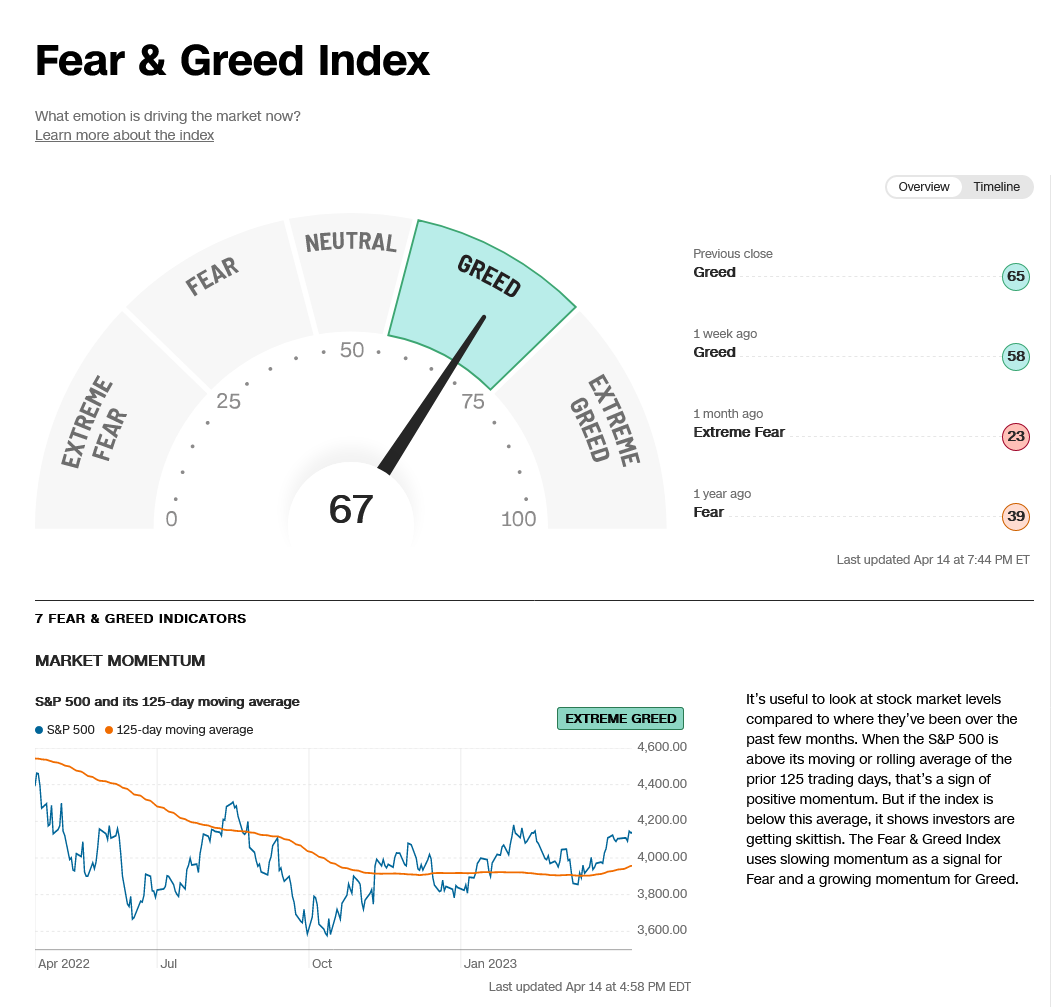
Stocks sold off on Friday to relieve some overbought short-term conditions, but the major indices all ended the week higher. The Dow closed up +1.20%, the S&P was up +0.80 and the Nasdaq up +0.30 for the week. Prices moved away from the key timing point of Monday-Tuesday to the upside. Note that there is critical timing for stocks coming this Thursday through Monday the 24th. (Also note this window may also highlight currencies and cryptos.) The past two weeks of rally has turned sentiment neutral to greedy. One significant event this past week was the breakout of BRKA to new yearly highs. BRKA is typically seen as a bellwether for the overall strength of the market, and the breakout of BRKA to new highs for 2023 is offering upside counts to the 535K area.
Berkshire Hathaway Inc BRK.A Daily HLC
Dow Jones Industrial Average Weekly HLC
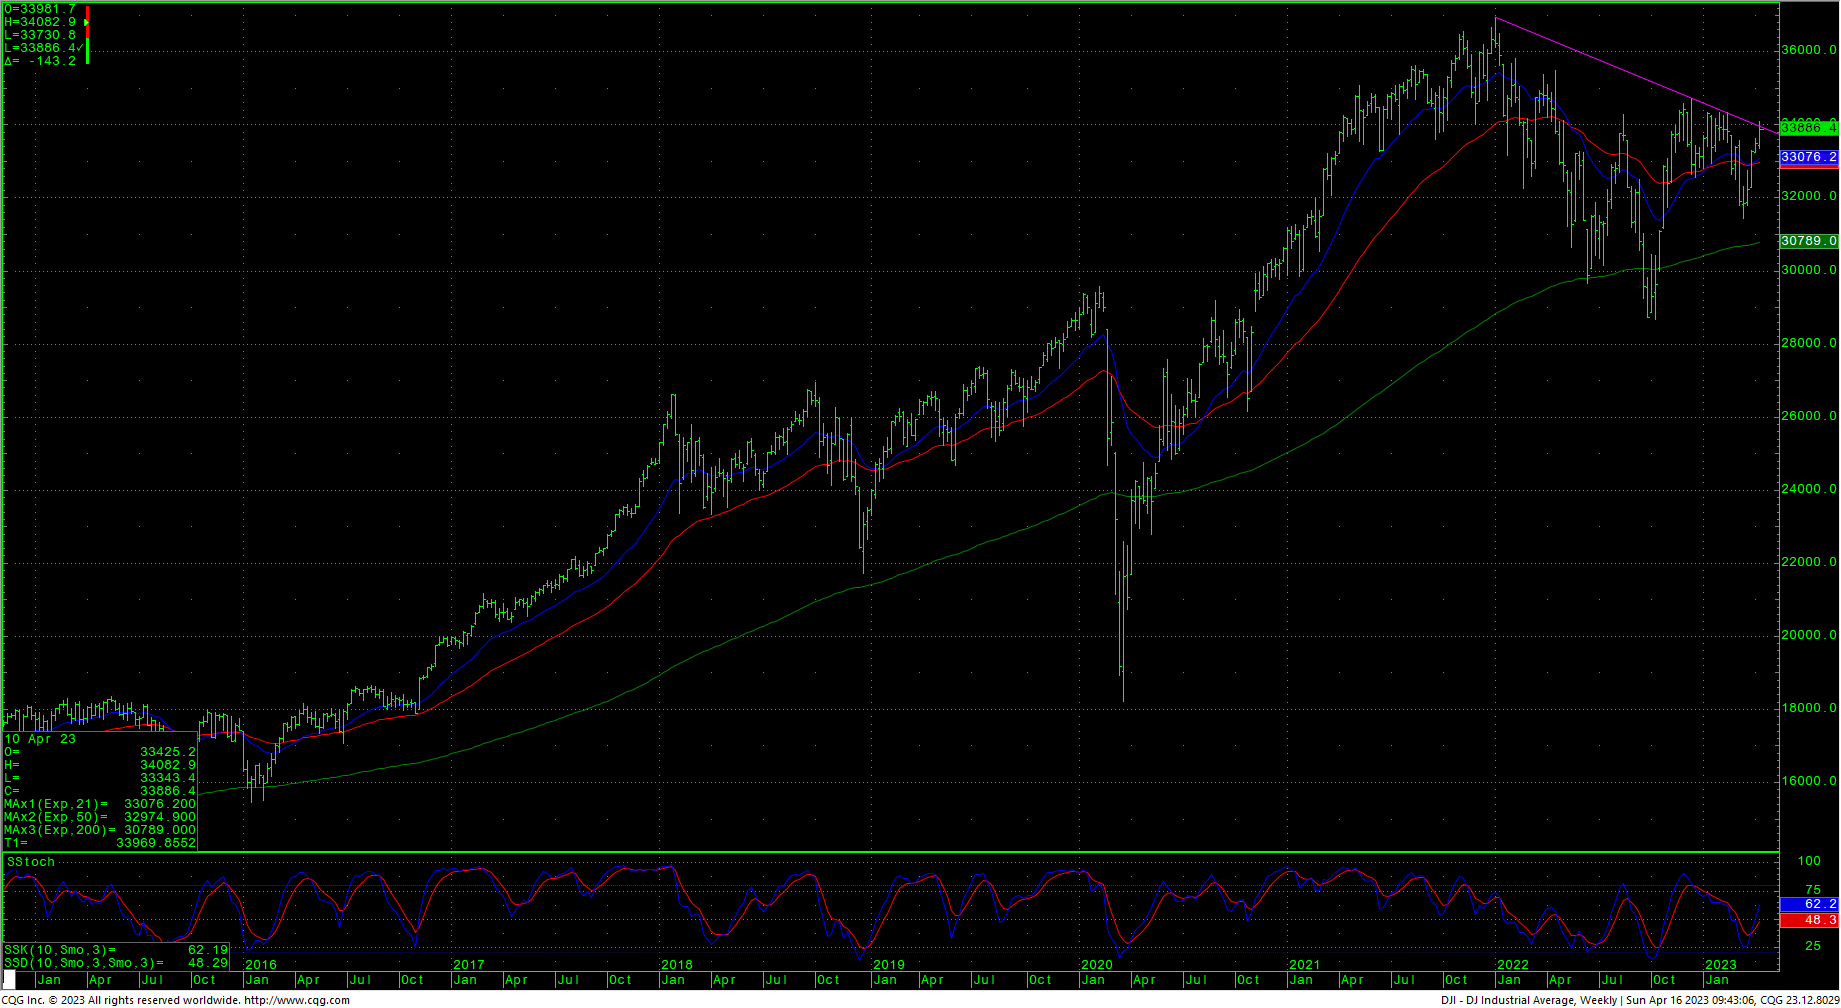
The Dow is now testing some significant trendline resistance on the daily/weekly charts and this area 33891/33937 remains as a near-term pivotal point. Continued rallies with closes over 33937 are bullish and opens counts to 34712 with resistance at 34222 and 34334/34342. A drive over 34712 can test significant long-term resistance at 34879 and 34995 and offers full counts back critical resistance at 35492. Closes over 35492 will open counts to 35824.
Dow Jones Industrial Average Hourly HLC
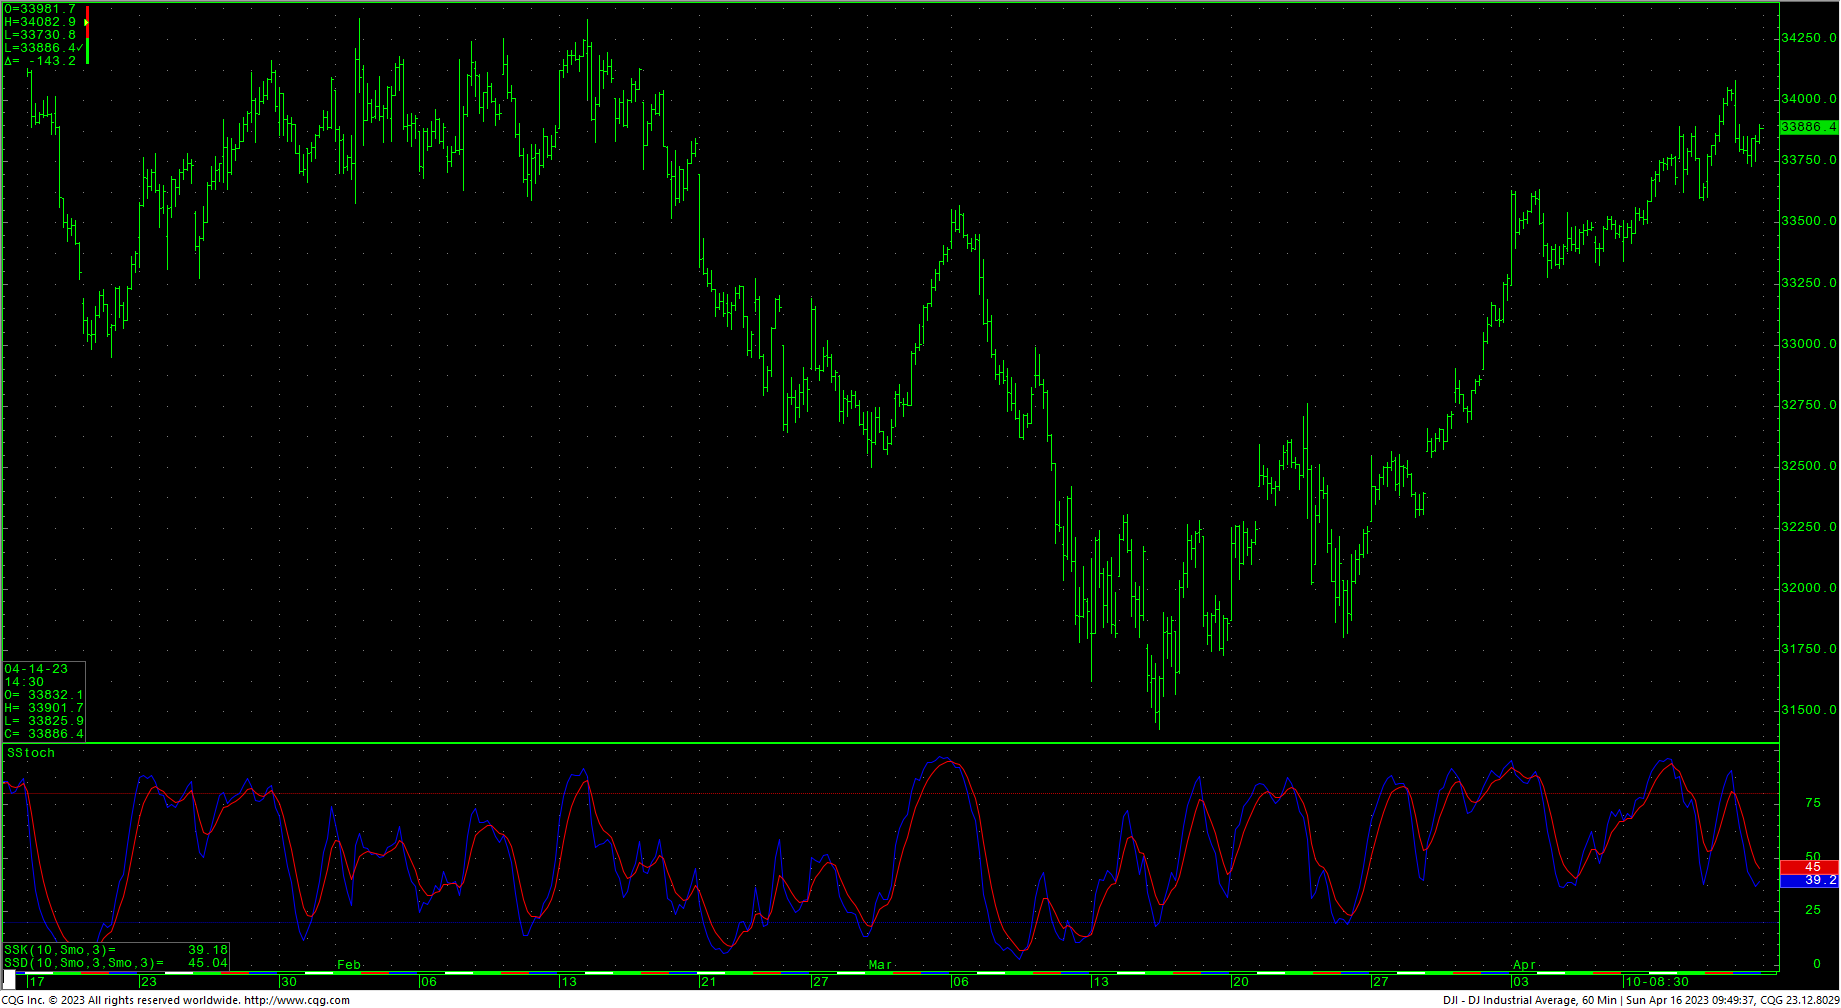
Support for the Dow is 33695 and 33456. A breakdown under 33456 can test 33262 with counts to pivotal short-term support of 33068/33060. Daily closes under 33060 setup a test of 32756 with potential to critical short-term support of 32443/32430. Closes under 32430 set up a move to intermediate support in the 31727/31686 level. A breakdown with closes under 31686 will open counts into the 30972/30960 level with support of 31429/31423 and 31160. There is a gap on the daily chart that runs from 31160 to 31119.
Resistance
- 33937 *** ↑
- 34041 **
- 34082 ** ↑
- 34130 **
- 34222 *** ↑
- 34334/34342 *** ↑
- 34395 **
- 34495 **
- 34595 **
- 34712 *** ↑
- 34879 ***
- 34995 *** ↑
- 35112 **
- 35225 **
- 35372 ***
- 35492 *** ↑
CNN Fear & Greed Index
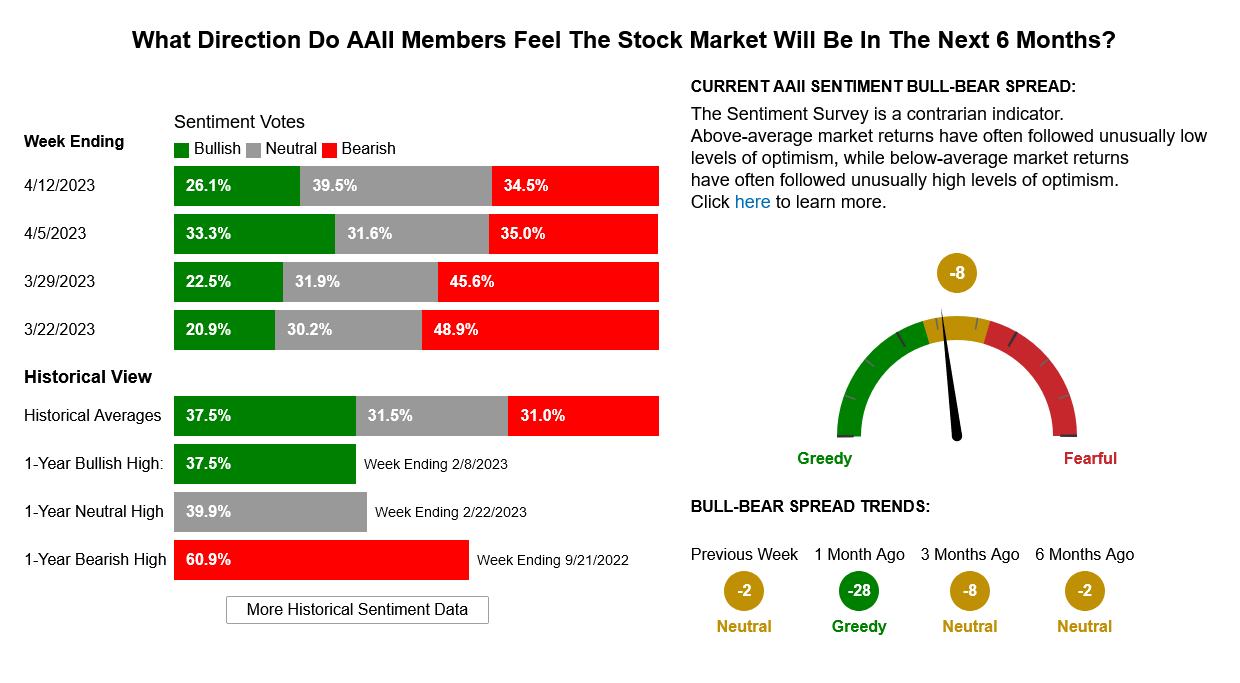
AAII Investor Sentiment Survey
Support
- 33730 **
- 33695 ***
- 33593 **
- 33456 *** ↓
- 33360 **
- 33262 *** ↓
- 33200 **
- 33068/33060 *** ↓
- 32968 **
- 32850 ***
- 32756 *** ↓
- 32660 **
- 32532 **
- 32443/32430 *** ↓
- 32360 **
- 32260 **
- 32149 **
- 32055 ***
- 31950 **
- 31809 ***
- 31727 *** ↓
- 31686 *** ↓
S&P 500 Cash Index
The S&P closed lower Friday. The daily is extremely overbought as prices inch their way back toward the 2023 highs. The selloff on Friday relieved overbought short-term conditions and the weekly stochastics are trying to turn higher with the past few weeks of rallies. Resistance key at 4155. Further rallies with daily closes over 4155 should test the overhead gap area at 4203 to 4218 and longer-term counts to critical resistance of 4311/4315. Daily closes over 4315 open counts to 4385 with full potential to long-term critical resistance of 4486/4505. Closes over 4505 can carry to 4593 with full potential toward 4637. A breakout above 4637 opens potential toward 4748 and ultimately 4818.
S&P 500 Index Weekly HLC
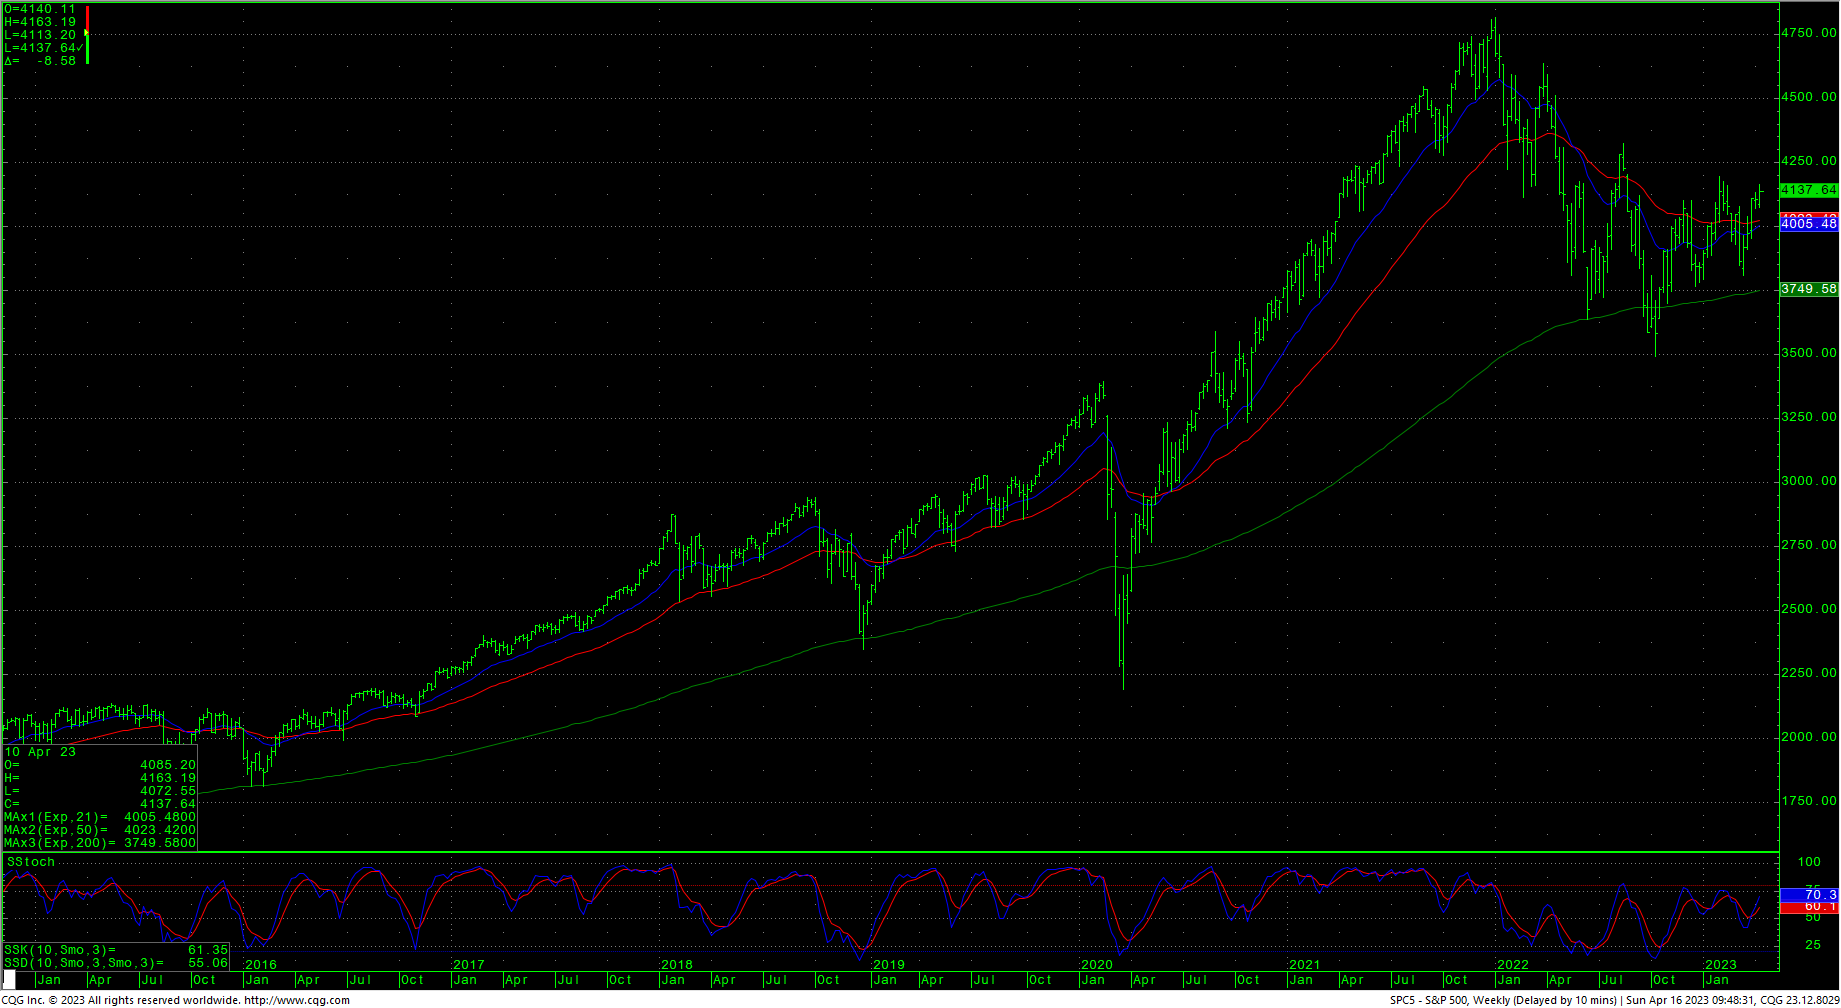
Support is 4113/4111 and, short-term, a key band is at 4079/4069. A breakdown under 4069 should test 4053 with counts to 4027/4024. Closes under the 4024 level should carry to 3986 with counts to pivotal near-term support of 3944/3940. Closes under 3940 setup a retest of 3868/3865. A breakdown under 3865 can test 3808 through 3797. A breakdown with closes under 3799/3797 opens counts to critical support against the 3760/3750 level. Under 3750 sets up a move to 3657 and full potential back to critical long-term support of 3505/3491.
Resistance
- 4155/4163 *** ↑
- 4203/4218 ***
- 4311/4315 *** ↑
- 4350 **
- 4385 *** ↑
- 4430 **
- 4486 *** ↑
- 4505 *** ↑
- 4593 **
- 4637 *** ↑
Support
- 4113/4111 *** ↓
- 4096 **
- 4079/4069 *** ↓
- 4053 *** ↓
- 4027/4024 ***↓
- 3995 ***
- 3965 **
- 3944/3940 *** ↓
- 3868/3865 *** ↓
- 3845 **
- 3808 *** ↓
- 3799/3797 *** ↓
- 3760/3750 *** ↓
- 3667/3657 *** ↓

