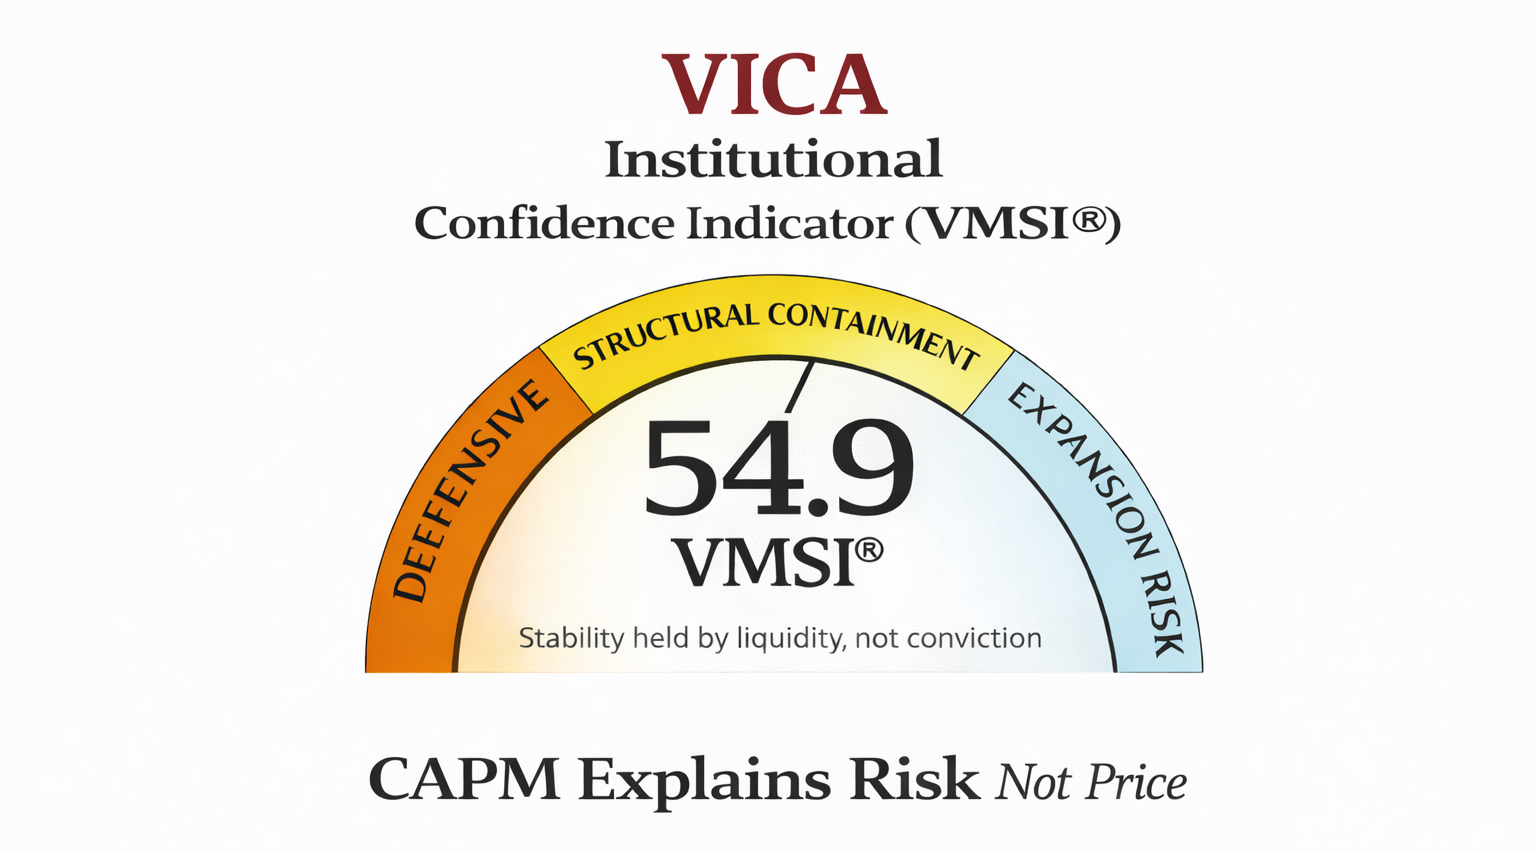
A key indices analysis refers to the examination of various financial indices that are commonly used to measure the performance and trends of financial markets or specific sectors within the markets. Analyzing key indices over different time frames, such as one month and six months, can provide insights into short-term and medium-term market movements. However, it’s important to note that the specific indices and their performance will depend on the country or region you are referring to. Here are some general considerations:
- Short-Term (1-Month) Key Indices Analysis:
- Volatility: Assess the level of volatility in the market by examining indices such as the CBOE Volatility Index (VIX) or the average daily price fluctuations.
- Performance: Look at the overall performance of indices to identify any significant gains or losses during the month. This can help identify short-term trends or events affecting the market.
- Sector Analysis: Examine sector-specific indices to determine which sectors have been outperforming or underperforming. This analysis can highlight shifts in investor sentiment or changes in market dynamics.
- Macroeconomic Factors: Consider any significant macroeconomic events or announcements that may have influenced market movements, such as interest rate changes, economic reports, or geopolitical events.
- Medium-Term (6-Month) Key Indices Analysis:
- Overall Trend: Look for the general trend in the market over the past six months. Identify whether the market has been experiencing an upward, downward, or sideways trend.
- Market Breadth: Evaluate the breadth of the market by examining indices that represent a wide range of companies. This can provide insights into the overall health of the market and whether it’s being driven by a few large-cap stocks or a broader base of companies.
- Comparative Analysis: Compare the performance of different indices or sectors to identify any relative outperformance or underperformance. This analysis can help identify sectors or industries that are leading or lagging in the market.
- Fundamental Factors: Consider any fundamental factors, such as economic indicators, corporate earnings, or policy changes, that may have influenced market movements over the six-month period.
It’s important to remember that analyzing key indices is just one aspect of understanding the overall market. Other factors, such as individual company analysis, valuation metrics, and risk assessment, should also be considered for a comprehensive investment decision.


