
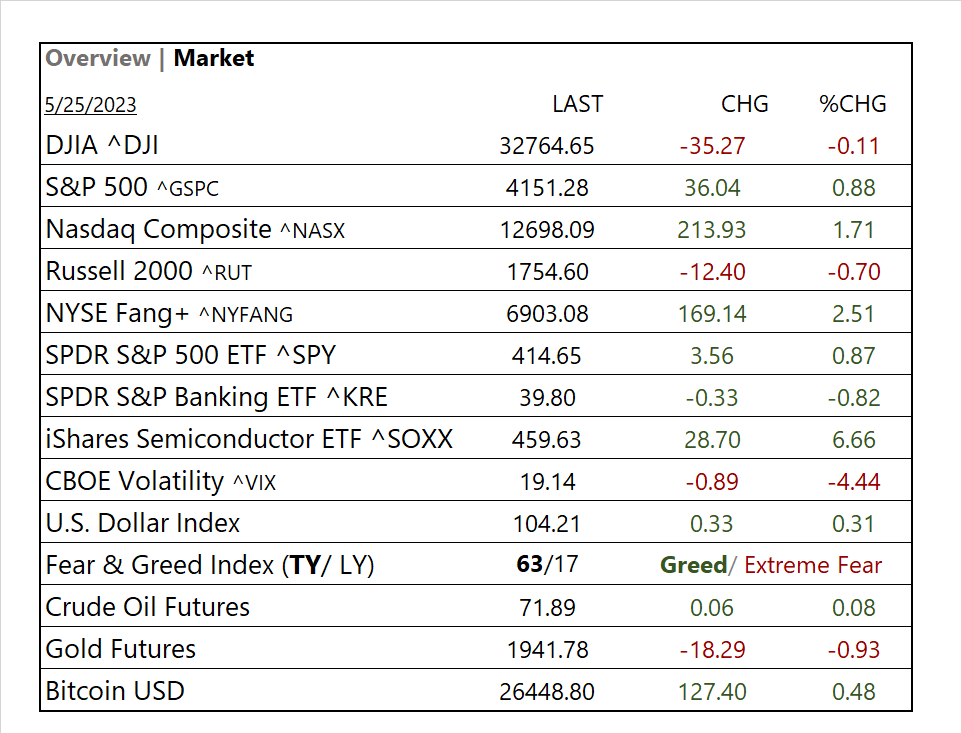
MARKETS TODAY May 25th, 2023 (Vica Partners)
On Wednesday, US Markets finished lower, S&P 500 -0.73%, DOW -0.77%, Nasdaq -0.61%. 10 of 11 of the S&P 500 sectors lower: Real Estate -2.21% underperforms/ Energy +0.52% outperforms. Treasury Yields, USD Index and Oil all gained. In economic news, Mortgage Apps fell for 2nd consecutive week and Crude Oil Inventories had biggest decline since November. Afterhours, NVIDIA (NVDA) with important earnings beat.
Overnight/US Premarket, Asian markets finished mixed, Japan’s Nikkei 225 + 0.39%, Hong Kong’s Hang Seng -1.93% and the Shanghai Composite -0.11%. US futures were trading at 0.6% below fair value. European markets finished lower, London’s FTSE 100 -0.74, France’s CAC 40 -0.33% and Germany’s DAX -0.31%.
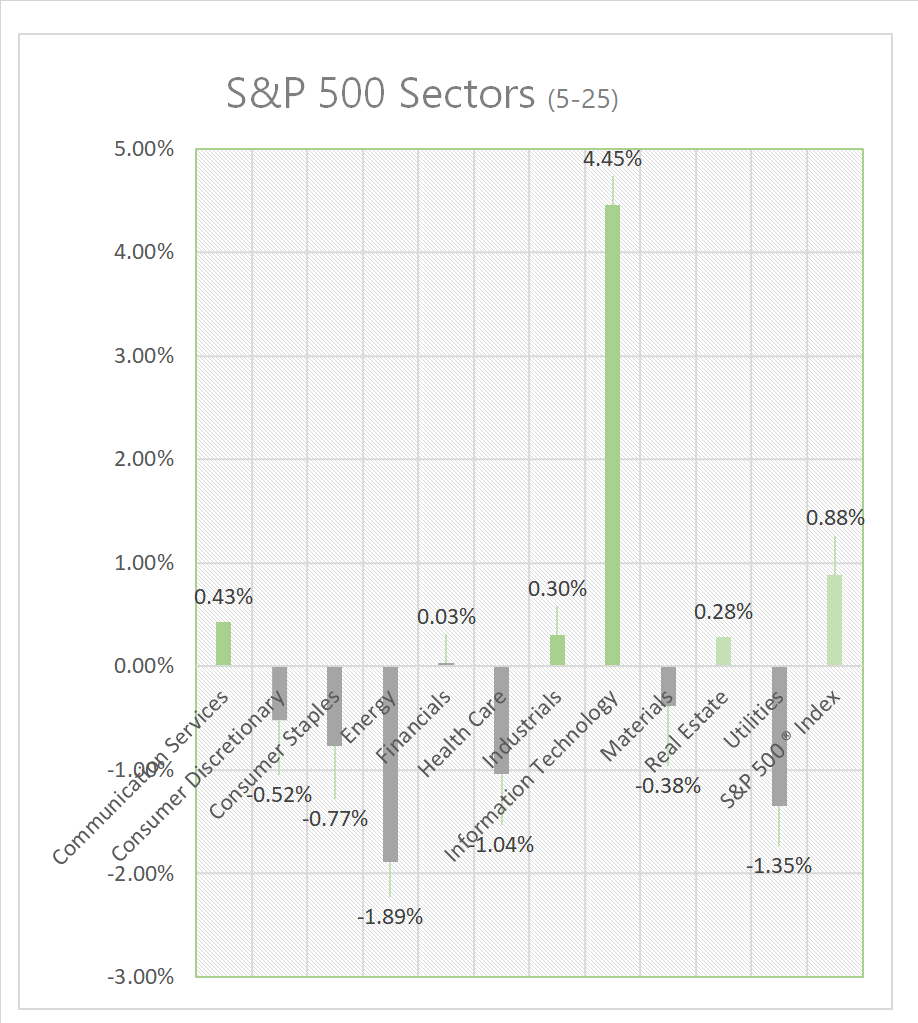
Today US Markets finished mixed, S&P 500 +0.88%, DOW -0.11% and the Nasdaq +1.71%. 6 of 11 of the S&P 500 sectors lower: Energy -1.89% underperforms/ Information Technology +4.45% outperforms. On the upside, Treasury Yields, USD Index, Bitcoin and WTI Oil. In economic news, Initial weekly Jobless Claims came in light, GDP Q1 ‘23 U.S. economic growth beat forecasts, April pending home sales flat.
Takeaways
- NVIDIA (NVDA) strong earnings/ forward guidance sparks Tech Sector rally
- Retail earnings disappoint, Costco, Dollar Tree, Best Buy and GAP miss
- NYSE FANG+ jumps 2.51%, mega cap growth tech continues
- iShares Semiconductor ETF (SOXX) +6.7%
- 6 of 11 of the S&P 500 sectors lower: Energy -1.89% underperforms/ Information Technology +4.45% outperforms
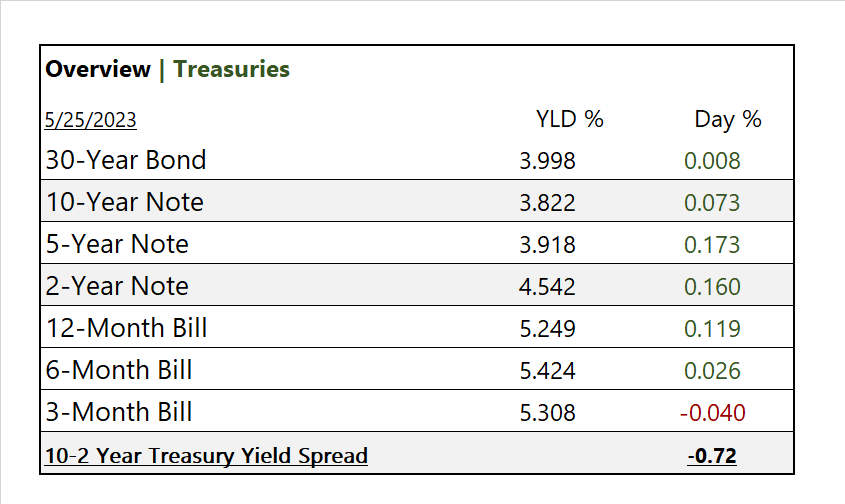
- 10/2 Treasury inverted yield spread @ -0.72 (read about below)
- Futures are currently pricing in a >46% chance of a 25bps hike
- Initial weekly Jobless Claims came in light
- Costco (COST) misses, Medtronic (MDT) beats on earnings
Pro Tip: the 10-2 Treasury Yield Spread is the difference between the 10 year/ 2 year treasury rate. A 10-2 spread @ 0 signifies a “flattening” yield curve. A negative 10-2 yield spread is a precursor to a recessionary period. A negative 10-2 spread has predicted every recession from 1955 to 2018, but occurred 6-24 months before the recession started. The 10-2 spread reached a high of 2.91% in 2011, and a low as -2.41% in 1980.
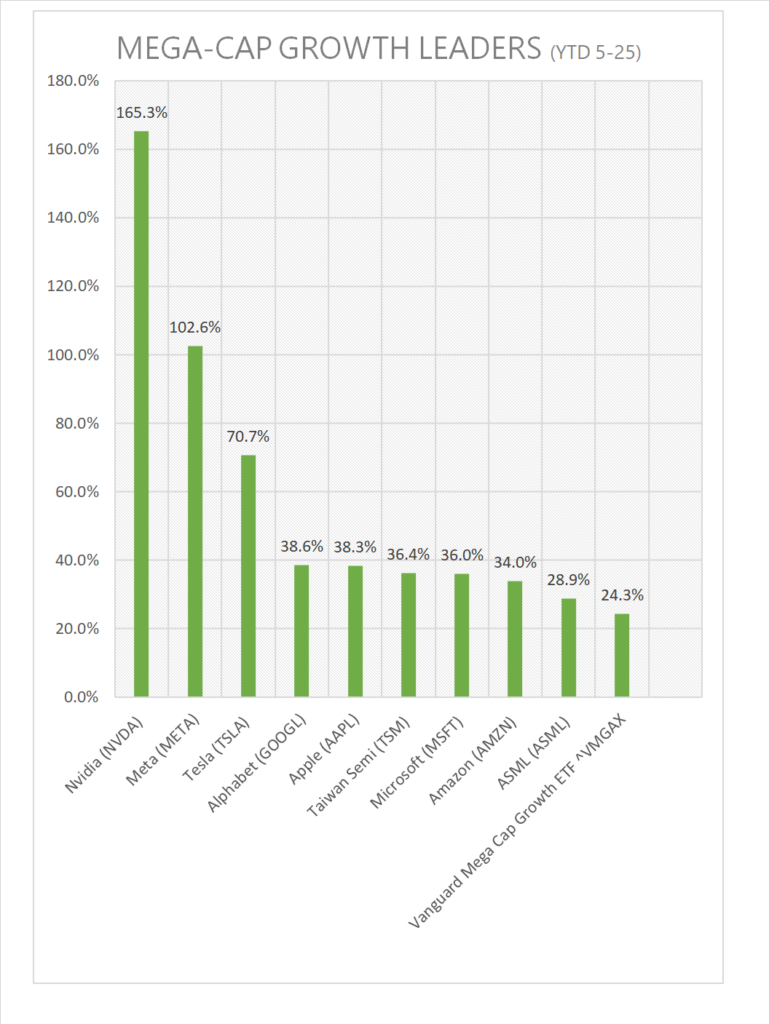
Turning attention to Mega Cap Growth (note NVDA YTD performance)…
Sectors/ Commodities/ Treasuries
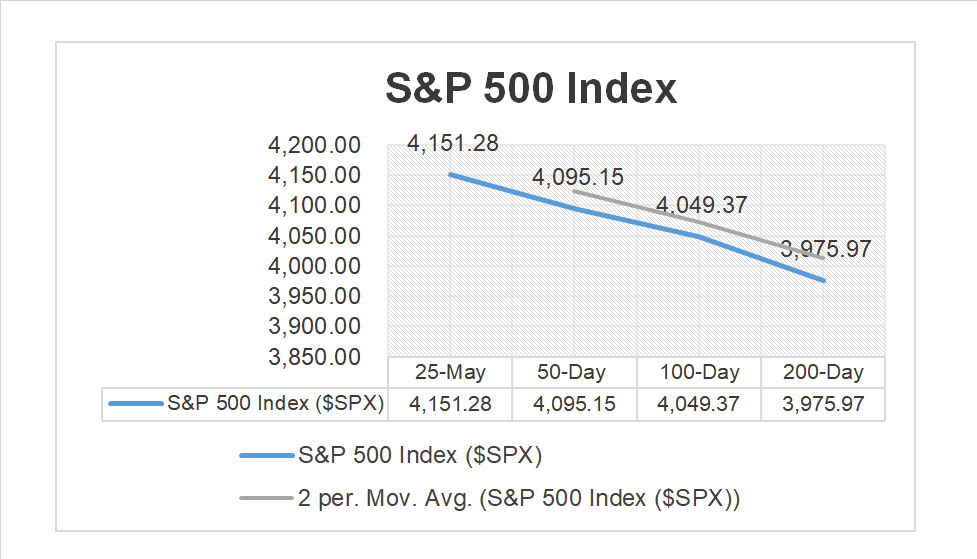
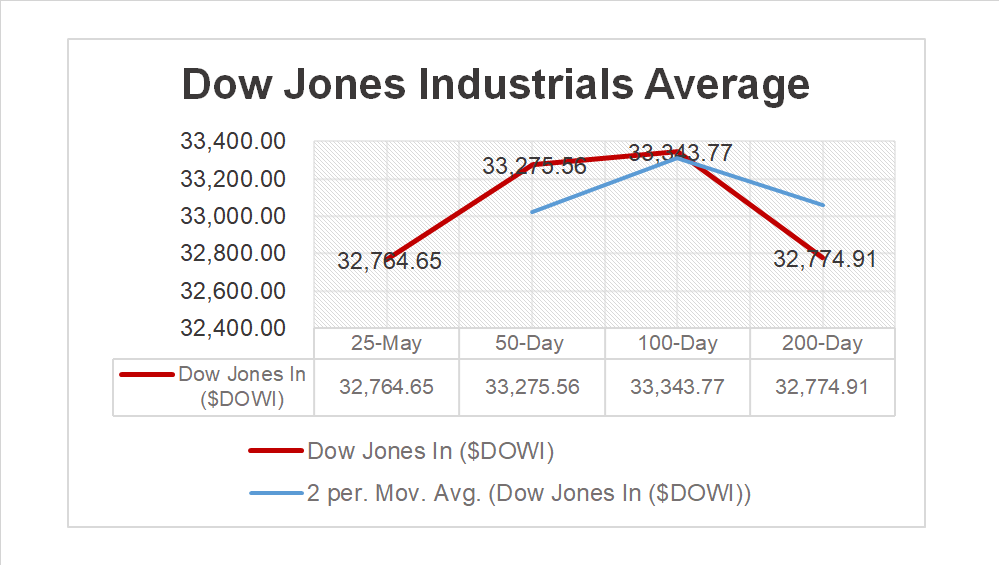
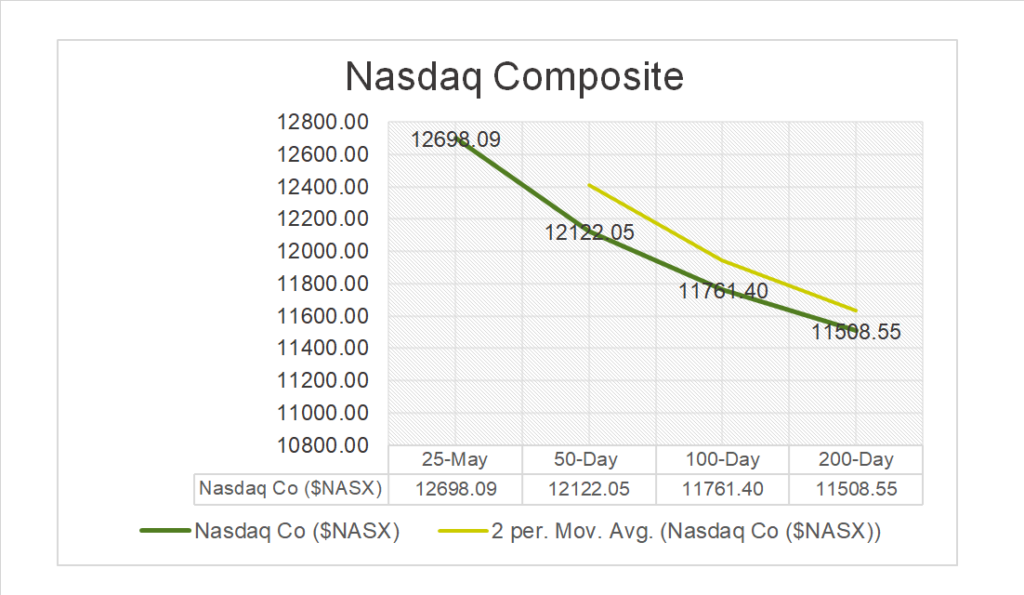
Key Indexes (50d, 100d, 200d)
S&P Sectors
- 6 of 11 of the S&P 500 sectors lower: Energy -1.89% and Utilities -1.38% lag/ Information Technology +4.45% outperforms.
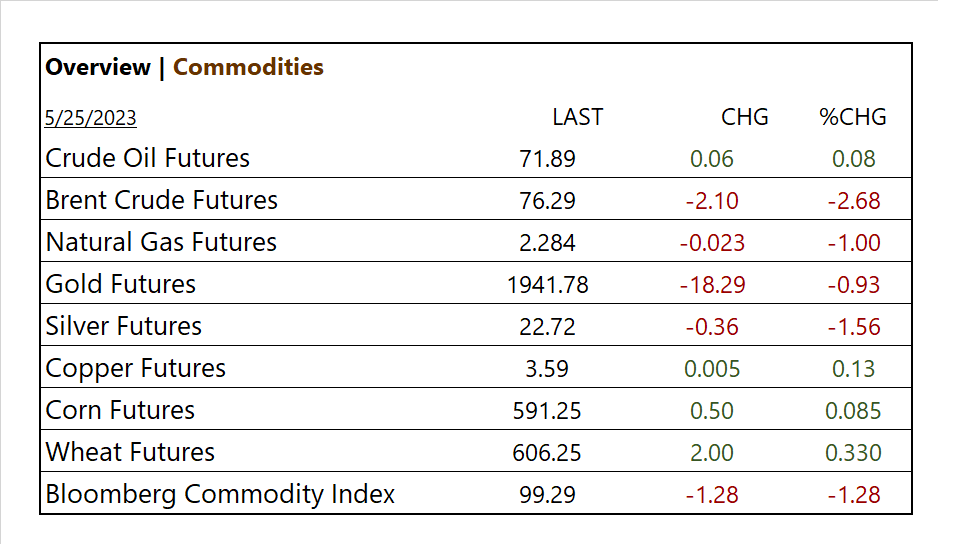
Commodities
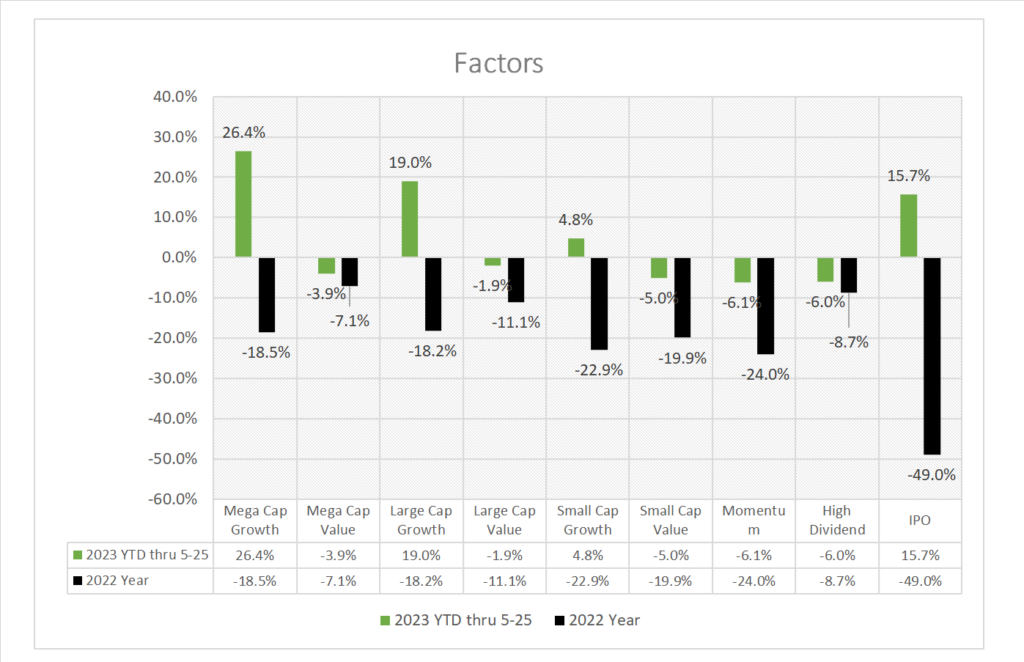
Factors (YTD)
US Treasuries
Notable Earnings Today
- +Beat: Medtronic (MDT), Meituan (MPNGF), Workday (WDAY), Marvell (MRVL), Canadian Imperial Bank (CM), Ulta Beauty (ULTA), Deckers Outdoor (DECK), Ralph Lauren A (RL), RH (RH)
- – Miss: Costco (COST), RBC (RY), Toronto Dominion Bank (TD), NetEase (NTES), Dollar Tree (DLTR), Best Buy (BBY), Burlington Stores (BURL), Gap (GPS)
- * Strong support – NVIDIA (NVDA), Meta Platforms (META), Microsoft (MSFT), Alphabet (GOOG,GOOGL), Amazon (AMZN), Apple (AAPL), Tesla (TSLA), Taiwan Semi (TSM), ASML Holding NV (ASML)
Economic Data
US
- GDP (second reading); period Q1, act 1.3%, fc 1.1%, prev. 1.1%
- Initial jobless claims; period May 20, act 229,000, fc 245,000, prev. 225,000
- Pending home sales; period April, act 0.0%, fc 0.5%, prev. -5.2%
News
Company News
- Chip giant Nvidia nears trillion-dollar status on AI bet – Reuters
- AI-Focused ETF Assets Could Triple to $35 billion by 2030 – Bloomberg
- Kohl’s, Costco, Lowe’s Sales Sluggish as Shoppers Pull Back – WSJ
Energy/ Materials
- Biden’s Billion-Dollar Oil Trade Faces a Big Test – WSJ
- Investments in Solar Power Eclipse Oil for First Time – WSJ
Central Banks/Inflation/Labor Market
- Exclusive: Slimmed-down U.S. debt ceiling deal takes shape –sources – Reuters
- Even a ‘Mild’ US Recession Comes With Steep Price in Lost Jobs – Bloomberg
China
- Economists Trim China Growth Forecasts, Expect Reserve Requirement Ratio Cut Sooner – Bloomberg
Education
- In technical analysis, a death cross is a term used to describe a bearish signal that occurs on a price chart when a shorter-term moving average crosses below a longer-term moving average. The interpretation of a death cross depends on the specific moving averages being used and the context in which it occurs. Here’s a general interpretation of a technical death cross.


