
TECHNICAL ANALYSIS
Major Indices Week of June 2, 2023
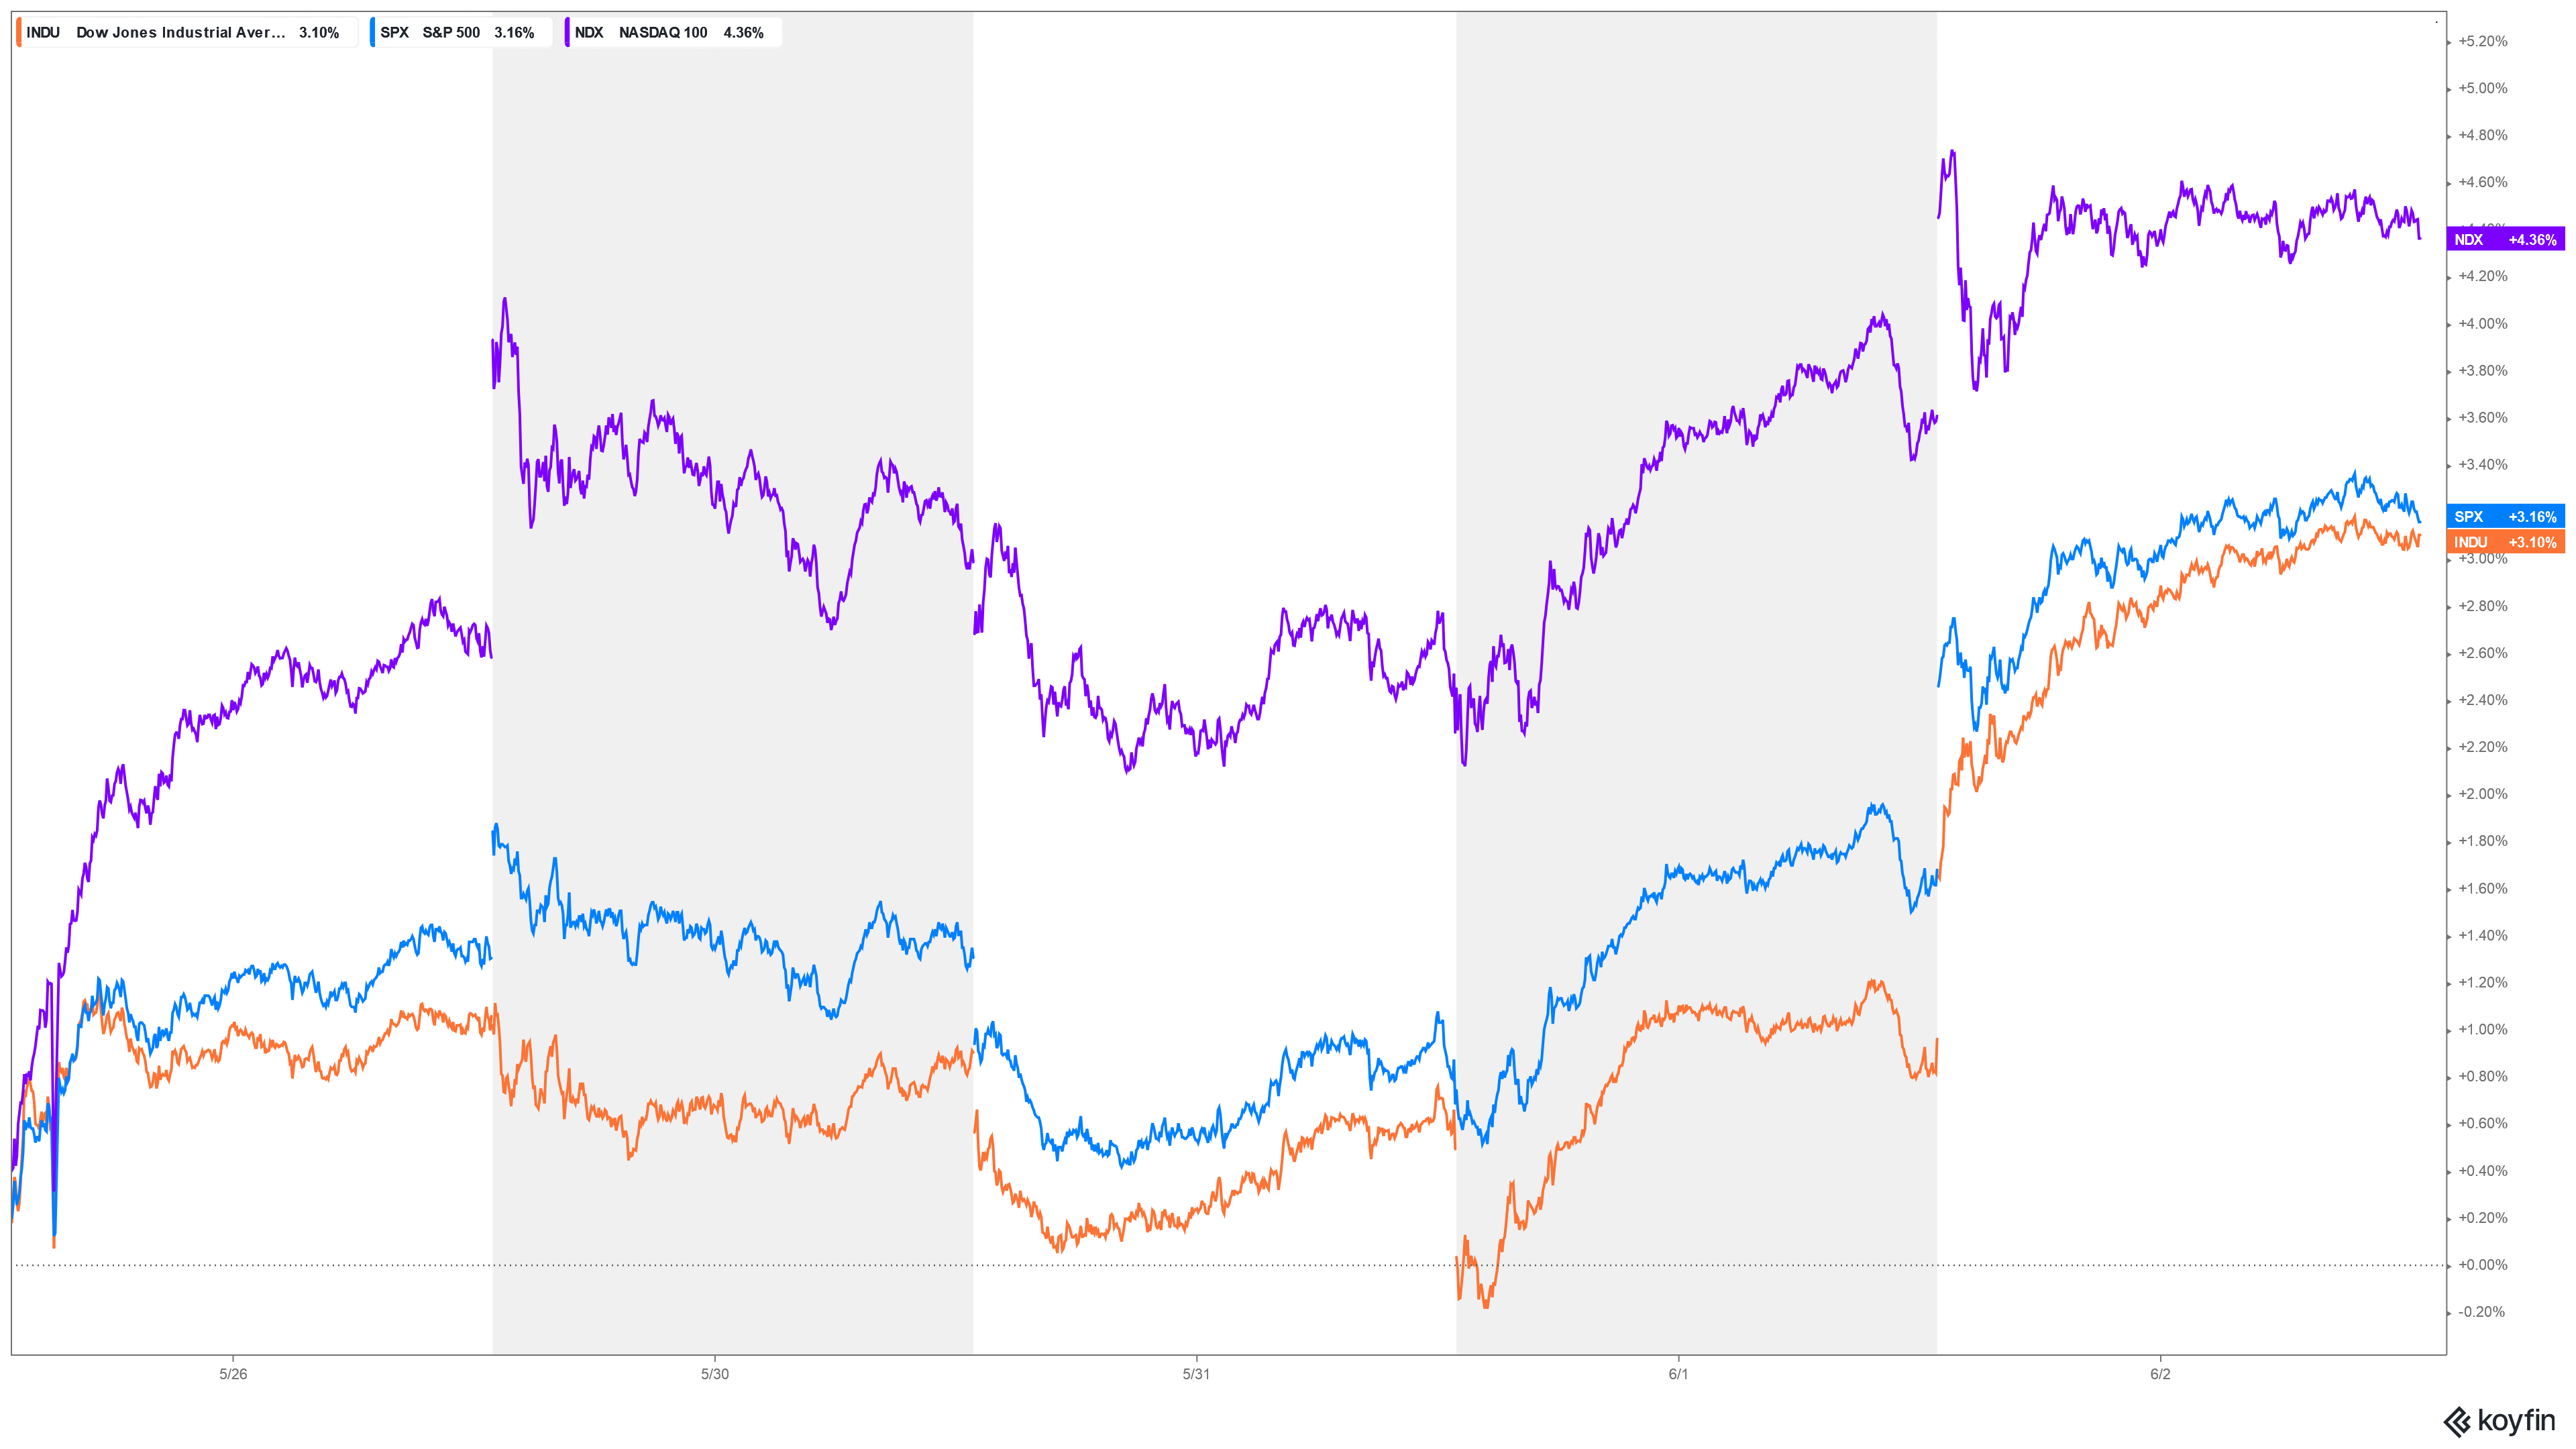
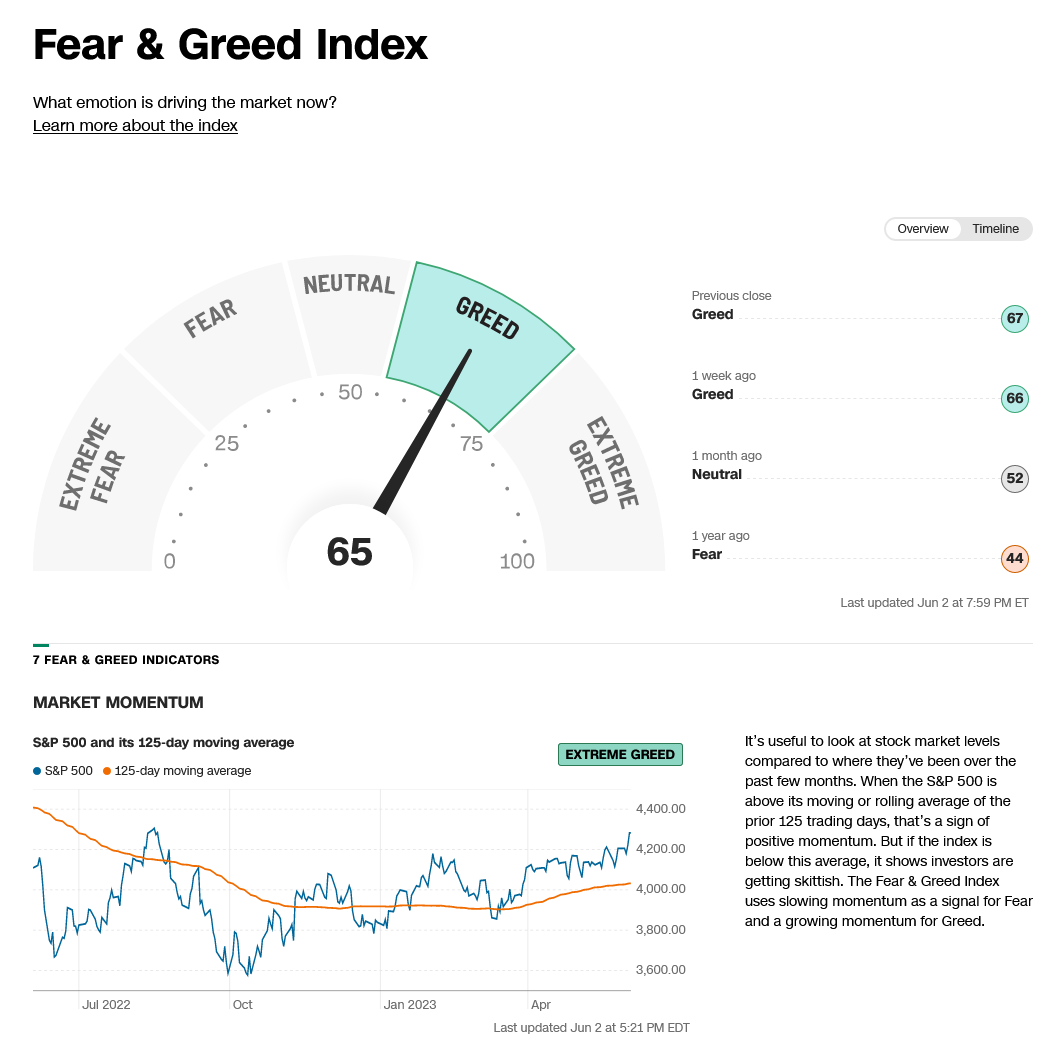
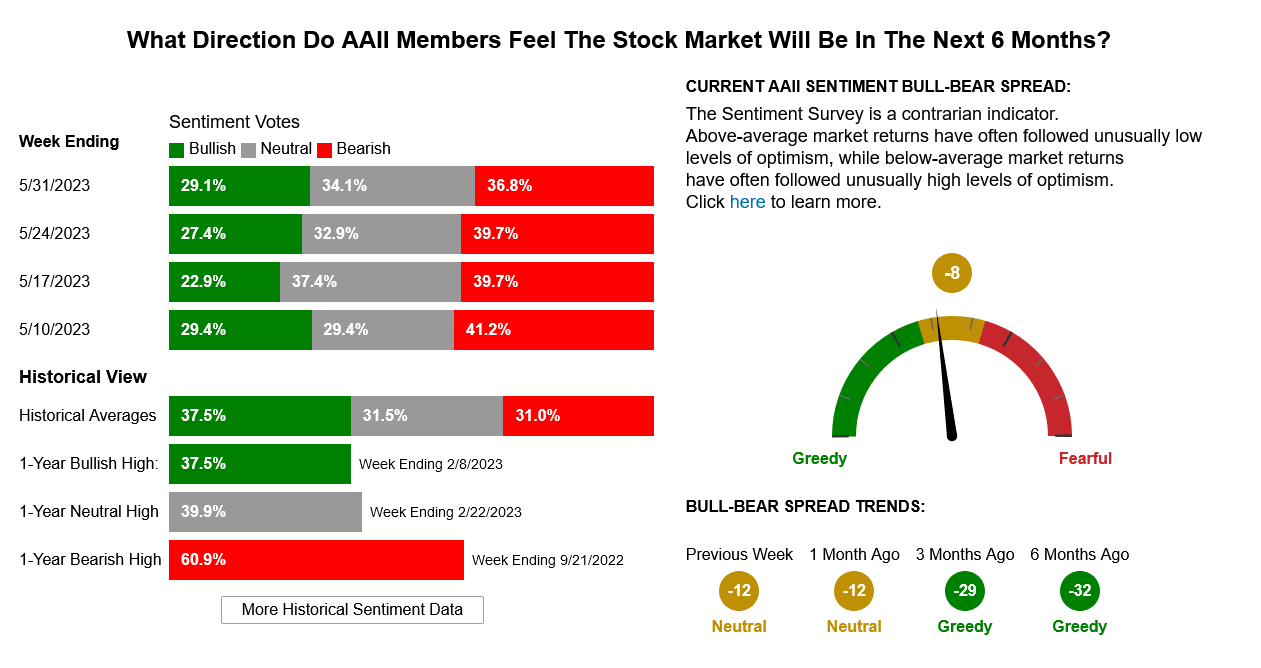
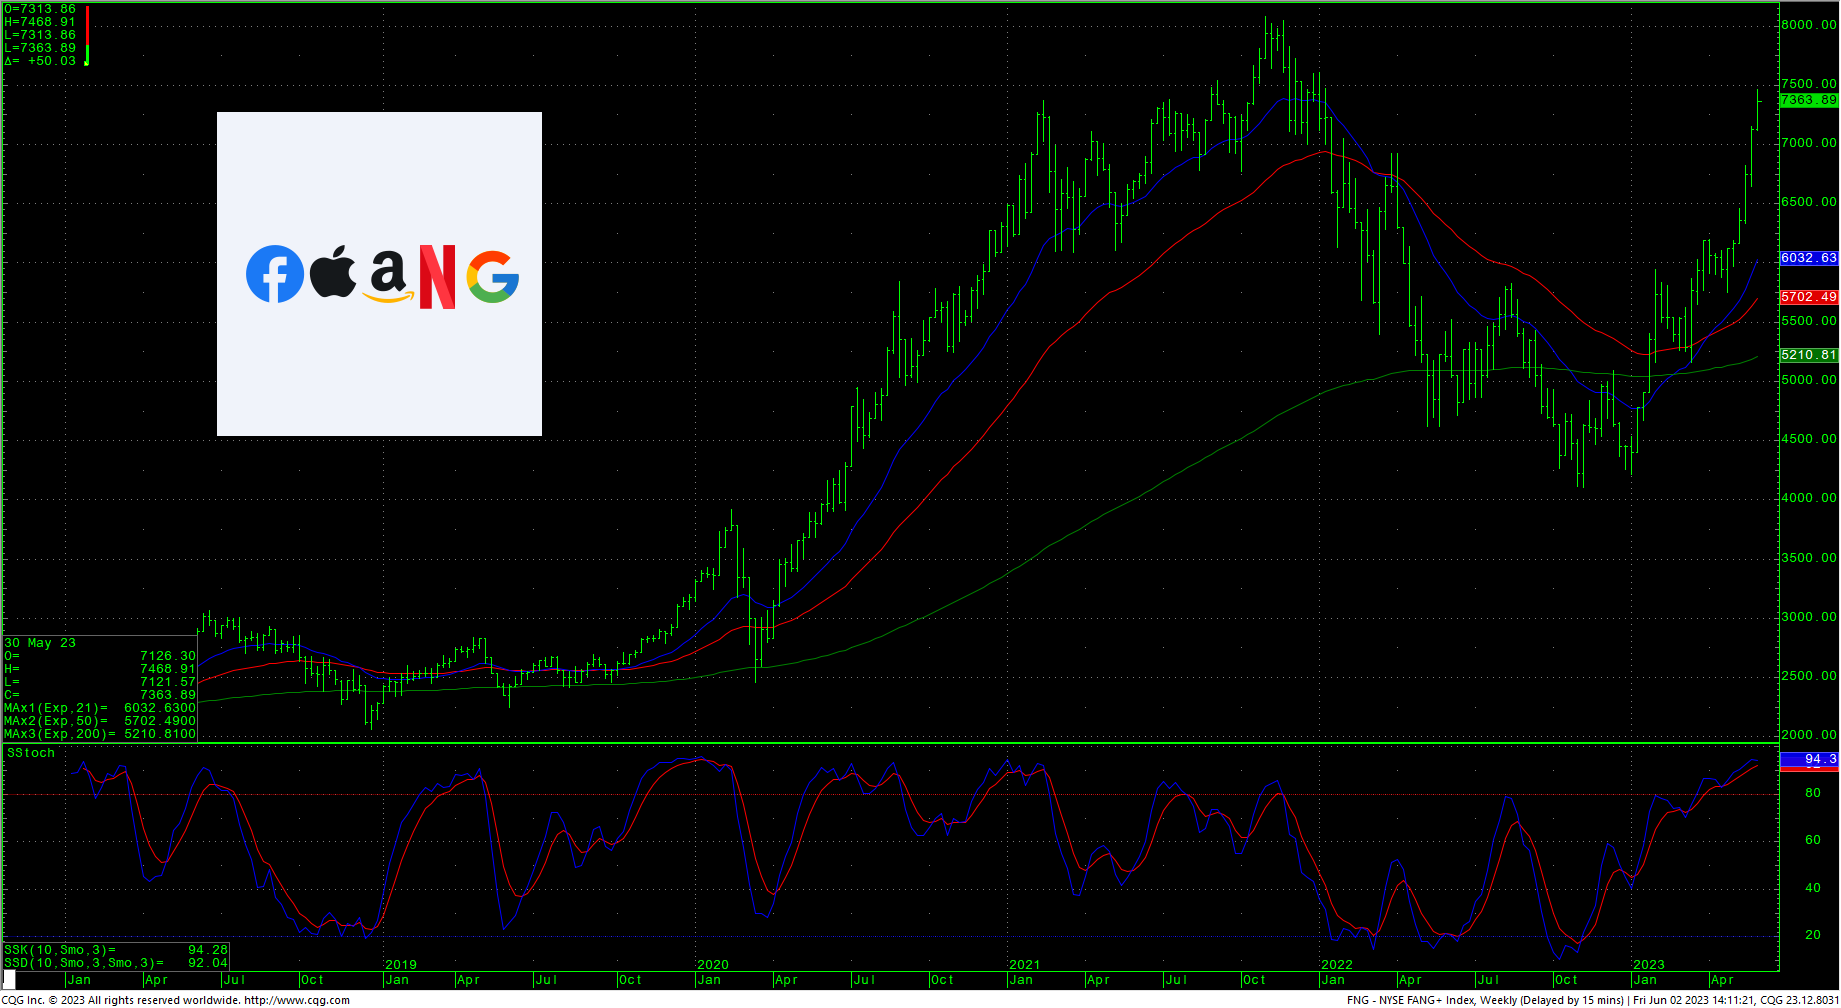
Stocks finished out another whipsaw week with sharp rallies in Friday’s session, carrying the S&P500 to the highest daily close since 21 April, 2022. The market set a short-term swing high in Tuesday’s minor timing and now we are in a CRITICAL window where there may be large moves and a possible extreme. The action leaves the hourly charts in very overbought condition and the Dow weekly stochastics are trying to hook up again after turning down just one week ago. Once again, the tech and secondary markets pulled the overall market upward. The Dow closed the week up +2.02% at the highest weekly close since late April. The S&P was up +1.83% to the highest weekly close since 11 April, 2022. The Nasdaq ended the week up +2.02%, setting the highest daily close since 21 April, 2022. The FANG settled up +3.33% and it is the highest weekly close since 27 December, 2021. The FANG is now up +70.3% from it’s low in November of 2022. Sentiment remains neutral to greedy as pessimism in the funds continues to battle the commercial longs. The Commitment of Traders (CoT) still favors the commercials. The AAII Survey has new recorded the 15th straight week of ‘above average’ pessimism, ”bullish sentiment remains below its historical average of 37.5% for the 78th time out of the last 80 weeks.” The VIX set the lowest weekly close since 10 February, 2020.
BRKA Daily Chart
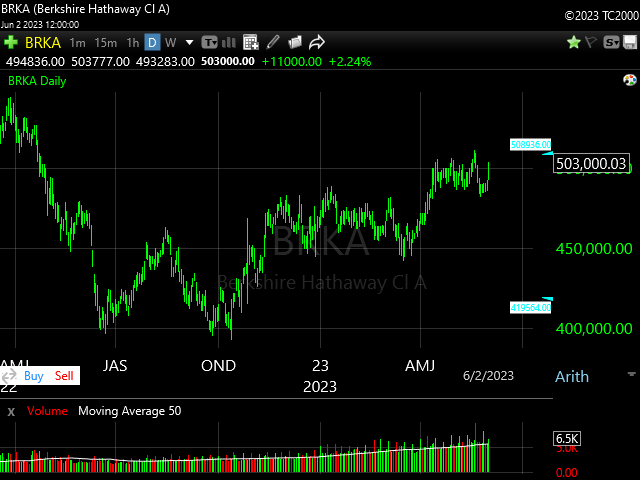
Reflecting on last week’s comment for BRKA following the high-volume failure of two weeks ago. Prices successfully retested the original breakout area on the daily chart and turned up again. Intermediate-term, BRKA still has overhead objectives in the 540K area, and holding the previous tops (breakout area) should lead to renewed rallies toward those objectives.
Timing Points
- 06/05 *** X important
- 06/16 **
- 06/21 **
- 06/30 *** fast moves
CNN Fear & Greed Index
AAII Investor Sentiment Survey
Dow Jones Industrial Average Hourly HLC
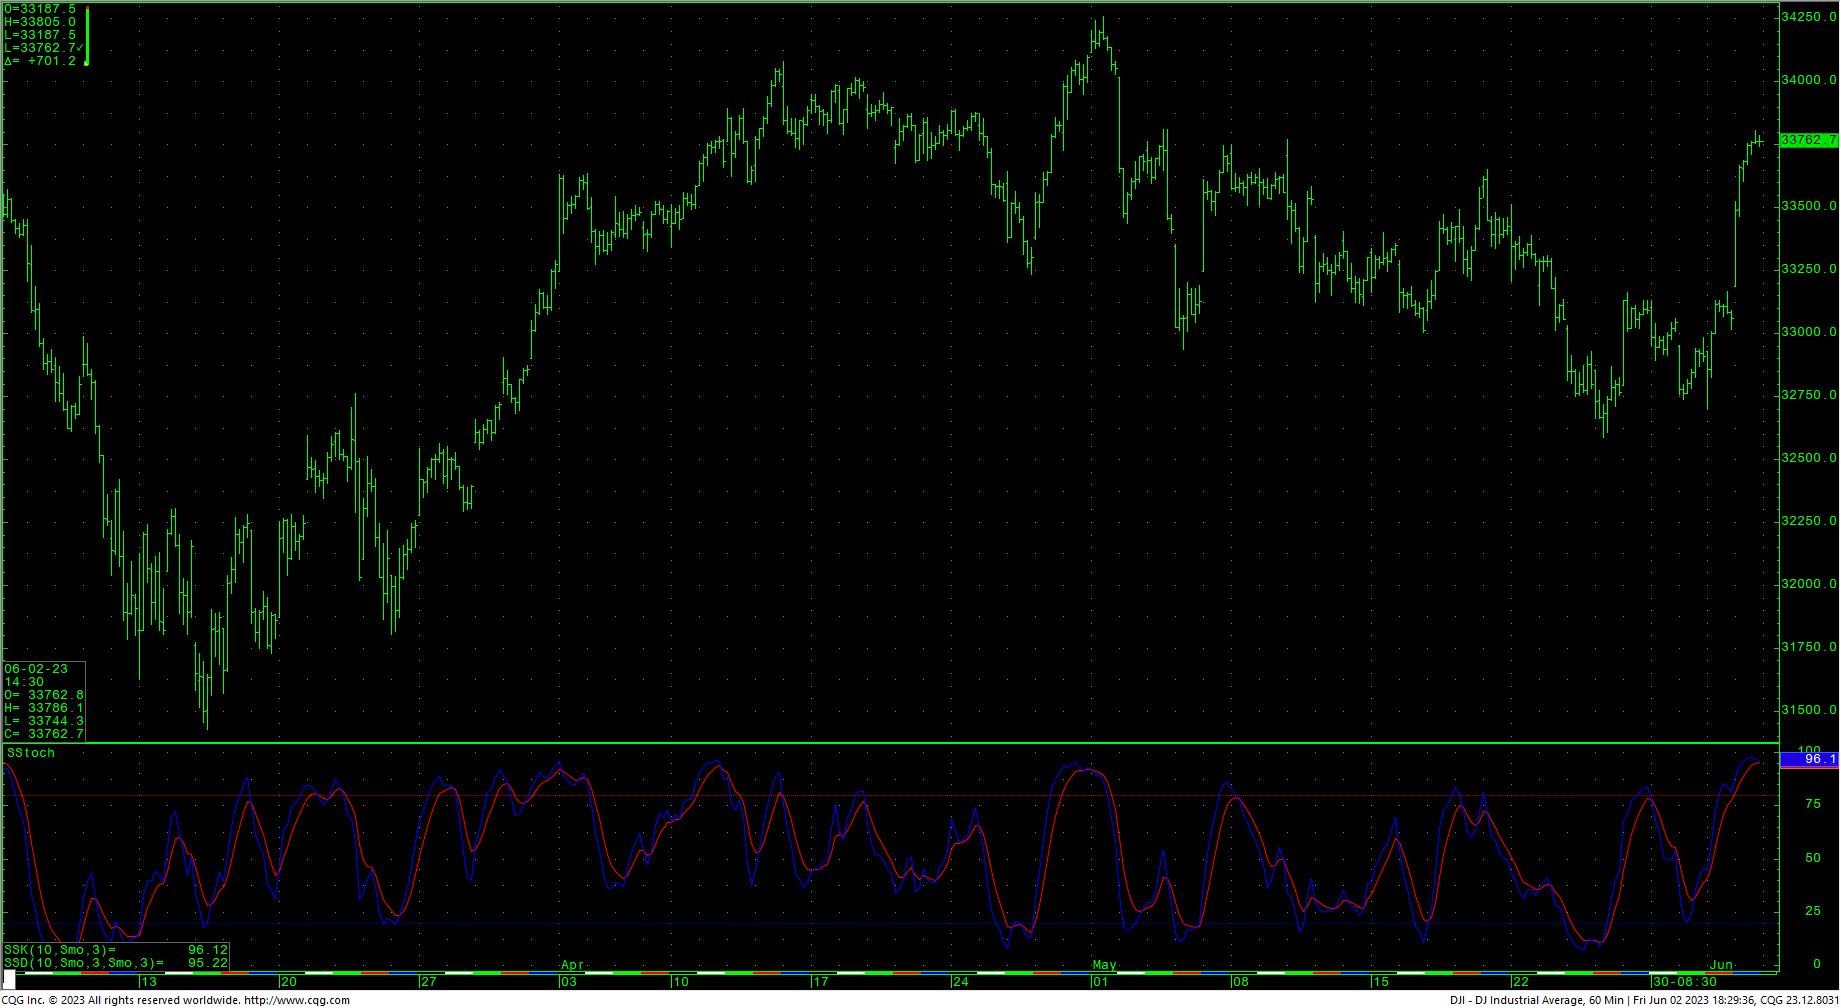
The Dow hourly is in an extremely overbought condition on Friday’s close. Prices are testing hourly swing highs against resistance of 33839/33863. A case can be built for the Dow to be in a sloping, inverted head & shoulders pattern. Rallies through 33863 are friendly and should test 33927/33946 with a shot at 34257. This area would represent the neckline of the H&S pattern and clearing it gives counts to 37095. Expect resistance to be strong at 34222/34257 and 34334/34342. Closes over 34342 are friendly. A drive over 34712 can test significant long-term resistance at 34879 and 34995 and offers full counts back critical resistance at 35492. Closes over 35492 will open counts to 35824. Closes over 35492 should minimally test a gap area on the daily at 35996 to 36044. The H&S pattern counts to 37095.
Dow Jones Industrial Average Weekly HLC
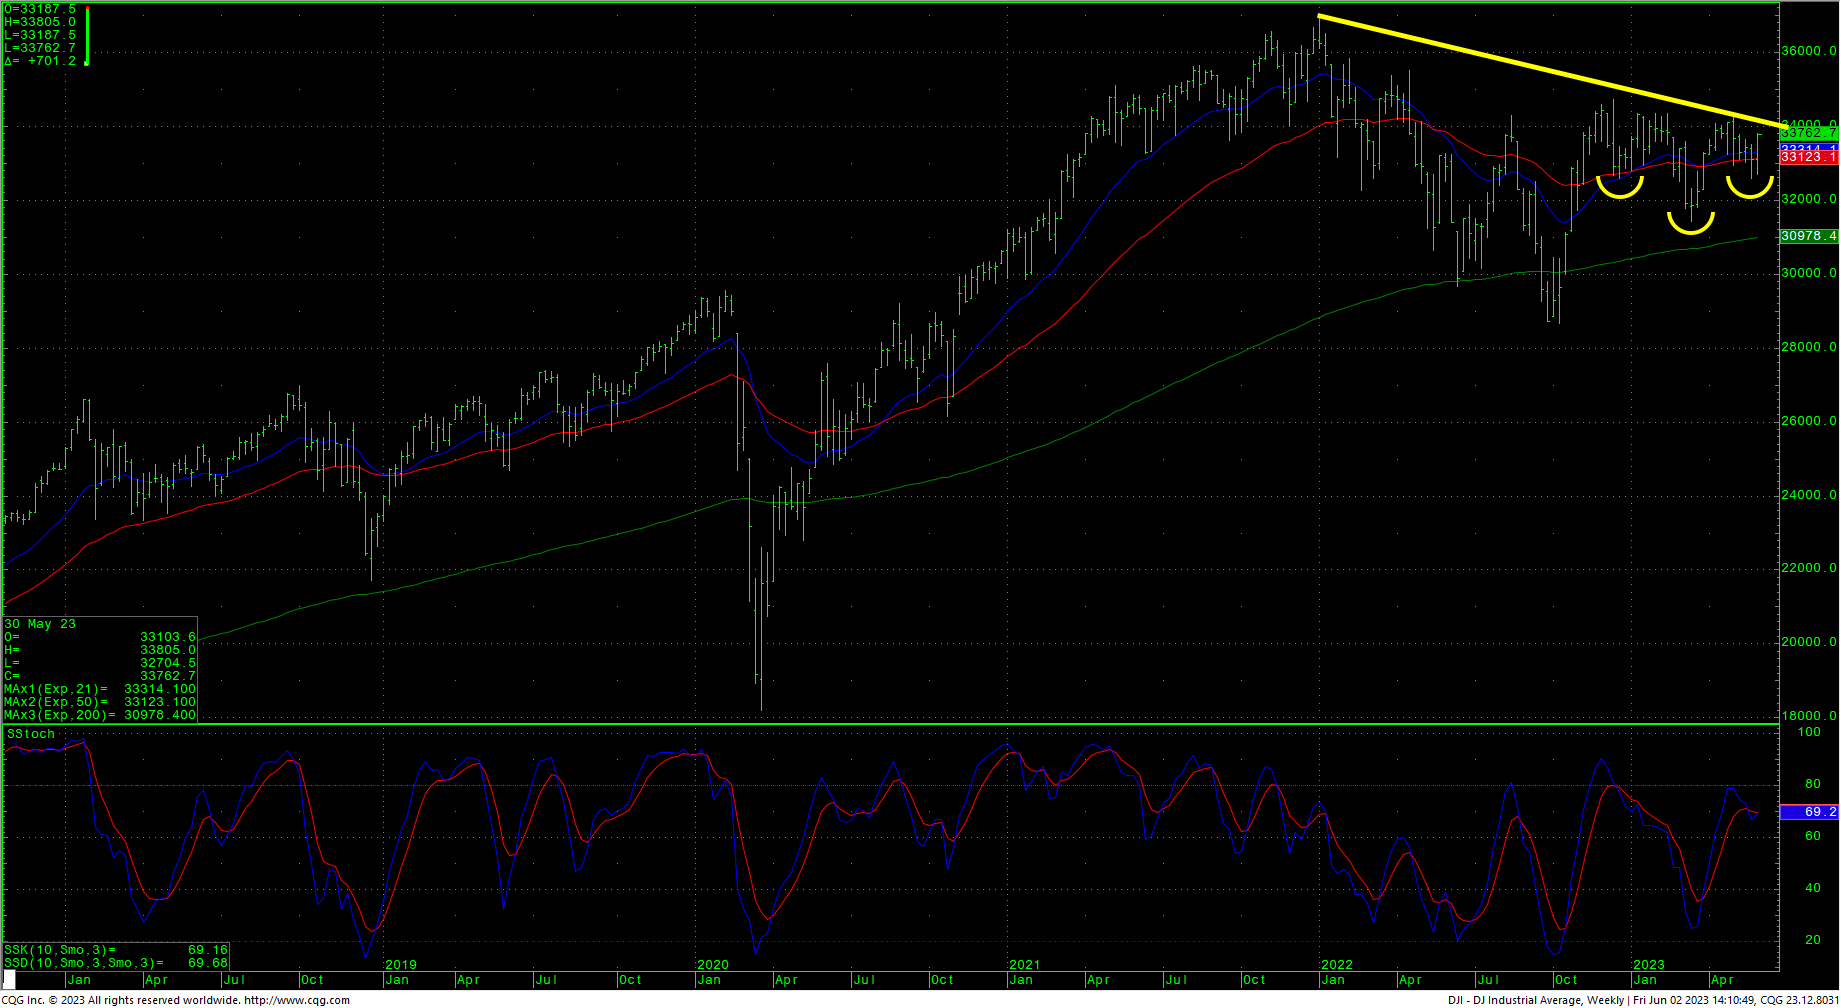
Support for the Dow is at 33517, 33339, 33195, and short-term pivotal at 33051/33040. A breakdown under 33050 sets up 32891 with counts to 32843 and 32795. A breakdown under 32795 sets up a test of critical support of 32510/32500. Closes under 32500 set up a move to intermediate support in the 31727/31686 level. A breakdown with closes under 31686 will open counts into the 30972/30960 level with support of 31429/31423 and 31160. There is a gap on the daily chart that runs from 31160 to 31119.
Resistance
- 33839/33863 *** ↑
- 33927/33946 *** ↑
- 34092 **
- 34130 **
- 34222/34257 *** ↑
- 34334/34342 *** ↑
- 34395 **
- 34495 **
- 34595 **
- 34712 *** ↑
- 34879 ***
- 34995 *** ↑
- 35112 **
- 35225 **
- 35372 ***
- 35492 *** ↑
- 35800/35824 *** ↑
Support
- 33650 **
- 33517 **
- 33339 ***
- 33195 *** ↓
- 33051/33040 *** ↓
- 32937 **
- 32843 *** ↓
- 32683 *** ↓
- 32510/32500 *** ↓
- 32396 **
- 32295 ** ↓
- 32136/32097 *** ↓
- 31950 **
- 31828/31805 *** ↓
- 31727 ***
- 31686 *** ↓
- 31624 ***
- 31530 **
- 31429/31423 *** ↓
S&P 500 Cash Index
The S&P hourly is also extremely overbought on Friday’s close. The market gapped higher Friday as it penetrates the upper end of the massive triangle is setting new highs for the year and trading into the highest levels since April of 2022. The daily stochastics have hooked up yet again and the action suggests a move to critical resistance of 4311/4315. Daily closes over 4315 open counts to 4385 with full potential to long-term critical resistance of 4486/4505. Closes over 4505 can carry to 4593 with full potential toward 4637. A breakout above 4637 opens potential toward 4748 and ultimately 4818.
S&P 500 Index Weekly HLC
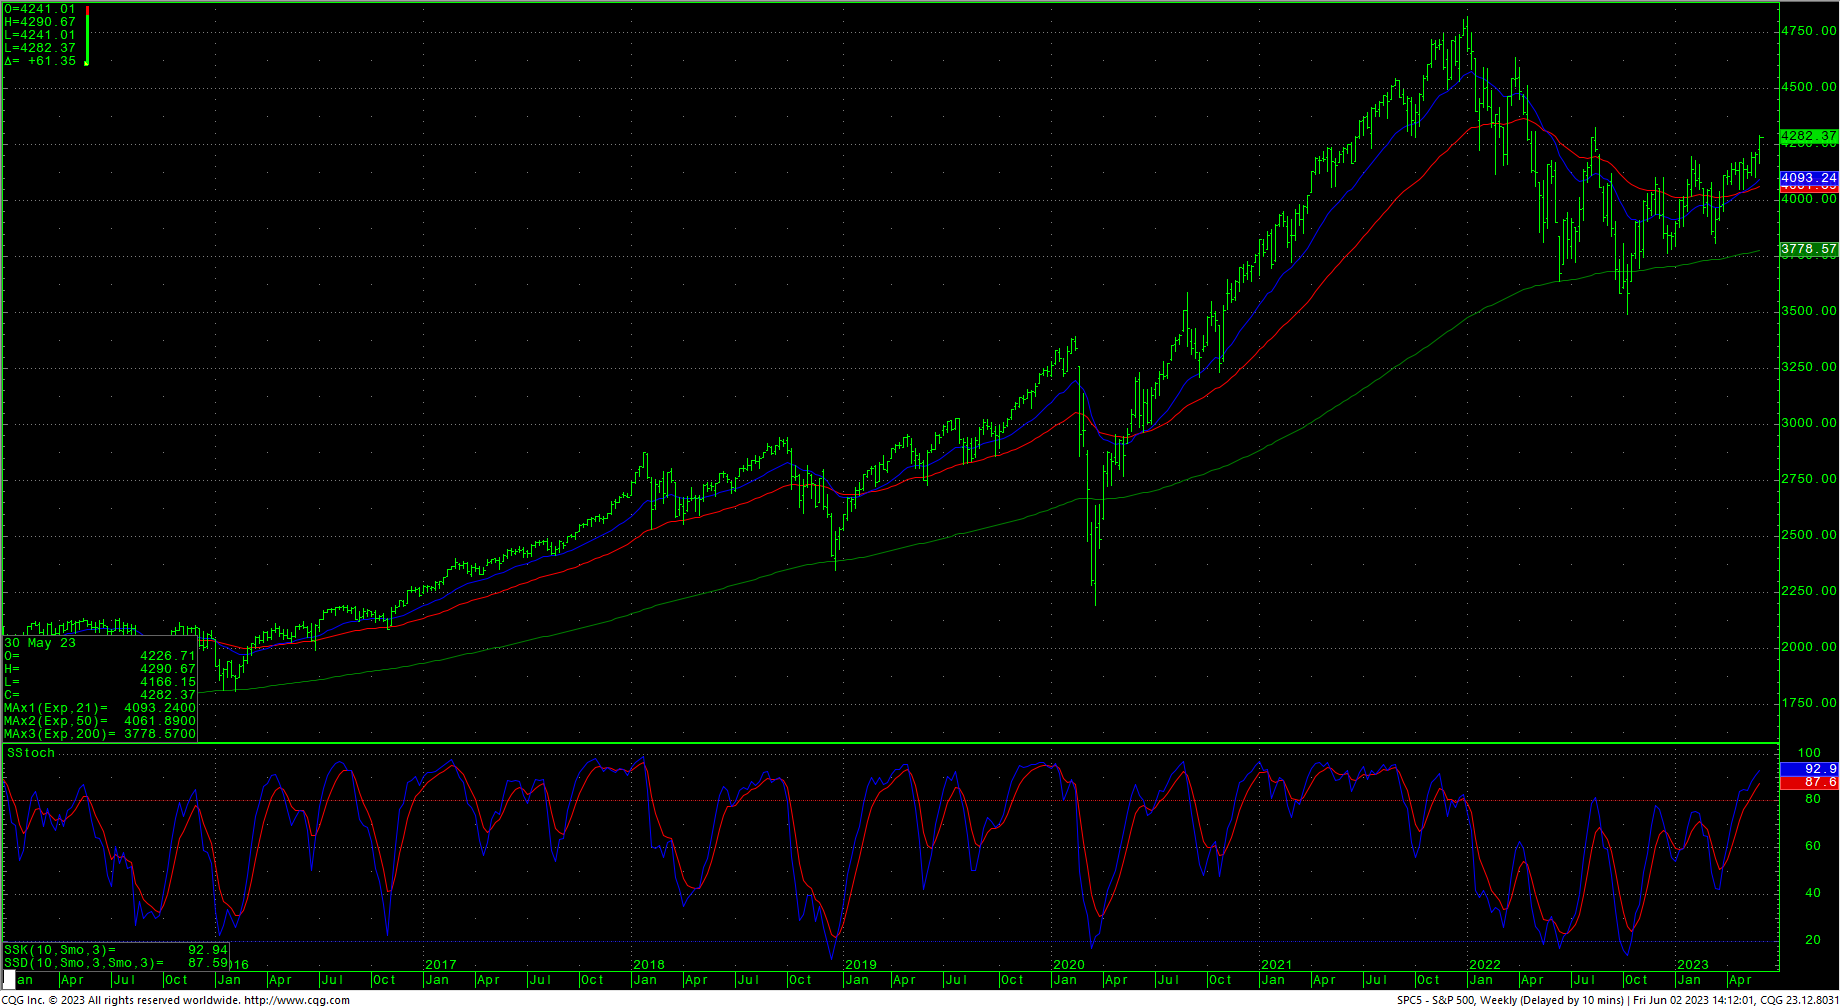
Support is 4233, 4198, 4169 and short-term pivotal at 4141/4137. Closes below 4137 open counts to 4103/4102. Under 4102 counts to 4048 with potential to pivotal support of 3985/3983. Closes under 3983 setup a test of 3891 with counts to critical support of 3796/3790. A breakdown with closes under 3790 opens counts to support against the 3691/3680 level. Under 3680 sets up a move to 3657 and full potential back to critical long-term support of 3505/3491.
Resistance
- 4290 **
- 4311/4315 *** ↑
- 4350 **
- 4385 *** ↑
- 4430 **
- 4486 *** ↑
- 4505 *** ↑
- 4593 **
- 4637 *** ↑
- 4665 **
- 4748 *** ↑
- 4818 *** ↑
Support
- 4245 **
- 4233 ***
- 4218 **
- 4198 ***
- 4169 *** ↓
- 4141/4137 *** ↓
- 4115 **
- 4103/4102 *** ↓
- 4050/4048 *** ↓
- 4015 **
- 3985/3983 *** ↓
- 3965 **
- 3958 ***
- 3891 *** ↓
- 3865 ***
- 3845 **
- 3796/3790 *** ↓
- 3750 ***
- 3691/3680 *** ↓


