
“Empowering Your Financial Success”
Daily Market Insights: October 3rd, 2023
Global Markets Summary:
Asian Markets:
- Shanghai Composite (China): +0.10%
- Nikkei 225 (Japan): -1.64%
- Hang Seng (Hong Kong): -2.69%
US Futures:
- S&P Futures: opened @ 4269.75 (-0.43%)
European Markets:
- London’s FTSE 100: -0.54%
- France’s CAC 40: -1.01%
- Germany’s DAX: -1.06%
US Market Snapshot:
Key Stock Market Indices:
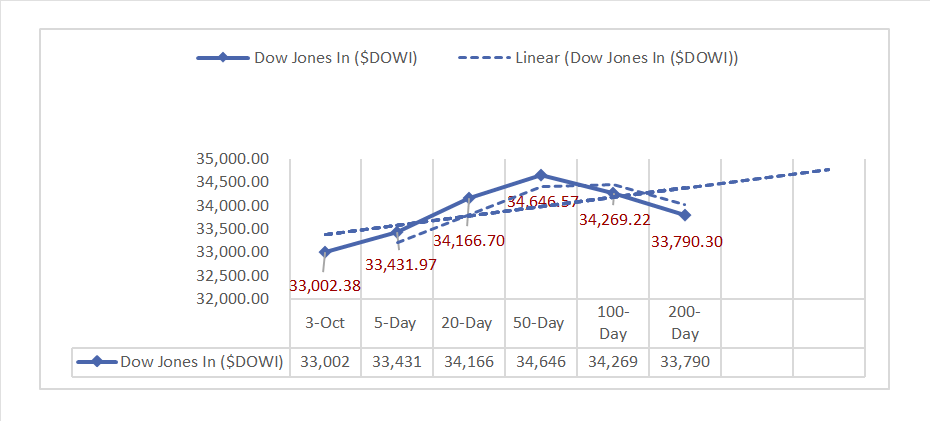
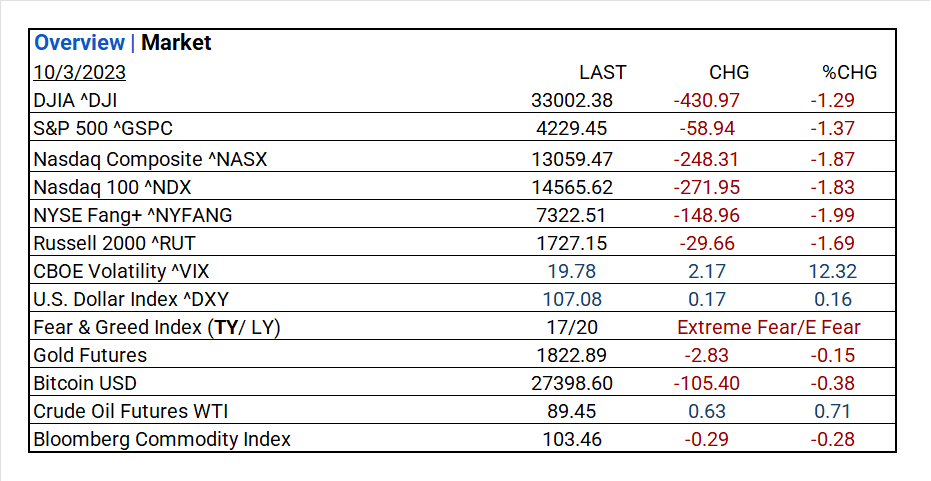
- DJIA ^DJI: 33,002.38 (-430.97, -1.29%)
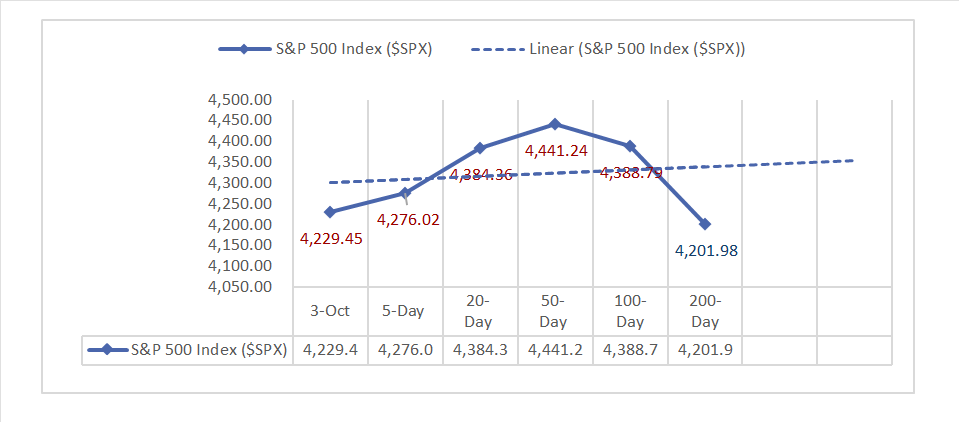
- S&P 500 ^GSPC: 4,229.45 (-58.94, -1.37%)
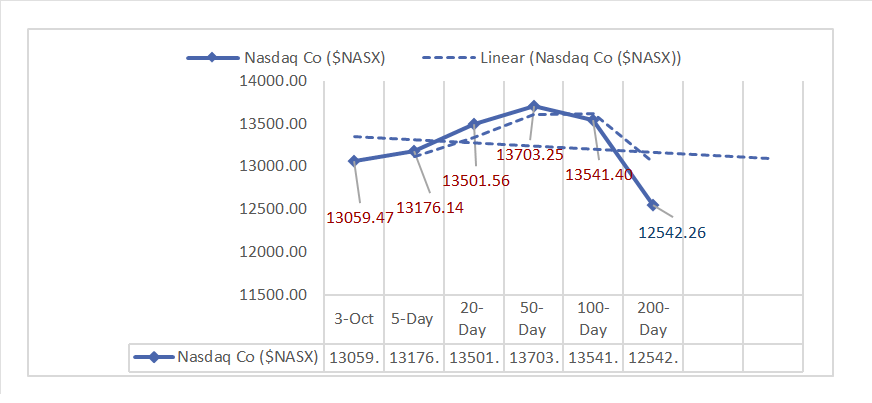
- Nasdaq Composite ^NASX: 13,059.47 (-248.31, -1.87%)
- Nasdaq 100 ^NDX: 14,565.62 (-271.95, -1.83%)
- NYSE Fang+ ^NYFANG: 7,322.51 (-148.96, -1.99%)
- Russell 2000 ^RUT: 1,727.15 (-29.66, -1.69%)
Market Insights: Performance, Sectors, and Trends:
- Economic Data: JOLTS data revealed a significant 690k increase, mainly in business and professional services, offsetting previous declines. Hiring, separations, and job openings to unemployed ratio remained largely stable.
- Market Indices: U.S. markets saw significant declines with DJIA down 1.29%, S&P 500 down 1.37%, and Nasdaq Composite down 1.87%. Russell 2000 and NYSE Fang+ dropped by 1.69% and 1.99% respectively.
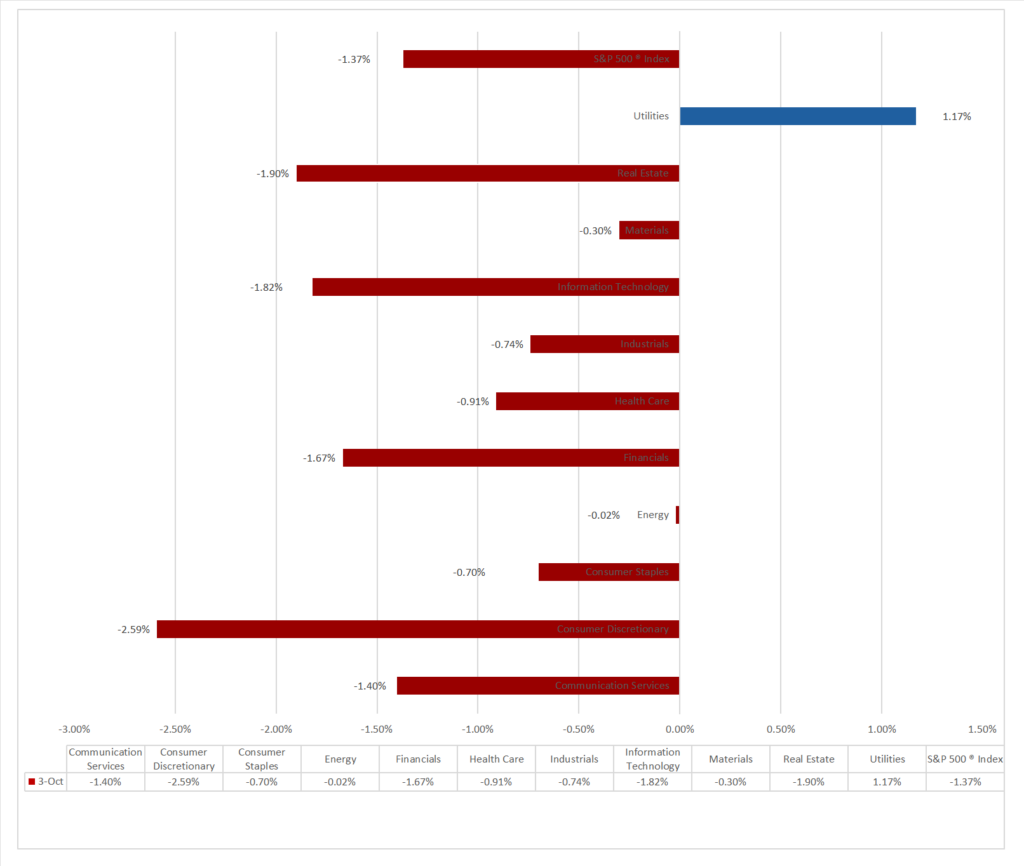
- Sector Performance: 10 of 11 sectors declined, Utilities outperformed (+1.17%), while Consumer Discretionary (-2.59%) lagged. Top Industry: Multi-Utilities (+1.69%),
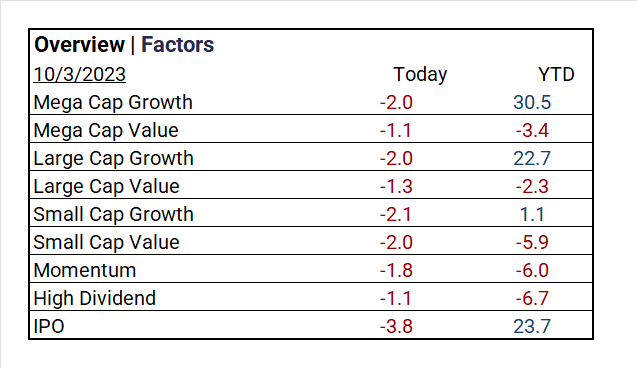
- Factors: Value tops Growth.
- Top ETF: ProShares Ultra VIX Short Term Futures ETF ^UVXY +13.96%
- Worst ETF: iShares China Large-Cap ETF ^FXI -2.35%
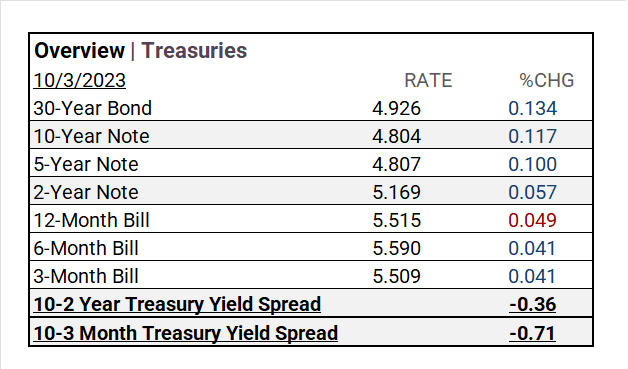
- Treasury Markets: The 30-Year Bond and 10-Year Note reaching 4.926% and 4.804%.
- Currency and Volatility: The U.S. Dollar Index rose, CBOE Volatility jumped +>12% and the Fear & Greed Index worsened indicating extreme fear.
- Commodity Markets: Gold Futures and Bitcoin declined, Crude Oil Futures WTI rose, and the Bloomberg Commodity Index fell.
Sectors:
- 10 of 11 sectors declined, Utilities outperformed (+1.17%), while Consumer Discretionary (-2.59%) lagged. Top Industry: Multi-Utilities (+1.69%), Gas Utilities (+1.53%), Electric Utilities (+1.18%) and Energy Equipment & Services (+0.77%).
Treasury Yields and Currency:
- In Treasury markets, U.S. Treasury yields had notable increases, with the 30-Year Bond and 10-Year Note reaching 4.926% and 4.804%. Shorter-term rates also rose, resulting in yield curve inversion, notably -0.36 for 10-2 Year and -0.71 for 10-3 Month spreads.
- The U.S. Dollar Index ^DXY: 107.08 (+0.17, +0.16%)
Market Volatility and Sentiment:
- CBOE Volatility ^VIX: 19.78 (+2.17, +12.32%)
- Fear & Greed Index (TY/LY): 17/20 (Fear/Extreme Fear)
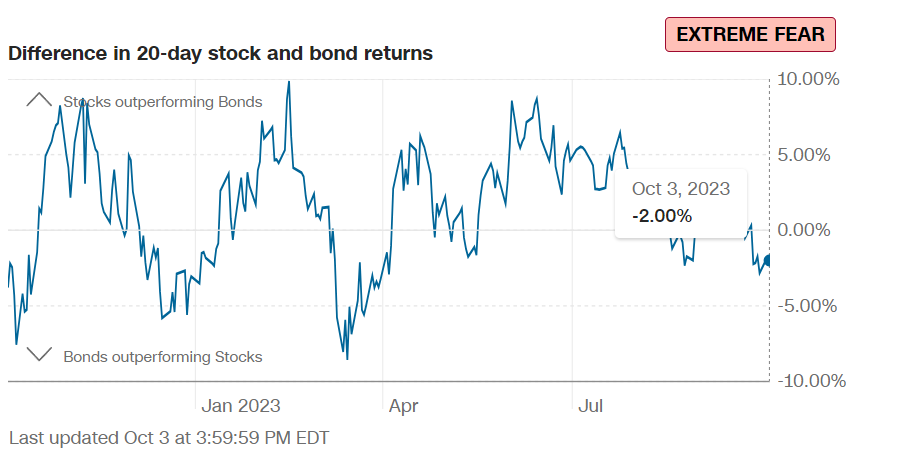
source: CNN Fear and Greed Index
Commodities:
- Gold Futures: 1822.89 (-2.83, -0.15%)
- Bitcoin USD: 27398.60 (-105.40, -0.38%)
- Crude Oil Futures WTI: 89.45 (+0.63, +0.71%)
- Bloomberg Commodity Index: 103.46 (-0.29, -0.28%)
Factors:
- Value tops Growth, Mega Cap Value and High Dividend at (-1.1%) outperformed.
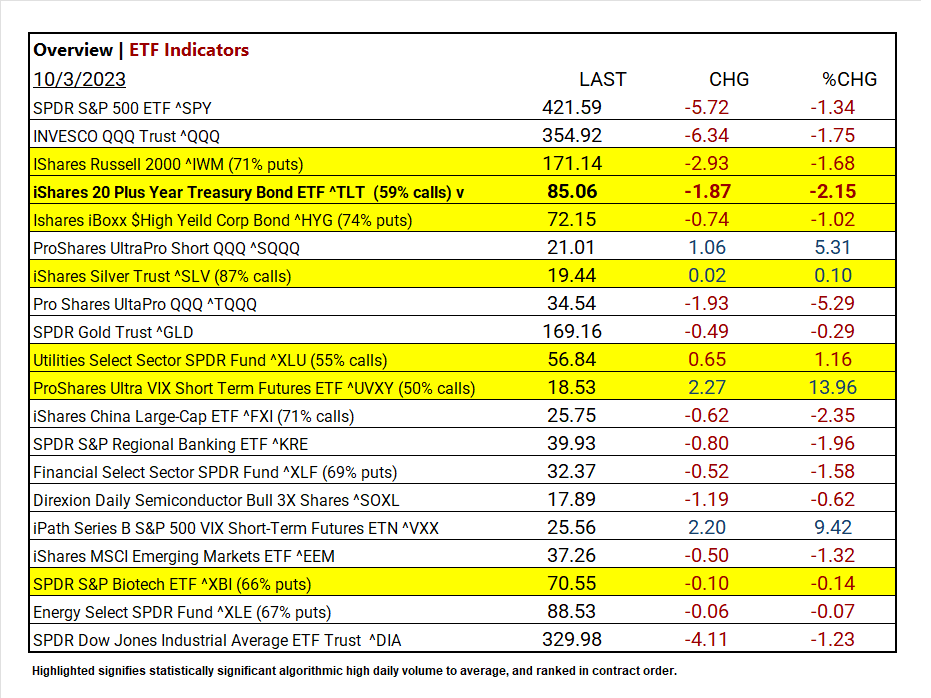
ETF Performance:
Top 3 Best Performers:
- ProShares Ultra VIX Short Term Futures ETF ^UVXY +13.96%
- iPath Series B S&P 500 VIX Short-Term Futures ETN ^VXX +9.42%
- ProShares UltraPro Short QQQ ^SQQQ +5.31%
Top 3 Worst Performers:
- iShares China Large-Cap ETF ^FXI -2.35%
- iShares 20 Plus Year Treasury Bond ETF ^TLT -2.15%
- SPDR S&P Regional Banking ETF ^KRE -1.96%
US Economic Data
August
- Job openings Aug.: 9.6 million (Consensus 8.8 million, Previous 8.9 million)
Earnings:
- Q1 ’23: 79% of companies beat analyst estimates.
- Q2 Forecast/Actual: Predicted <7.2%> FY 2023 S&P 500 EPS decline; FY 2023 EPS flat YoY. By 7-28, 51% reported Q2 2023, results; 80% beat EPS estimates, above 5-year (77%) and 10-year (73%) averages. Earnings exceeded estimates by 5.9%, slightly below the 5-year (8.4%) and 10-year (6.4%) averages.
- Q3 Forecast: S&P 500 to see -0.2% YoY earnings decline, marking 4th consecutive drop. S&P 500’s 12-month P/E ratio is 18.0, below 5-year (18.7%) average but above 10-year (17.5%) average. 74 S&P 500 firms gave negative EPS guidance, 42 exceeded expectations with positive guidance.
Notable Earnings Today:
- Beat:
- Miss: McCormick&Co (MKC), Cal-Maine (CALM)
Resources:
- What’s Expected in October (to be posted 10-4 )
- Vica Partners Economics Forecast
News
Investment and Growth News
- Automakers Notch Double-Digit Sales Gains for Third Quarter – WSJ
- Intel to Split Off Specialized Chip Business as CEO Pursues Turnaround – WSJ
Infrastructure and Energy
- Avangrid to Take $16 Million Charge to Cancel Offshore Wind Deal – Bloomberg
Real Estate Market Updates
- Hong Kong Banks Struggle to Sell Foreclosed Homes Even at 20% Discount – Bloomberg
Central Banking and Monetary Policy
- US Job Openings Top All Forecasts as White-Collar Positions Jump – Bloomberg
- The Fed Seeks to Up Its Influencer Status – WSJ
- Yellen Says Higher-for-Longer Scenario Is ‘By No Means a Given’ – Bloomberg
International Market Analysis (China)
- China flexes green thumb as it pursues agricultural self-reliance – SCMP

