
“Empowering Your Financial Success”
Daily Market Insights: October 17th, 2023
Global Markets Summary:
Asian Markets:
- Hang Seng (Hong Kong): -0.14%
- Nikkei 225 (Japan): -0.21%
- Shanghai Composite (China): Closed.
US Futures:
- S&P Futures: opened @ 4345.23 (-0.65%)
European Markets:
- FTSE 100 (London): +0.41%
- DAX (Germany): +0.09%
- CAC 40 (France): -1.42%
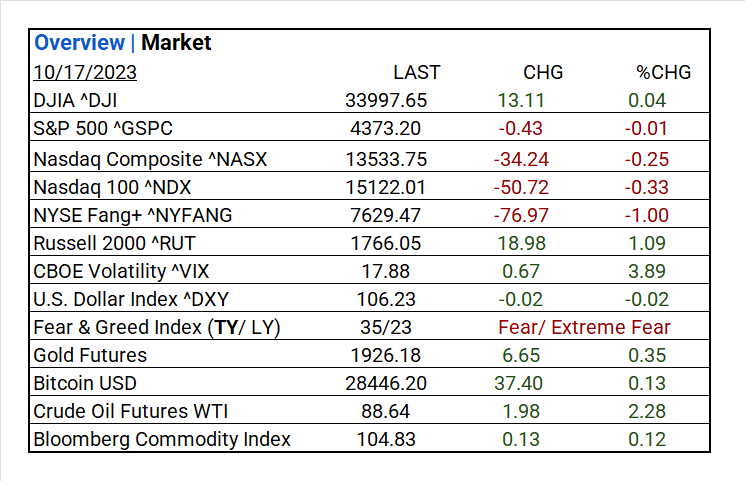
US Market Snapshot:
Key Stock Market Indices:
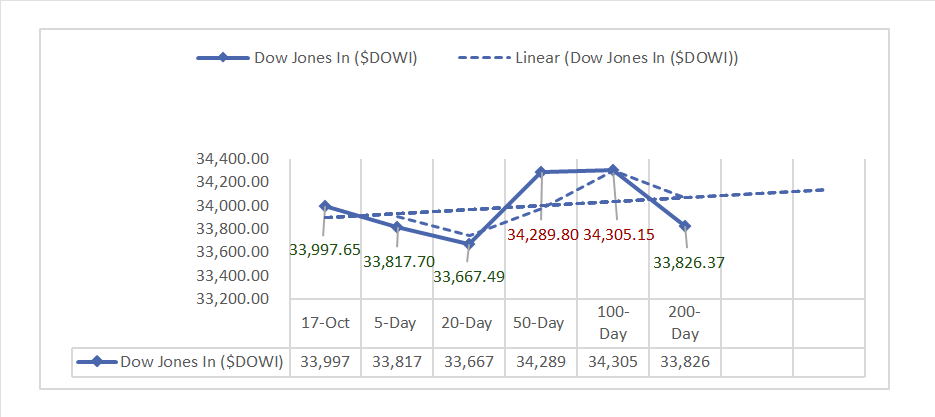
- DJIA ^DJI: 33,997.65 (+13.11, +0.04%)
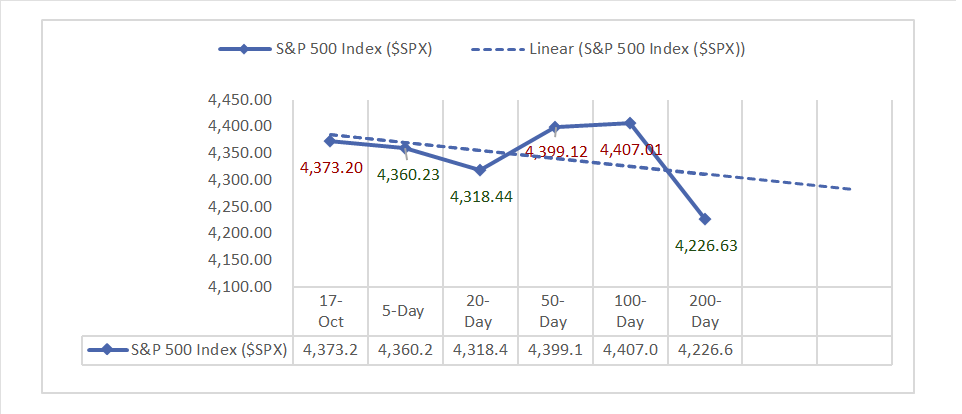
- S&P 500 ^GSPC: 4,373.20 (-0.43, -0.01%)
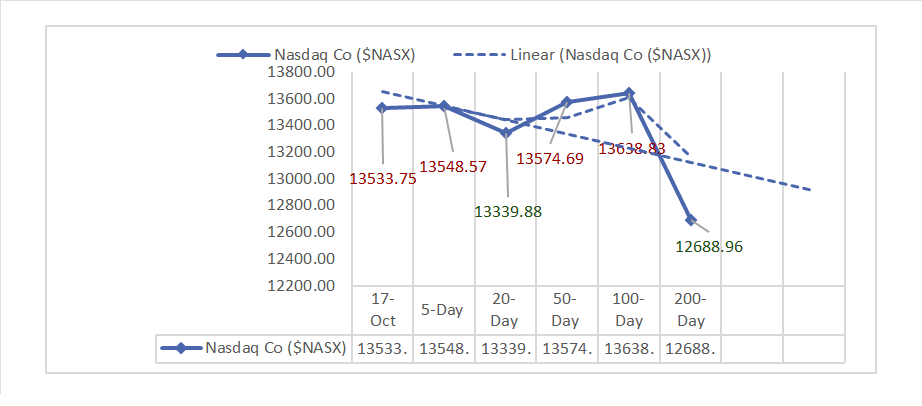
- Nasdaq Composite ^NASX: 13,533.75 (-34.24, -0.25%)
- Nasdaq 100 ^NDX: 15,122.01 (-50.72, -0.33%)
- NYSE Fang+ ^NYFANG: 7,629.47 (-76.97, -1.00%)
- Russell 2000 ^RUT: 1,766.05 (+18.98, +1.09%)
Market Insights: Performance, Sectors, and Trends:
- Economic Data: September retail sales grew by 0.7% (MoM) and 3.8% (YoY). Industrial production exceeded expectations. NAHB Housing Index declined to 40, business inventories rose by 0.4%.
- Market Indices: Major U.S. indices displayed mixed performance: DJIA gained 0.04%, S&P 500 fell by 0.01%, Nasdaq Composite declined 0.25%, Nasdaq 100 dropped 0.33%.
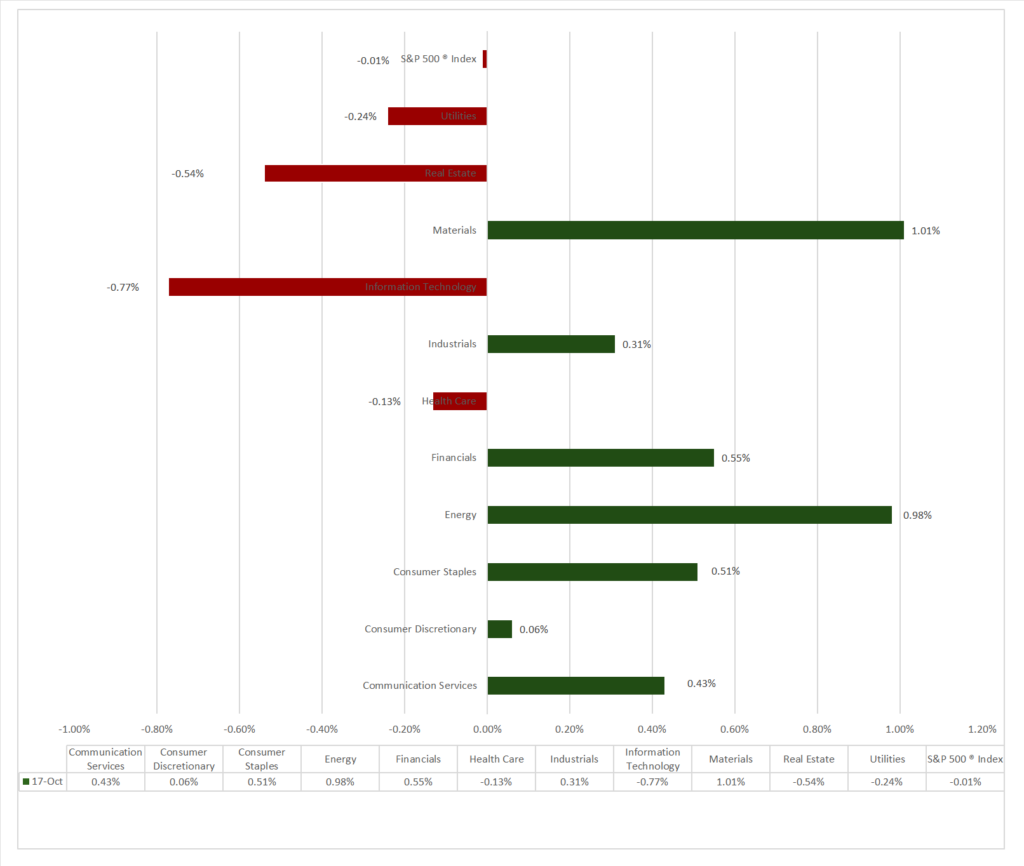
- Sector Performance: 7 of 11 Sectors gained, Materials (+1.01%) outperformed, while Information Technology (-0.77%) lagged. Top Industry: Leisure Products (+2.80%).
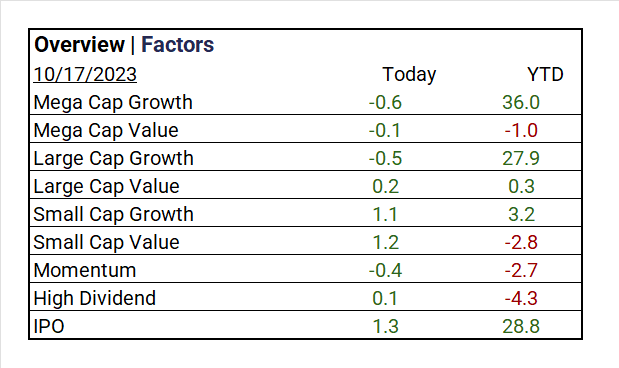
- Factors: Small Caps rally, IPO’s (+1.3%) outperform all.
- Top ETF: iShares Silver Trust ^SLV +4.11%
- Worst ETF: Direxion Daily Semiconductor Bull 3X Shares ^SOXL -2.57%
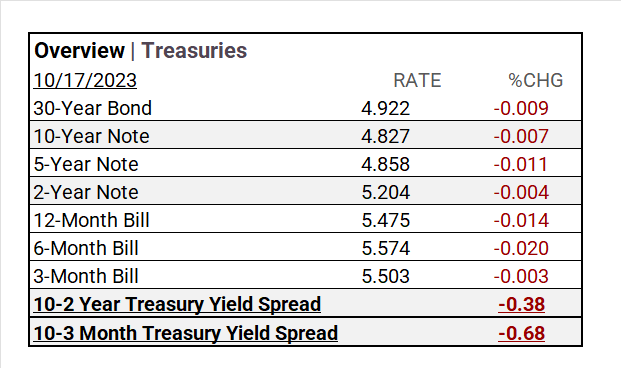
- Treasury Markets: Yield changes varied. The 30-Year Bond at 4.922% (-0.009), the 10-Year Note at 4.827% (-0.007), and the 2-Year Note at 5.204% (-0.004). Yield spreads: -0.38 and -0.68.
- Currency and Volatility: The U.S. Dollar Index down, CBOE Volatility rises +3.89%, and the Fear & Greed reading: Fear.
- Commodity Markets: Gold and Bitcoin prices up, Oil and the Bloomberg Commodity Index rise.
Sectors:
- 7 of 11 Sectors gained, Materials (+1.01%) outperformed, while Information Technology (-0.77%) lagged. Top Industry: Leisure Products (+2.80%), Construction & Engineering (+1.71%), Textiles, Apparel & Luxury Goods (+1.61%).
Treasury Yields and Currency:
- Yield changes varied. The 30-Year Bond at 4.922% (-0.009), the 10-Year Note at 4.827% (-0.007), and the 2-Year Note at 5.204% (-0.004). Yield spreads: -0.38 and -0.68.
- The U.S. Dollar Index ^DXY: 106.23 (-0.02, -0.02%)
Market Volatility and Sentiment:
- CBOE Volatility ^VIX: 17.88(+0.67, +3.89%)
- Fear & Greed Index (TY/LY): 35/23 (Fear/ Extreme Fear). Waiting on 10-17 update.
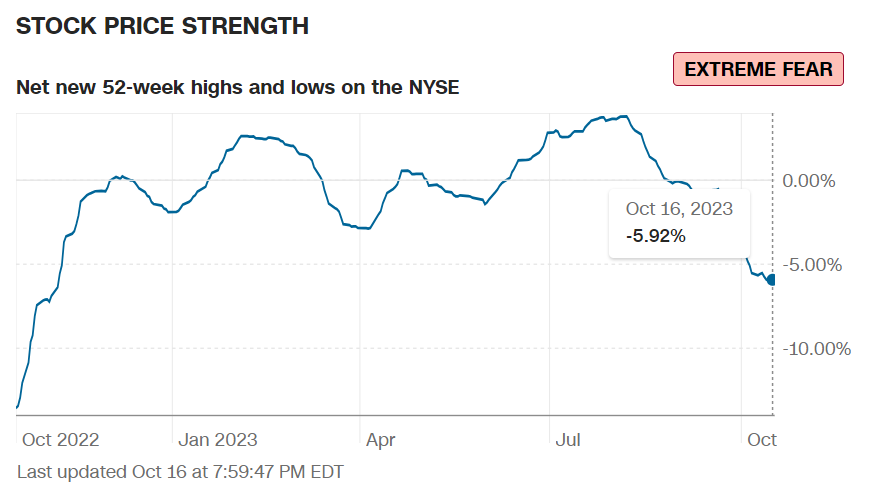
Source: CNN Fear and Greed Index
Commodities:
- Gold Futures: 1,926.18 (+6.65, +0.35%)
- Bitcoin USD: 28,446.20 (+37.40, +0.13%)
- Crude Oil Futures WTI: 88.64 (+1.98, +2.28%)
- Bloomberg Commodity Index: 104.83 (+0.13, +0.12%)
Factors:
- Small Caps for 2nd consecutive day rally , IPO’s (+1.3%) outperform all.
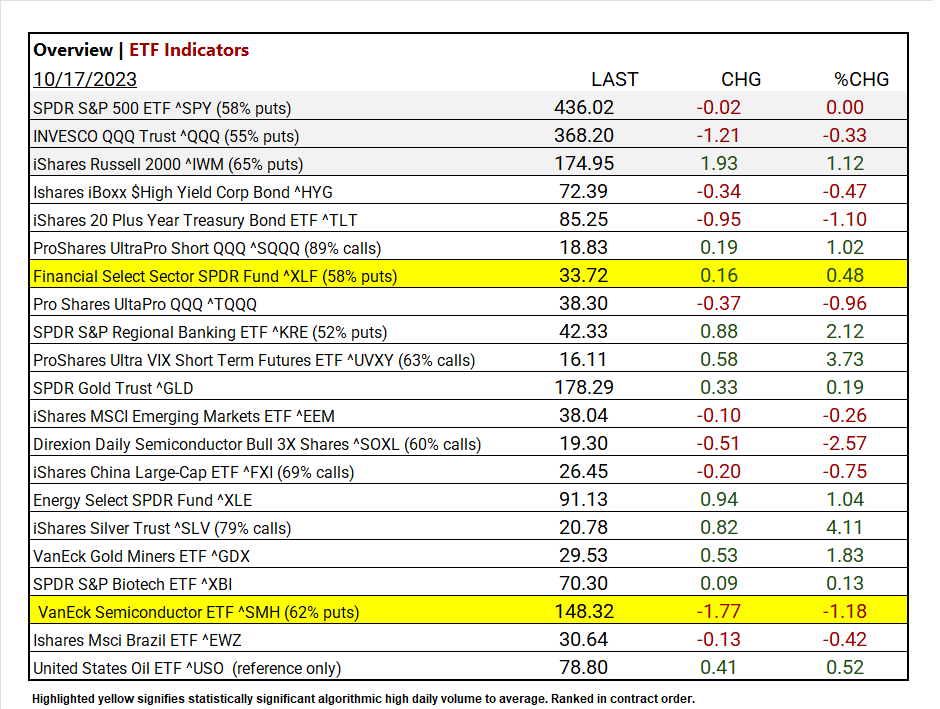
ETF Performance:
Top 3 Best Performers:
- iShares Silver Trust ^SLV +4.11%
- ProShares Ultra VIX Short Term Futures ETF ^UVXY +3.73%
- SPDR S&P Regional Banking ETF ^KRE +2.12%
Top 3 Worst Performers:
- Direxion Daily Semiconductor Bull 3X Shares ^SOXL -2.57%
- VanEck Semiconductor ETF ^SMH -1.18%
- iShares 20 Plus Year Treasury Bond ETF ^TLT -1.10
US Major Economic Data
- Retail Sales: MoM/YoY for September: 0.7%/3.8%, previously 0.8%/2.9%.
- Industrial/Mfg. Production: MoM for September: 0.3%/0.4% (vs. 0%/0.1% consensus), previously 0.0%/-0.1%.
- NAHB Housing Market Index: 40 (vs. 44 consensus), previously 45.
- Business Inventories: 0.4% (vs. 0.3% consensus), previously 0.1%.
Earnings:
- Q1 ’23: 79% of companies beat analyst estimates.
- Q2 Forecast/Actual: Predicted <7.2%> FY 2023 S&P 500 EPS decline; FY 2023 EPS flat YoY. By 7-28, 51% reported Q2 2023, results; 80% beat EPS estimates, above 5-year (77%) and 10-year (73%) averages. Earnings exceeded estimates by 5.9%, slightly below the 5-year (8.4%) and 10-year (6.4%) averages.
- Q3 Forecast: 116 companies in the index have issued EPS guidance for Q3 2023, Of these 116 companies, 74 have issued negative EPS guidance and 42 have issued positive EPS guidance. The percentage of S&P 500 companies issuing negative EPS guidance for Q3 2023 is 64% (74 out of 116), which is above the 5-year average of 59% but equal to the 10-year average of 64%. Eight of the eleven sectors are expected to see year-over-year earnings growth, with Communication Services and Consumer Discretionary leading the way. Conversely, three sectors, mainly Energy and Materials, are expected to experience earnings declines.
Notable Earnings Today:
- Beat: J&J (JNJ), Bank of America (BAC), TotalEnergies SE ADR (TTE), Lockheed Martin (LMT), Prologis (PLD), Interactive Brokers (IBKR), Bank of NY Mellon (BK), Bank of NY Mellon (BK), Omnicom (OMC), United Airlines Holdings (UAL), Albertsons (ACI), Wintrust (WTFC), Hancock Whitney (HWC), Fulton (FULT).
- Miss: Goldman Sachs (GS), LM Ericsson B ADR (ERIC), Pinnacle (PNFP),WaFd Inc (WAFD).
Resources:
- What’s Expected in October
- Vica Partners Economics Forecast
News
Investment and Growth News
- Prologis Says Industrial-Property Demand Remains Resilient – WSJ
- U.S. Tightens Curbs on AI Chip Exports to China, Widening Rift With Nvidia and Intel – WSJ
- Visa, Mastercard Drop as Fed Eyes Changes to Debit-Card Fee Cap – Bloomberg
- Alibaba.com seeks to woo merchants from TikTok after ByteDance ends social commerce activity in Indonesia – SCMP
Infrastructure and Energy
- The US Needs to Refill its Dangerously Low Oil Reserves –Bloomberg
- China’s Lithium-Triangle Inroads Show US Challenges in EV Race – Bloomberg
Real Estate
- Home Sales on Track for Slowest Year Since Housing Bust – WSJ
Central Banking and Monetary Policy
- The American Consumer Keeps Splurging – WSJ
- China’s Growth Beats Forecasts as Consumer Spending Improves –Bloomberg
International Market Analysis (China)
- China GDP: economic recovery regains momentum in third quarter, edges closer to annual target – SCMP


