
TECHNICAL ANALYSIS
Major Indices Week of October 20, 2023
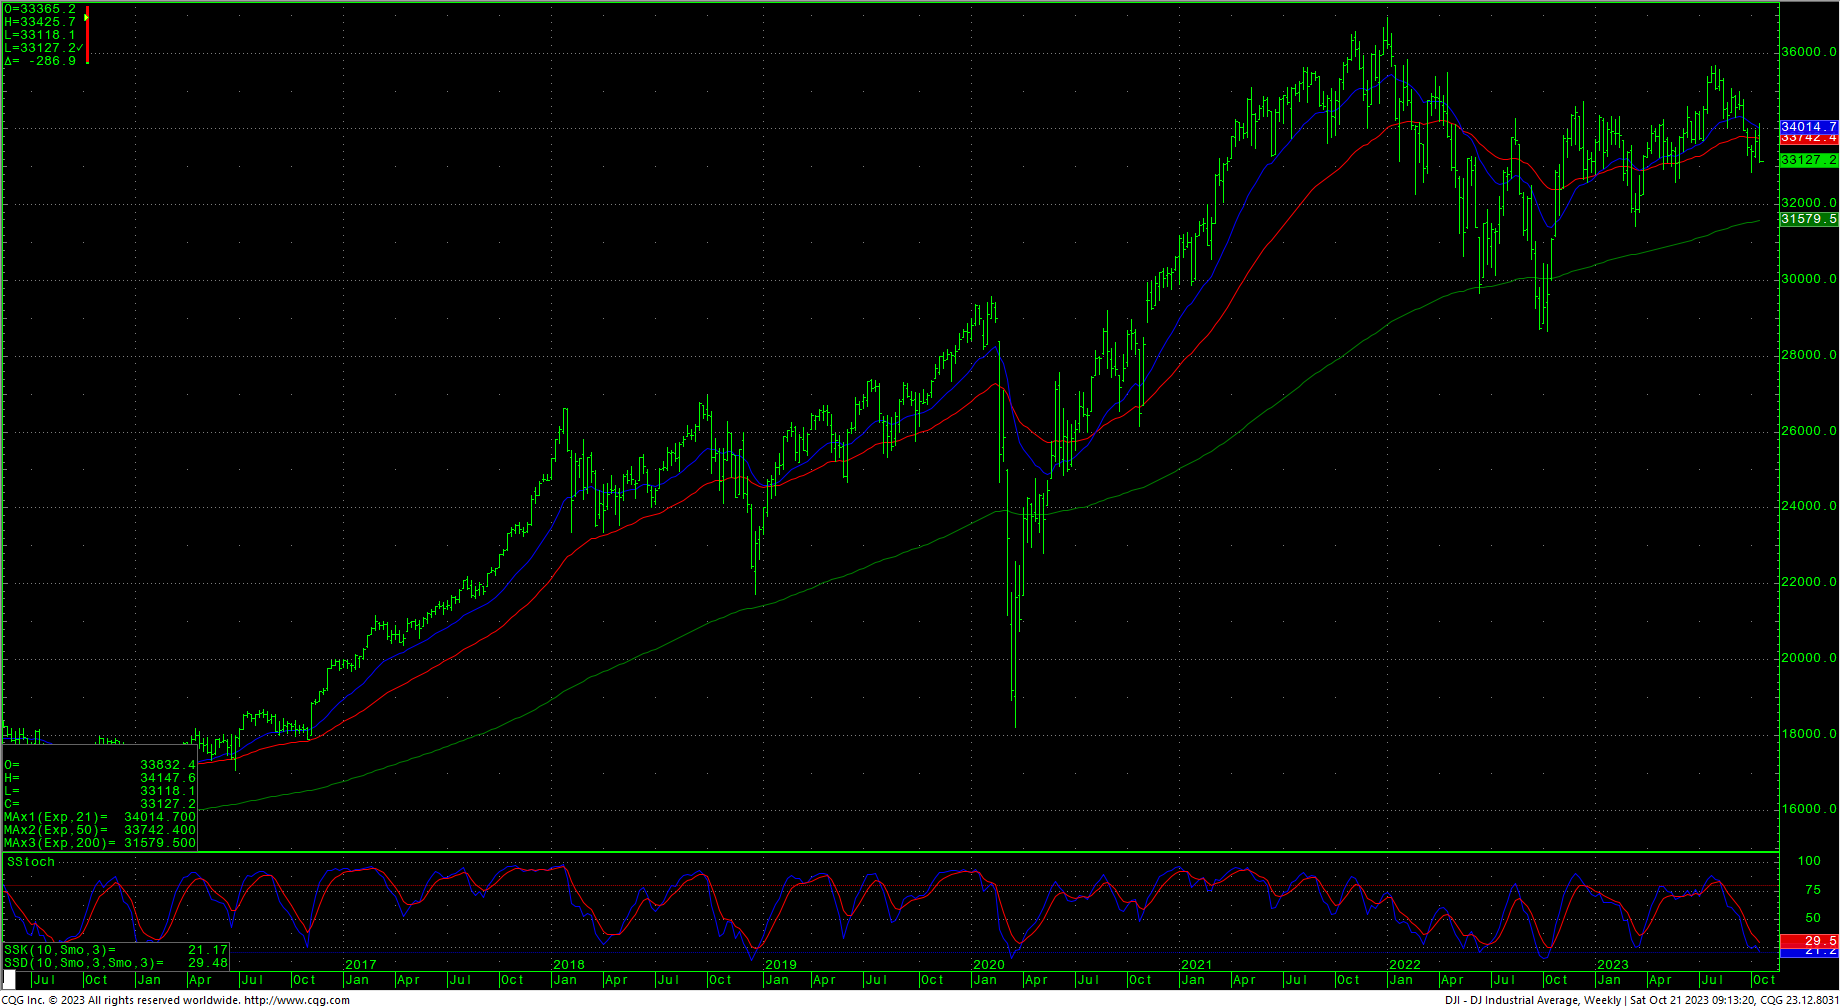
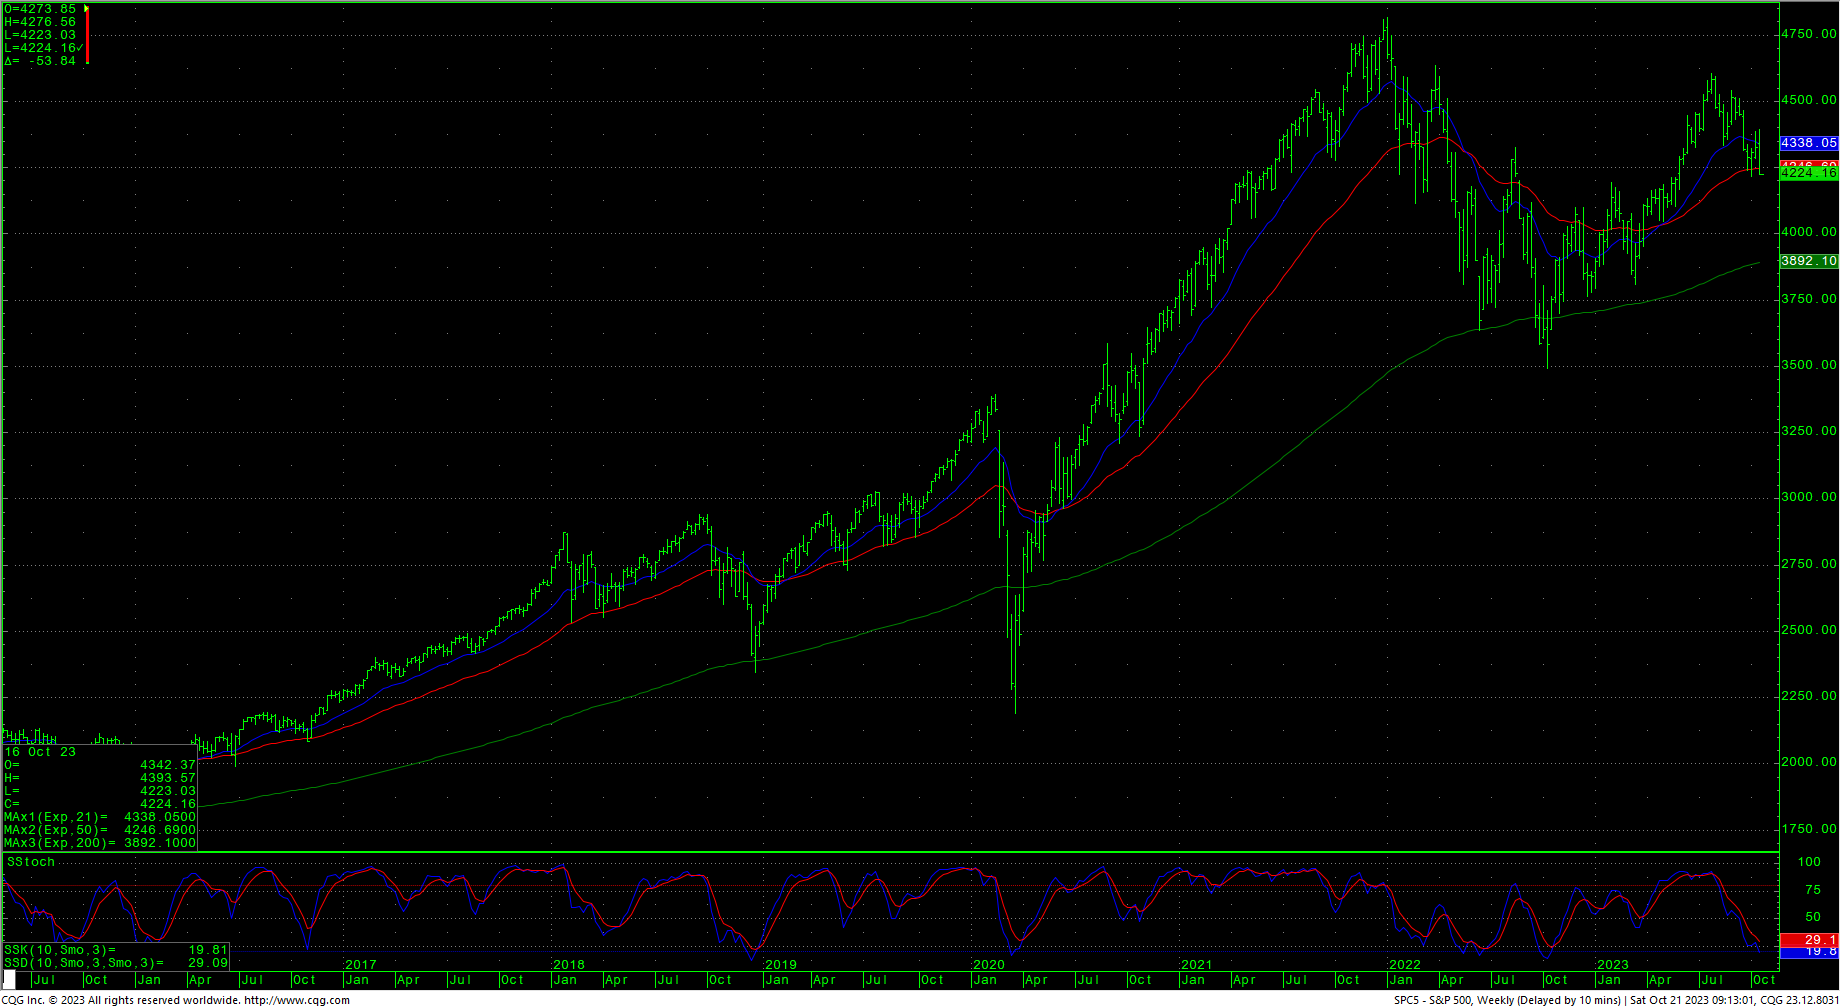
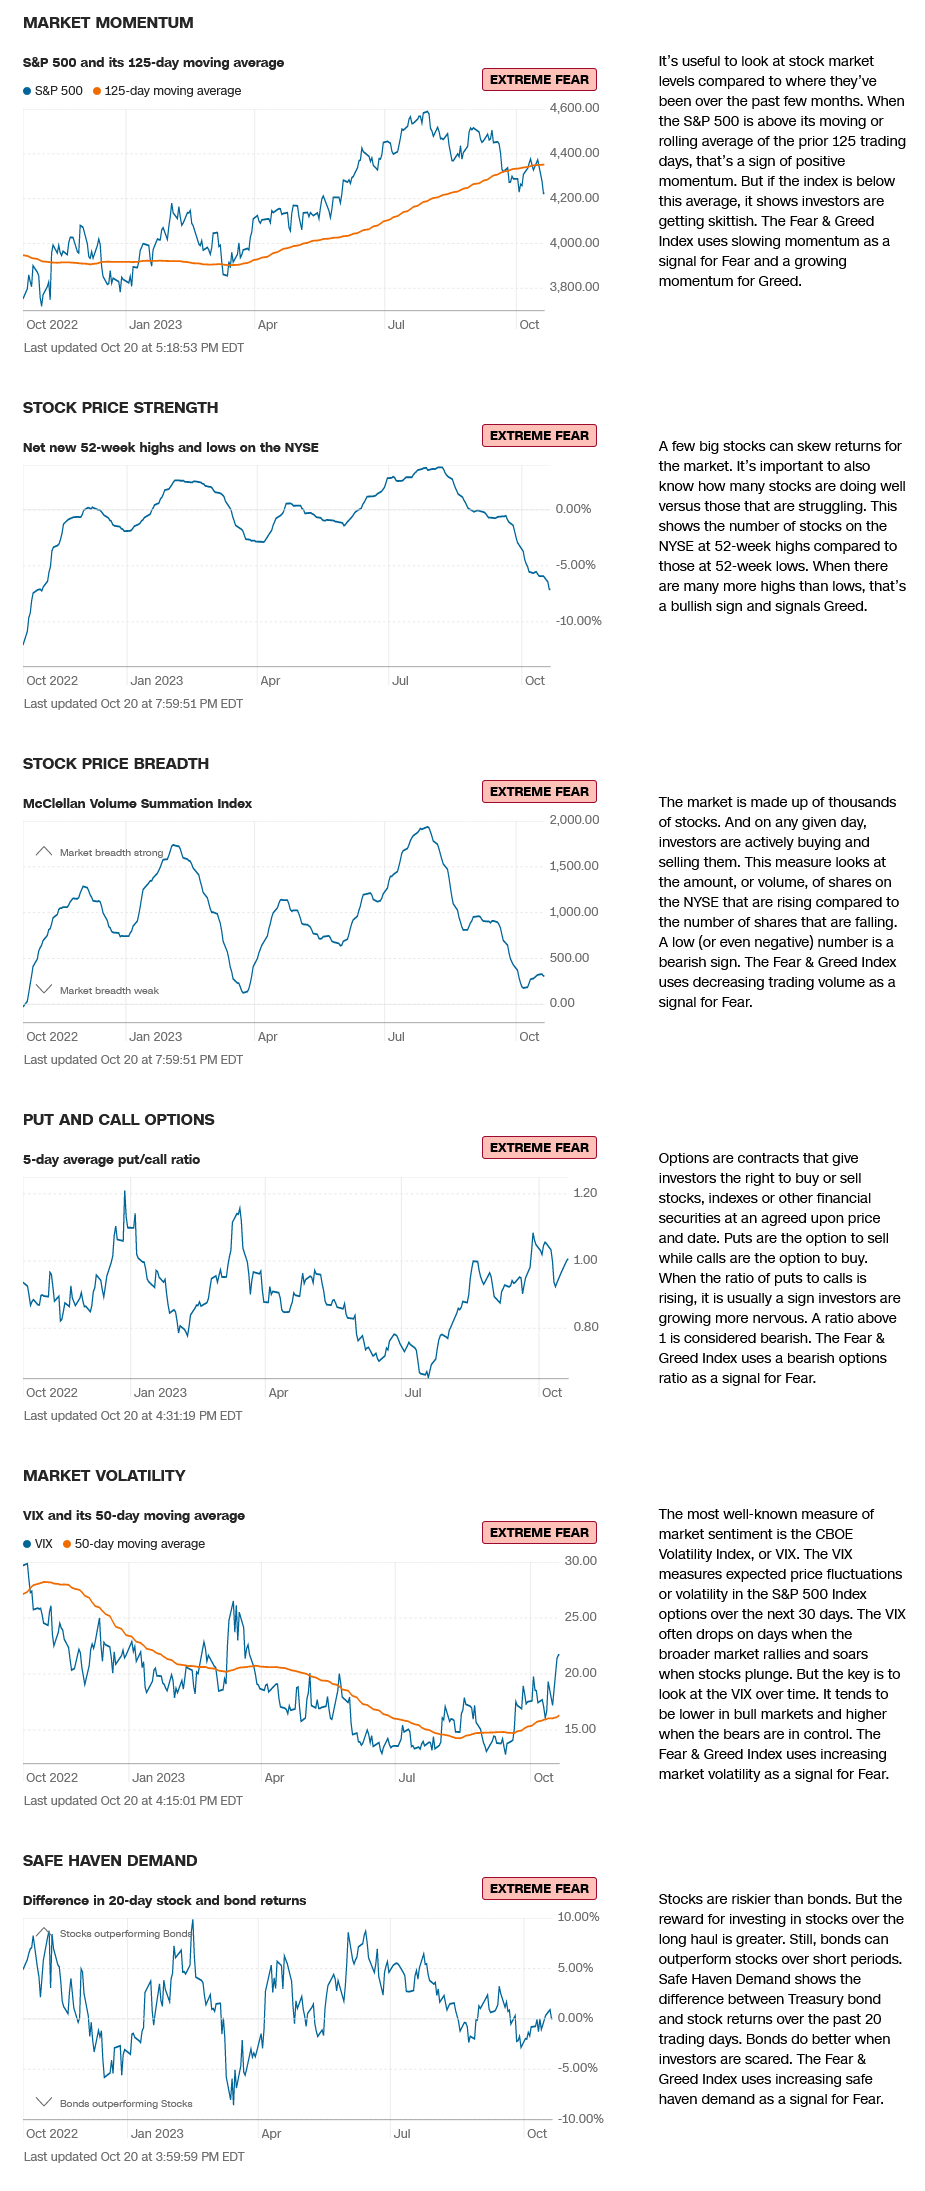
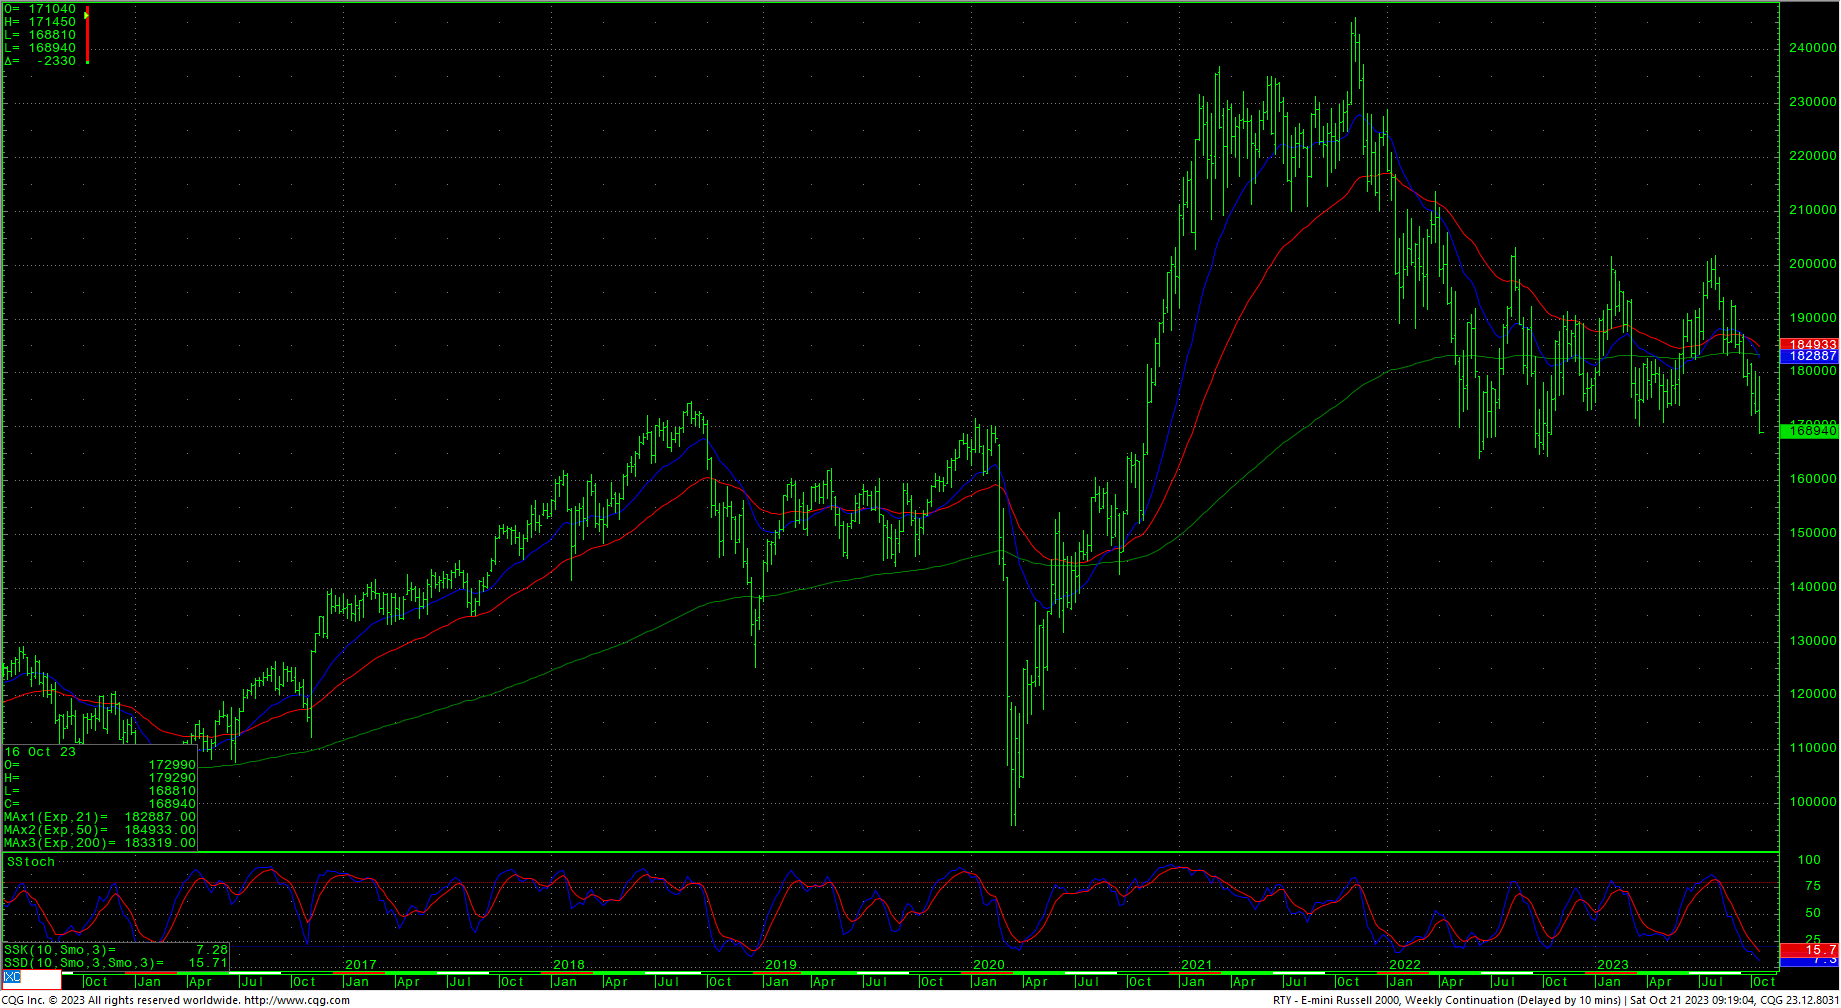
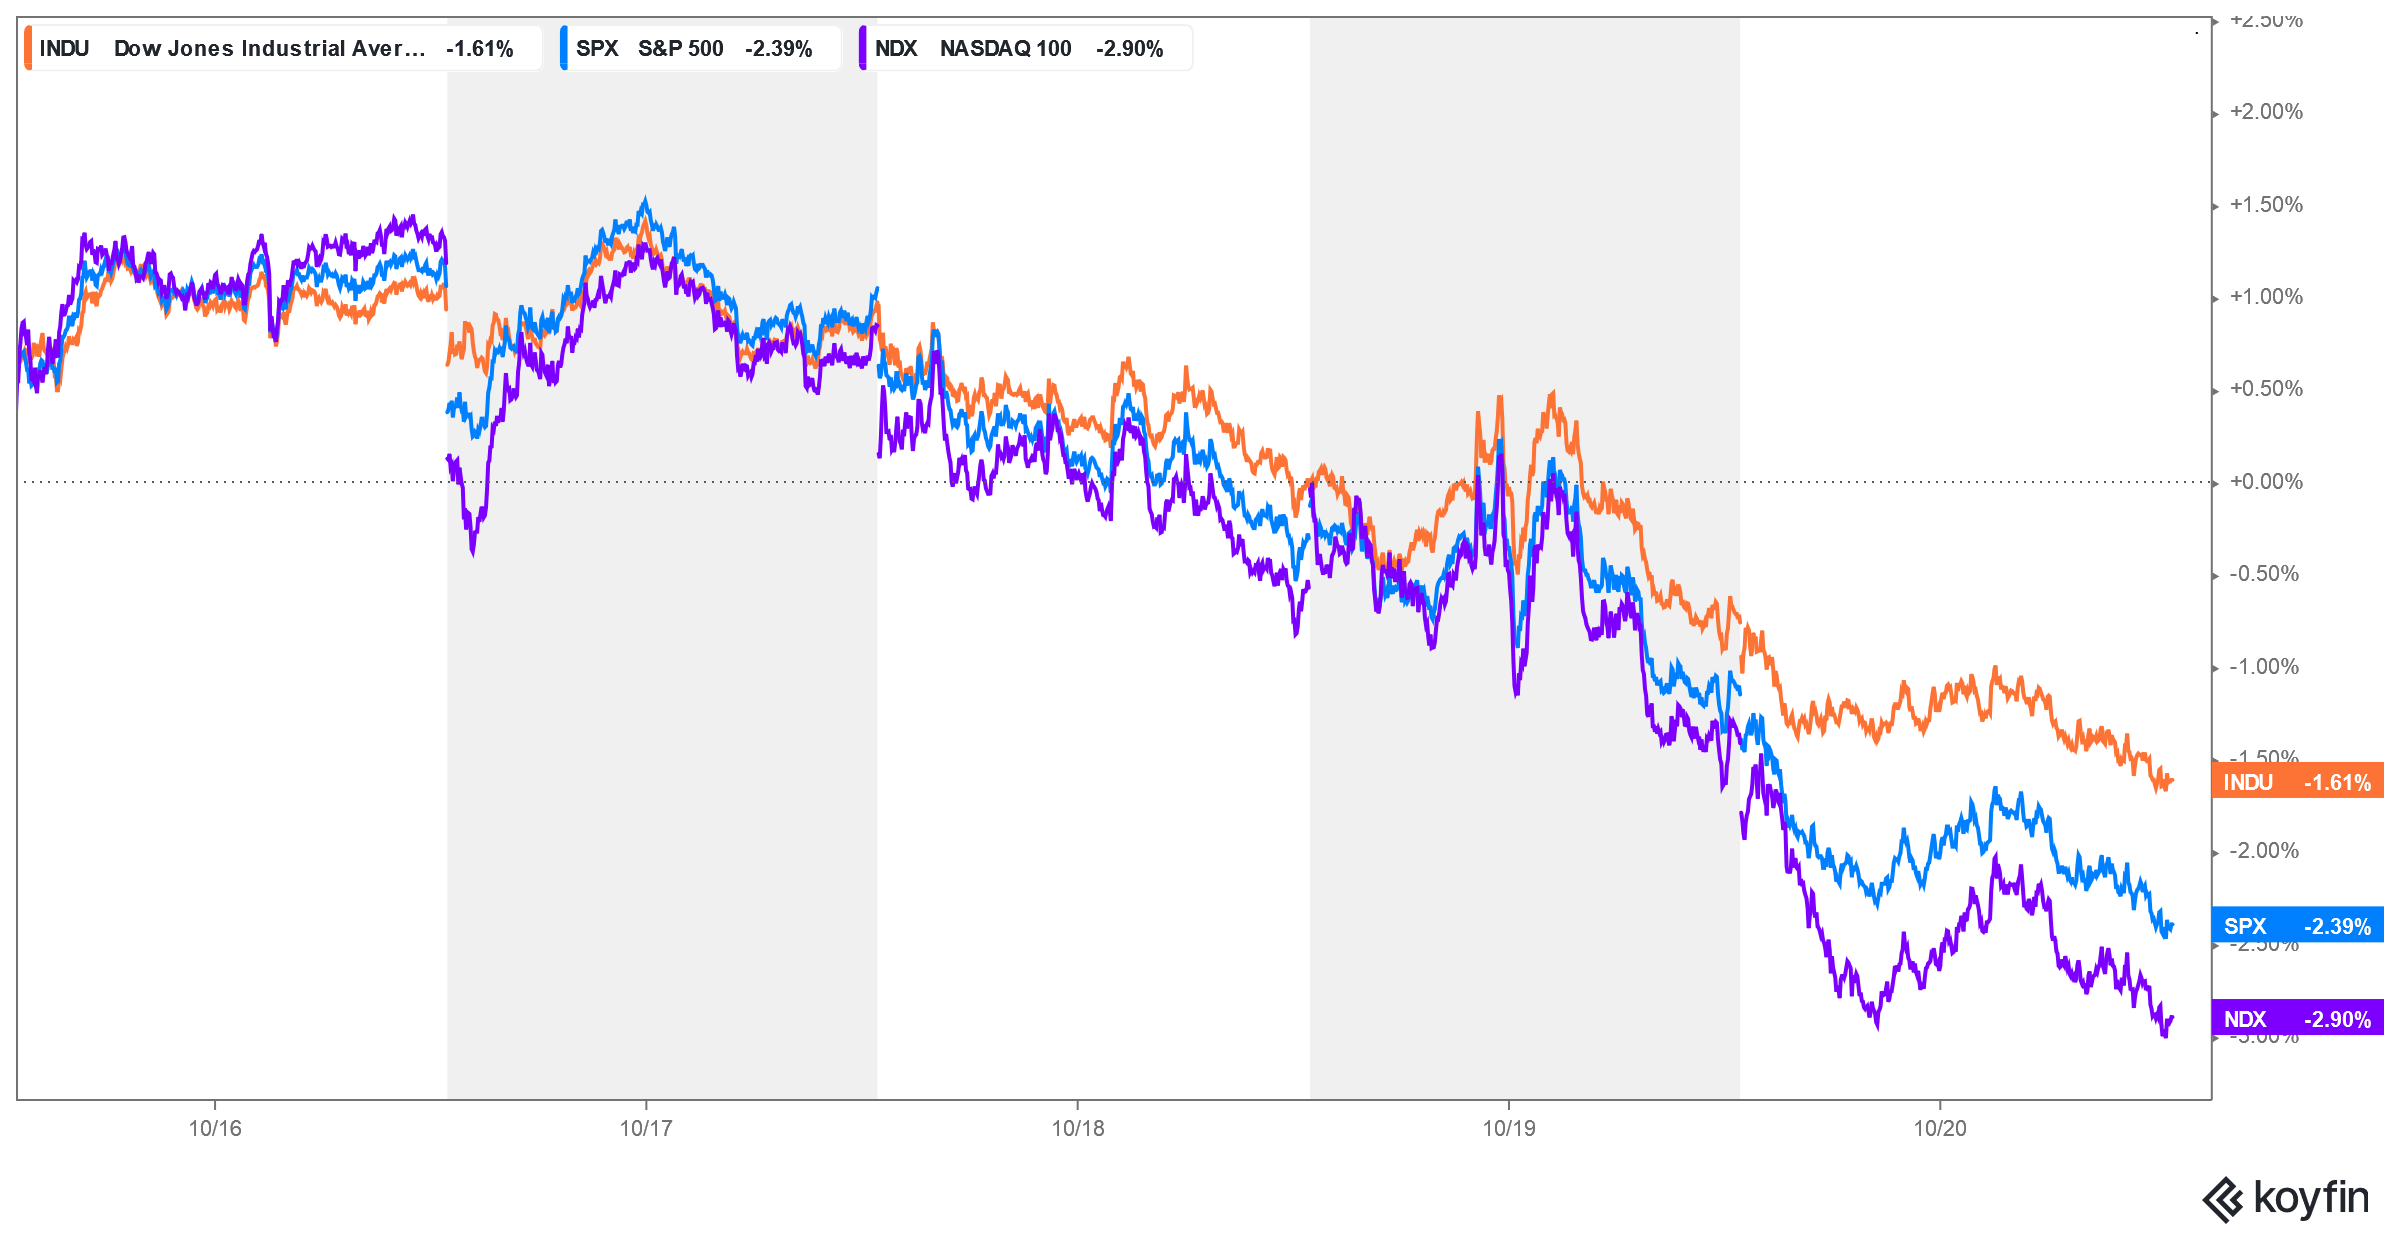 Stocks had an across-the-board meltdown last week with every major index closing lower and on the bottom of the weekly ranges. The market could not shake off the geopolitical news as well as political chaos in the US. The weekly charts are starting to move into oversold territory and almost all sentiment indicators are pointing to extreme fear. Secondary markets have taken over leadership as the Russell plunged into new 2023 lows and is now testing the 2022 lows, settling at the lowest weekly close for the spot mini futures since 26 September 2022. The fund-heavy tech markets saw sharp declines across the board. The Dow is retesting the weekly closing low of 22 May 2023. The S&P is in the same position, closing at the lowest weekly close since 22 May 2023 as the chart inches into slightly oversold conditions. The daily set a new closing low for the decline and is the lowest daily settlement since 1 June 2023 after prices fell short of filling in the breakaway gap left on 21 September 2023. Time and price remain bearish and the S&P is back under the 200-day moving average. The hourly charts are all deeply oversold on Friday’s close.
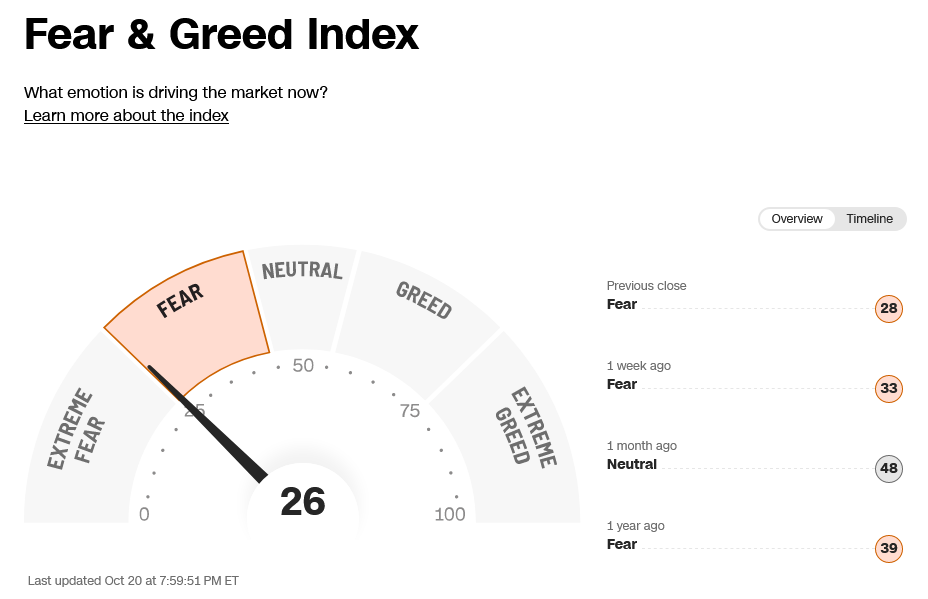
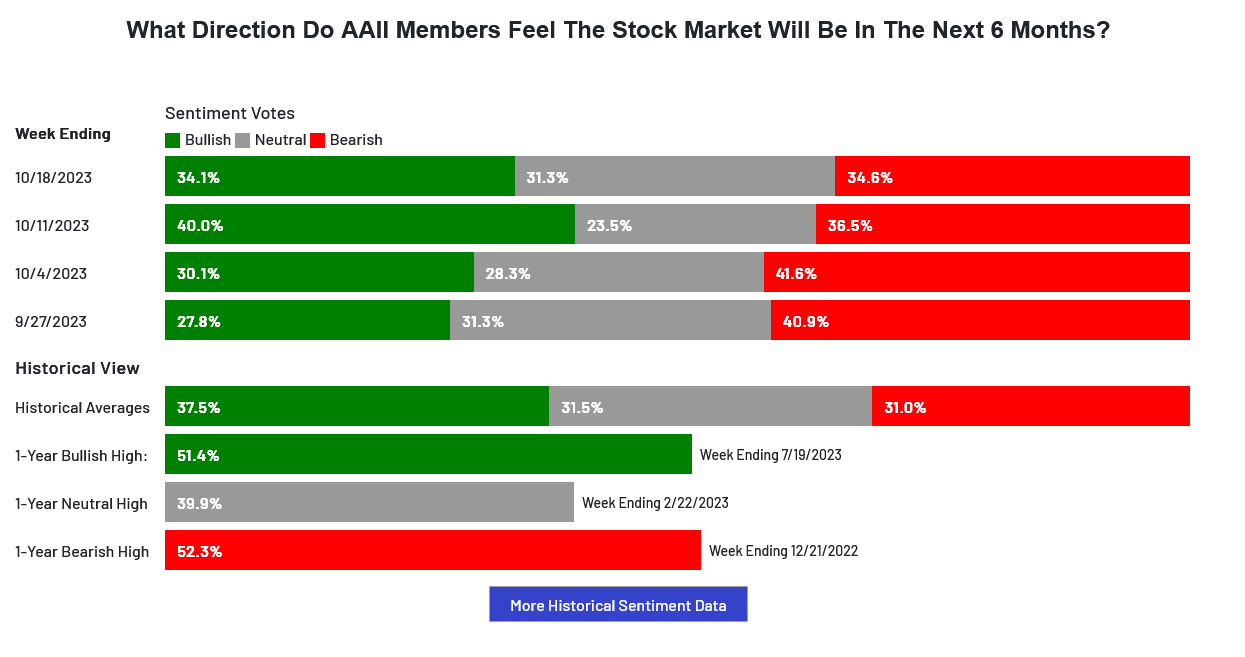
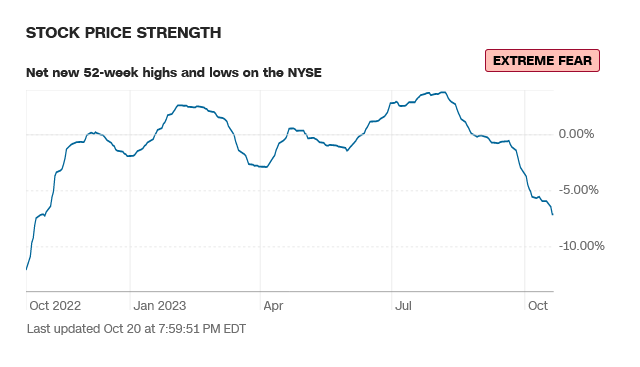
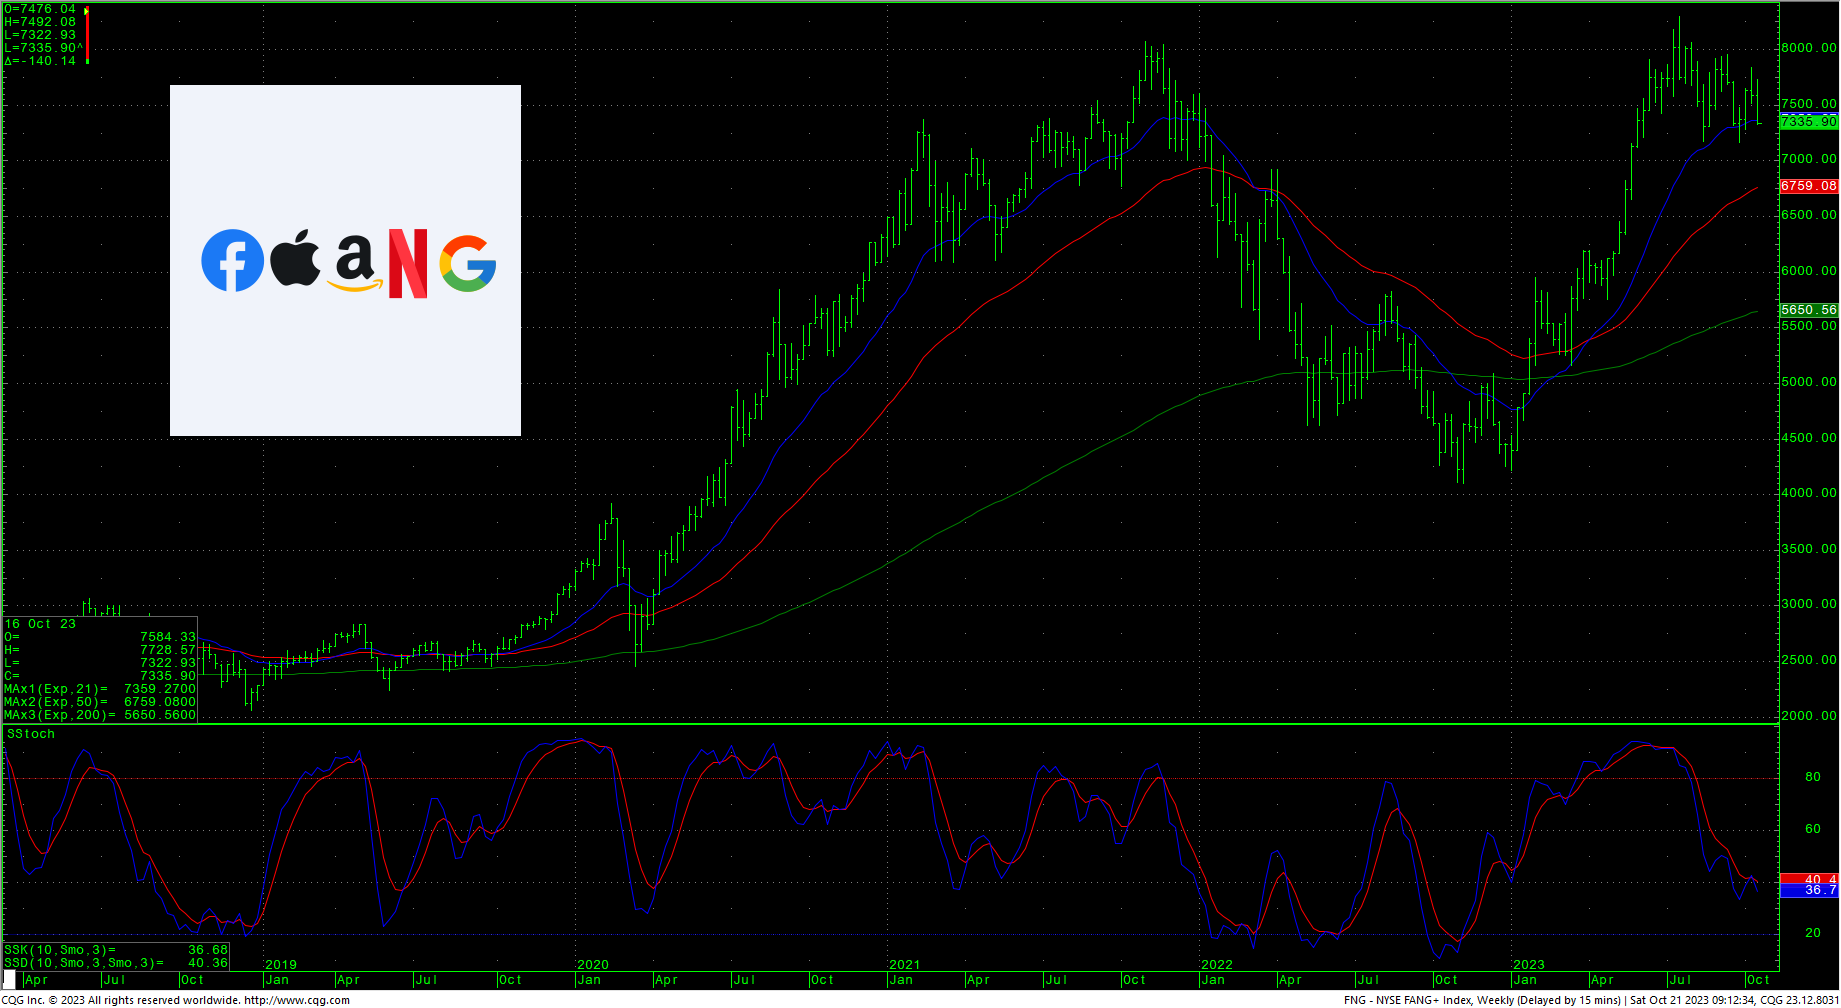
Sentiment remains in EXTREME FEAR with last week’s trade. The AAII Sentiment Index fell back from its slight optimism sentiment last week. The VIX however, traded to the highest level since March of this year and closed on the weekly high. The 52-week, A/D continued lower to -7.10% which is a new low for 2023 and the lowest since October of 2022…indicating extreme fear. The Put/Call ratio sits at 1.00 even, another extreme fear reading. The Dow closed the week down -1.61%. The S&P was down -2.39%. The Nasdaq ended the week down -3.16%, the FANG closed down -3.28% with the Russell down -2.26% , as that market is moved into new 2023 lows. Bonds also plunged last week with all treasuries hitting new lows for the move and the 10-year moved to the highest yield since 2007. The nearby 30-year bond futures are testing monthly support in the 109232/108014 area. The CRB moved higher, led by rallying crude oil and metals, closing +0.82%. The Commitment of Traders CoT remains completely neutral .Asset managers have been doing some modest liquidation while the other major players are frozen in place. Monday marks minor timing and the next key timing point is 11/02-03.
Timing Points
- 10/23 **
- 11/02-03 *** X
CNN Fear & Greed Index
AAII Investor Sentiment Survey
Dow Jones Industrial Average Hourly HLC
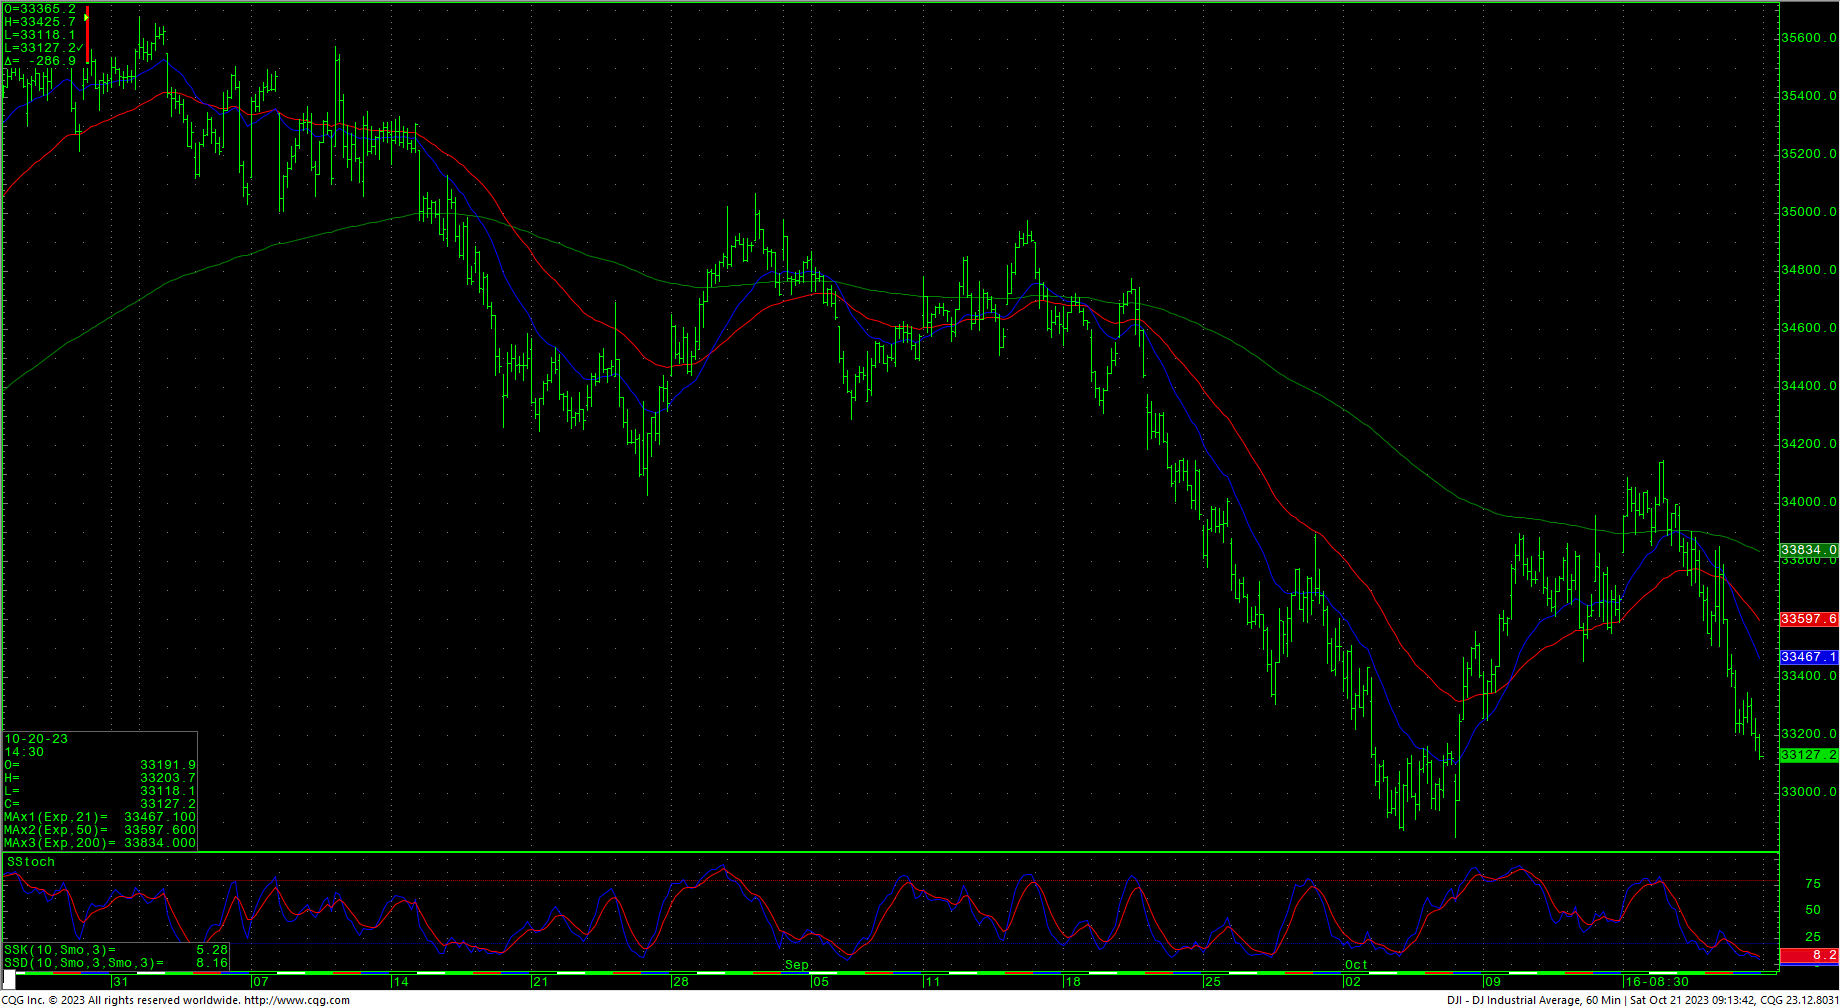
The Dow hourly is deeply oversold on Friday’s close. Prices ended right above support of 33118/33113. Support remains critical intermediate-term against 33053/33045 through 32998. A breakdown with daily closes below 32998 can test 32731 with support at 32586 through 32492. Support is key long-term at 32170 and a close under that area is bearish with counts into the 31341/31330 level. Closes under 31330 in the Dow will open potential to 29806 through 28660.
Resistance is 33371, 33515 and 33696/33700. Closes over 33700 are near-term friendly for a retest of 33958 with potential to 34220/34263. A breakout above 34263 should minimally test 34597/34605. Daily closes over 34605 suggest a test of 35010 with counts to 35070. Closes above 35070 setup a test of the trading highs at 35679 with intermediate counts to 35824 and longer-term counts into a gap area on the daily at 35996 to 36044.
Dow Jones Industrial Average Weekly HLC
Support
- 33118/33113 *** ↓
- 33053/33045 *** ↓
- 32998 *** ↓
- 32846 *** ↓
- 32764 *** ↓
- 32731 **
- 32586 *** ↓
- 32492 *** ↓
- 32432 ** ↓
- 32276 **
- 32170 *** ↓
- 32020 **
- 31805 *** ↓
- 31727 **
- 31429 *** ↓
- 31341/31330 *** ↓
Resistance
- 33258 **
- 33371 **
- 33515/33516 *** ↑
- 33696/33700 *** ↑
- 33958 ***
- 34110 **
- 34220 *** ↑
- 34263 *** ↑
- 34378 ** gap
- 34434 ** fills gap
- 34597/34605 *** ↑
- 34776 ** ↑
- 34900 **
- 35010 *** ↑
- 35070 *** ↑
S&P 500 Cash Index
The S&P hourly is deeply oversold with Friday’s close with the market closing under a major support area at 4262/4255 and just above support of 4216. A continued breakdown with daily closes under 4255 open counts to 4049 and critical long-term support of 3917/3910. Daily closes below 3910 open counts to 3815 and 3770/3754 with potential to monthly support at 3505/3491. A move under 3491 is bearish and opens counts to 3195/3185.
Resistance is 4263, 4288, 4308 and 4328/4332. Closes over 4332 setup 4365 with potential to 4460. A drive over 4460 should minimally test pivotal hourly resistance at 4509/4515. A breakout over 4515 is friendly and sets up a move to 4607. Closes above suggest a minimal test of 4637. A breakout with closes above 4637 opens potential toward 4748 and ultimately 4818. Above the record highs opens counts to 4952/5000 with potential to 5144.
S&P 500 Index Weekly HLC
Support
- 4216 ** ↓
- 4180/4177 *** ↓
- 4049 *** ↓
- 3917/3910 *** ↓
- 3875 **
- 3754/3750 *** ↓
- 3625 **
- 3500/3491 *** ↓
- 3441 **
- 3415 **
- 3279 **
- 3233 ** ↓
- 3195/3185 ***↓
Resistance
- 4263 **
- 4288 **
- 4308 *** ↑
- 4328/4332 *** ↑
- 4365 ** ↑
- 4377/4379 ** gap
- 4385 ** ↑
- 4401 ** fills gap
- 4412/4417 *** ↑
- 4455/4460 ** ↑
- 4509/4515 *** ↑
- 4527 **
- 4541 **
- 4550 **
- 4575 *** ↑
- 4593 **
- 4607 *** ↑


