
TECHNICAL ANALYSIS
Major Indices Week of October 27, 2023
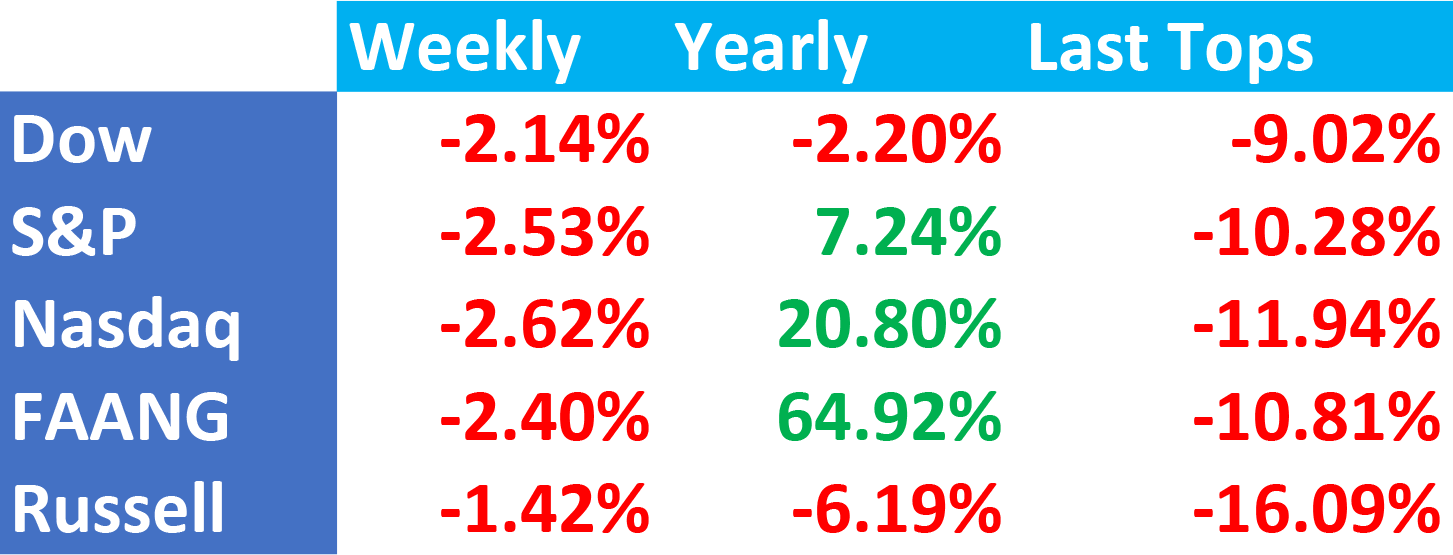
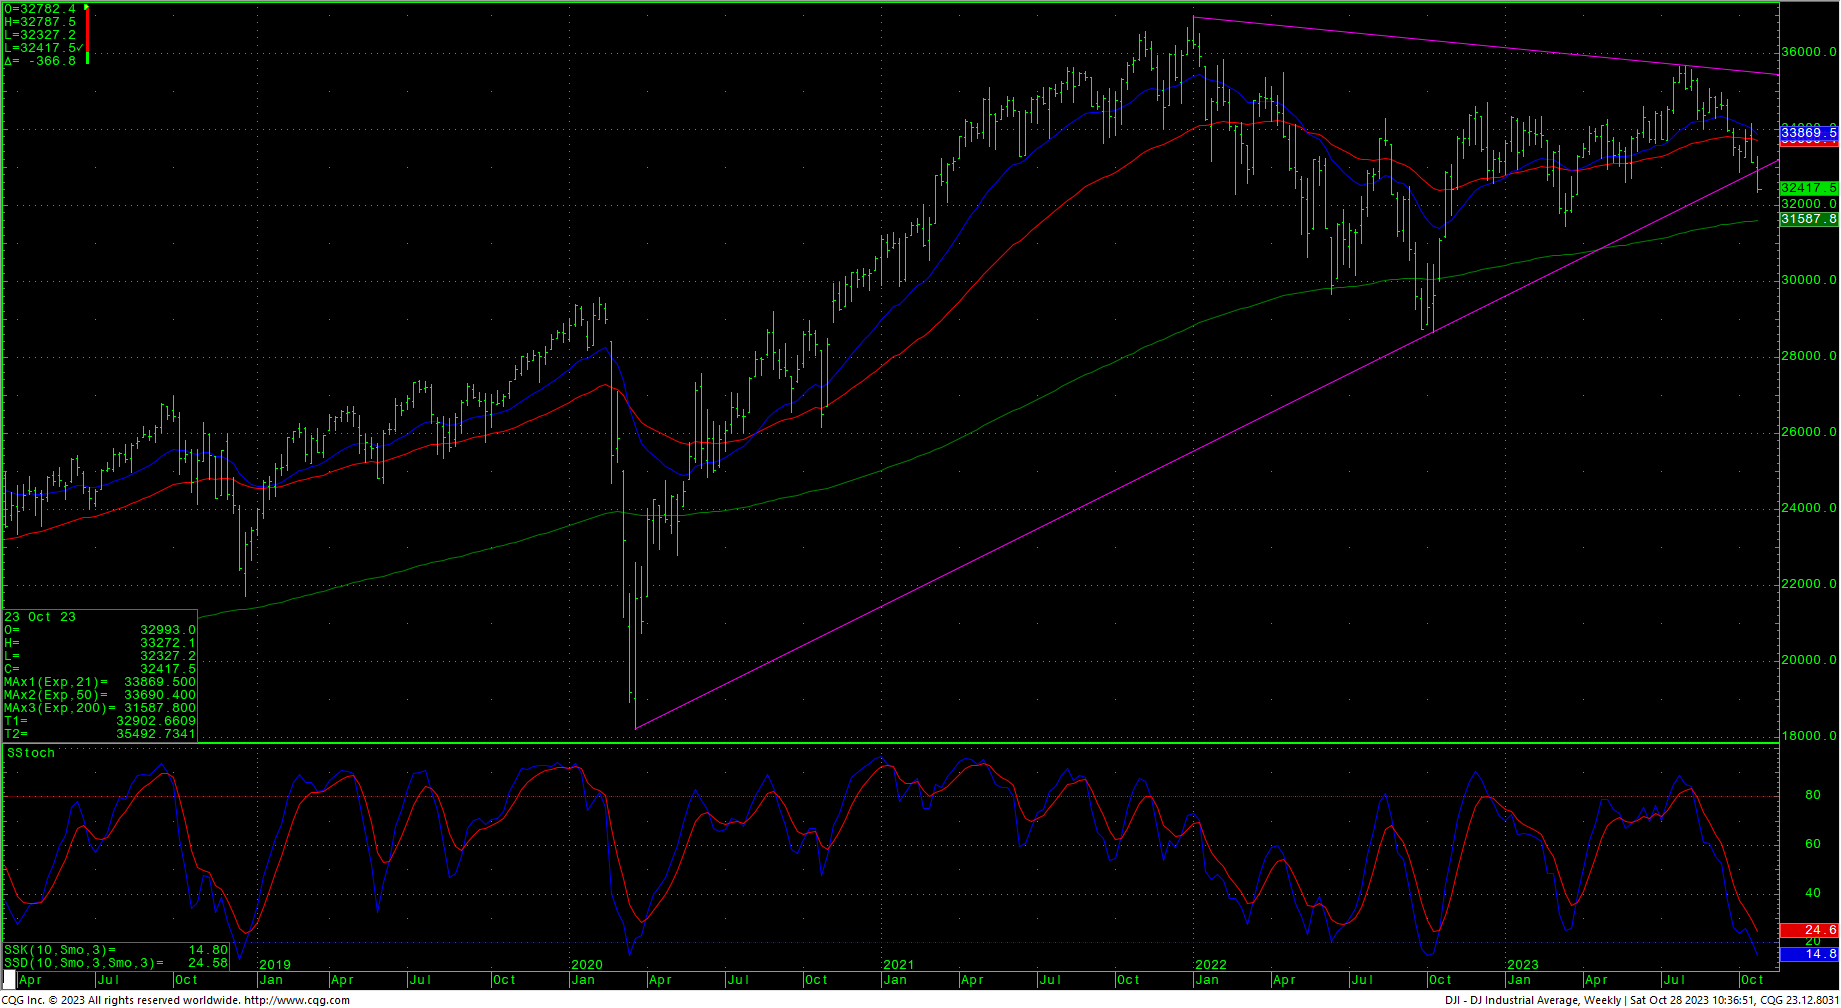
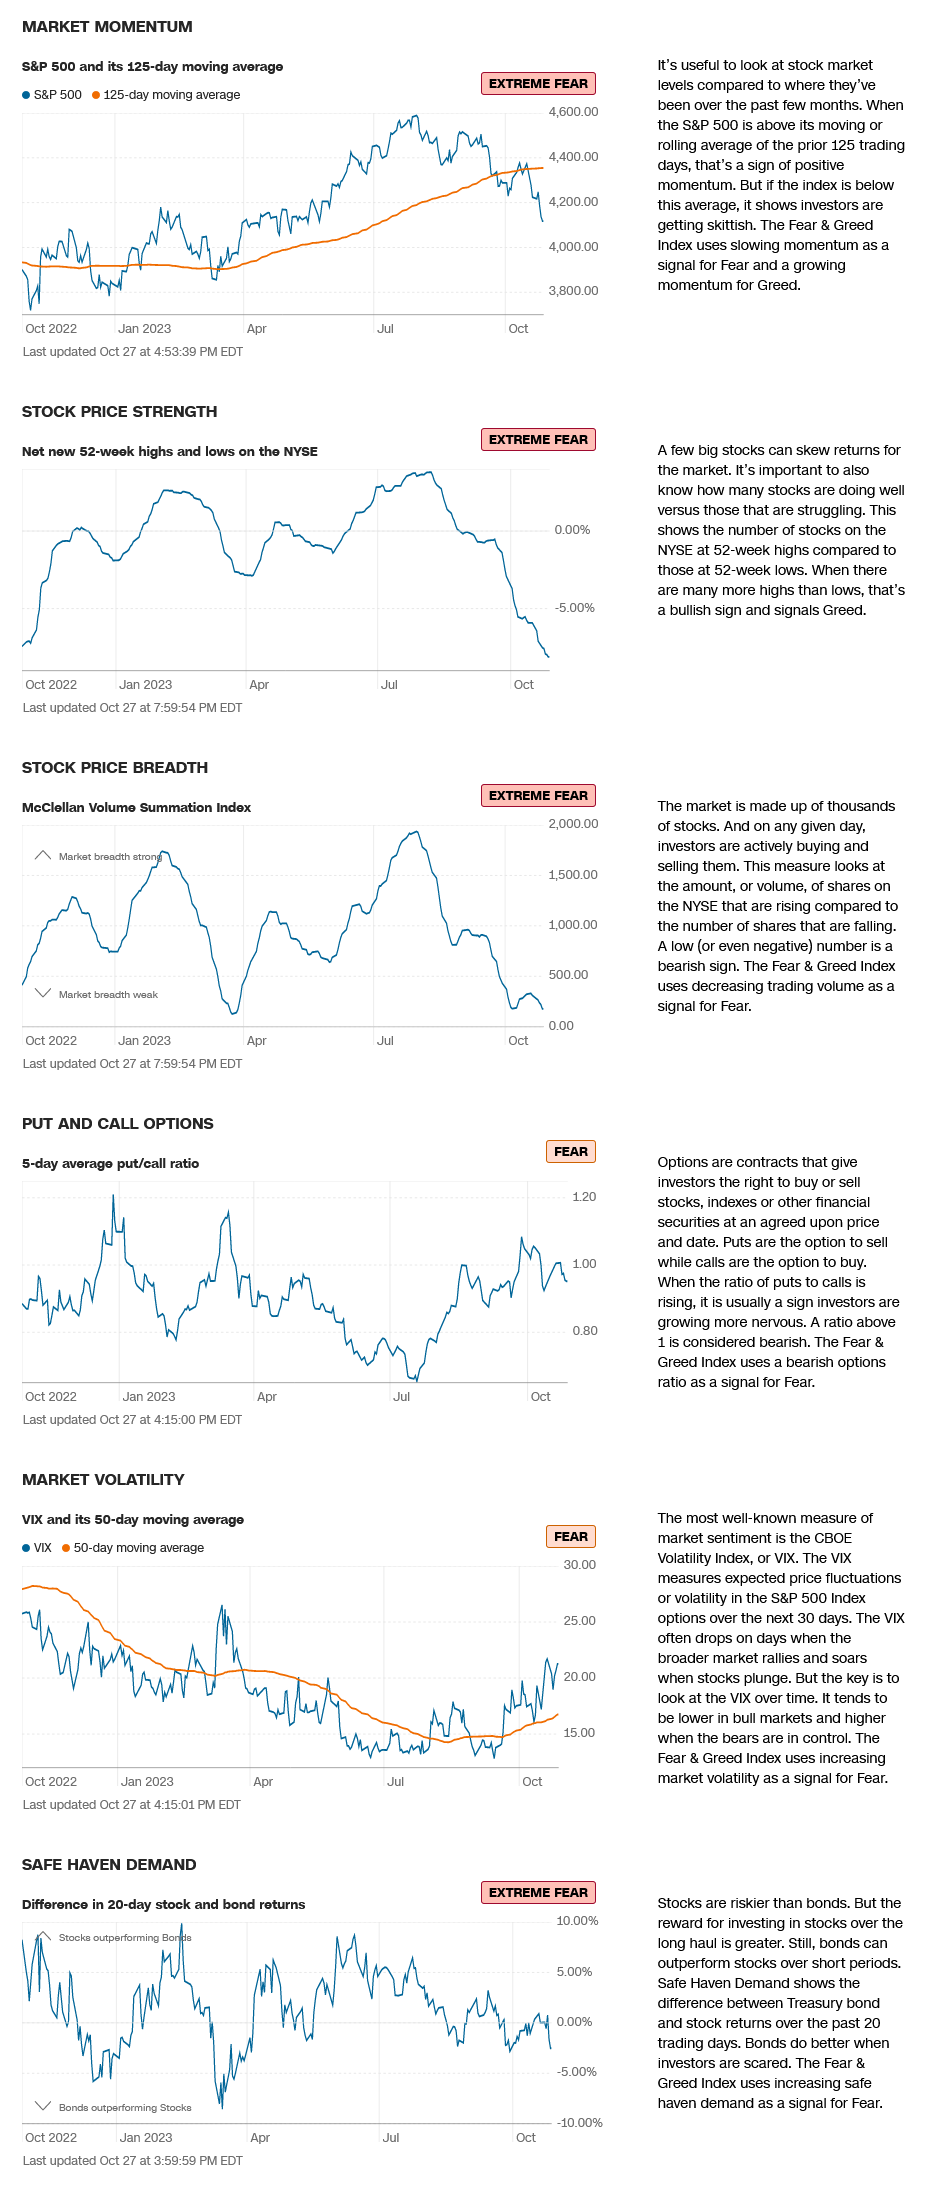
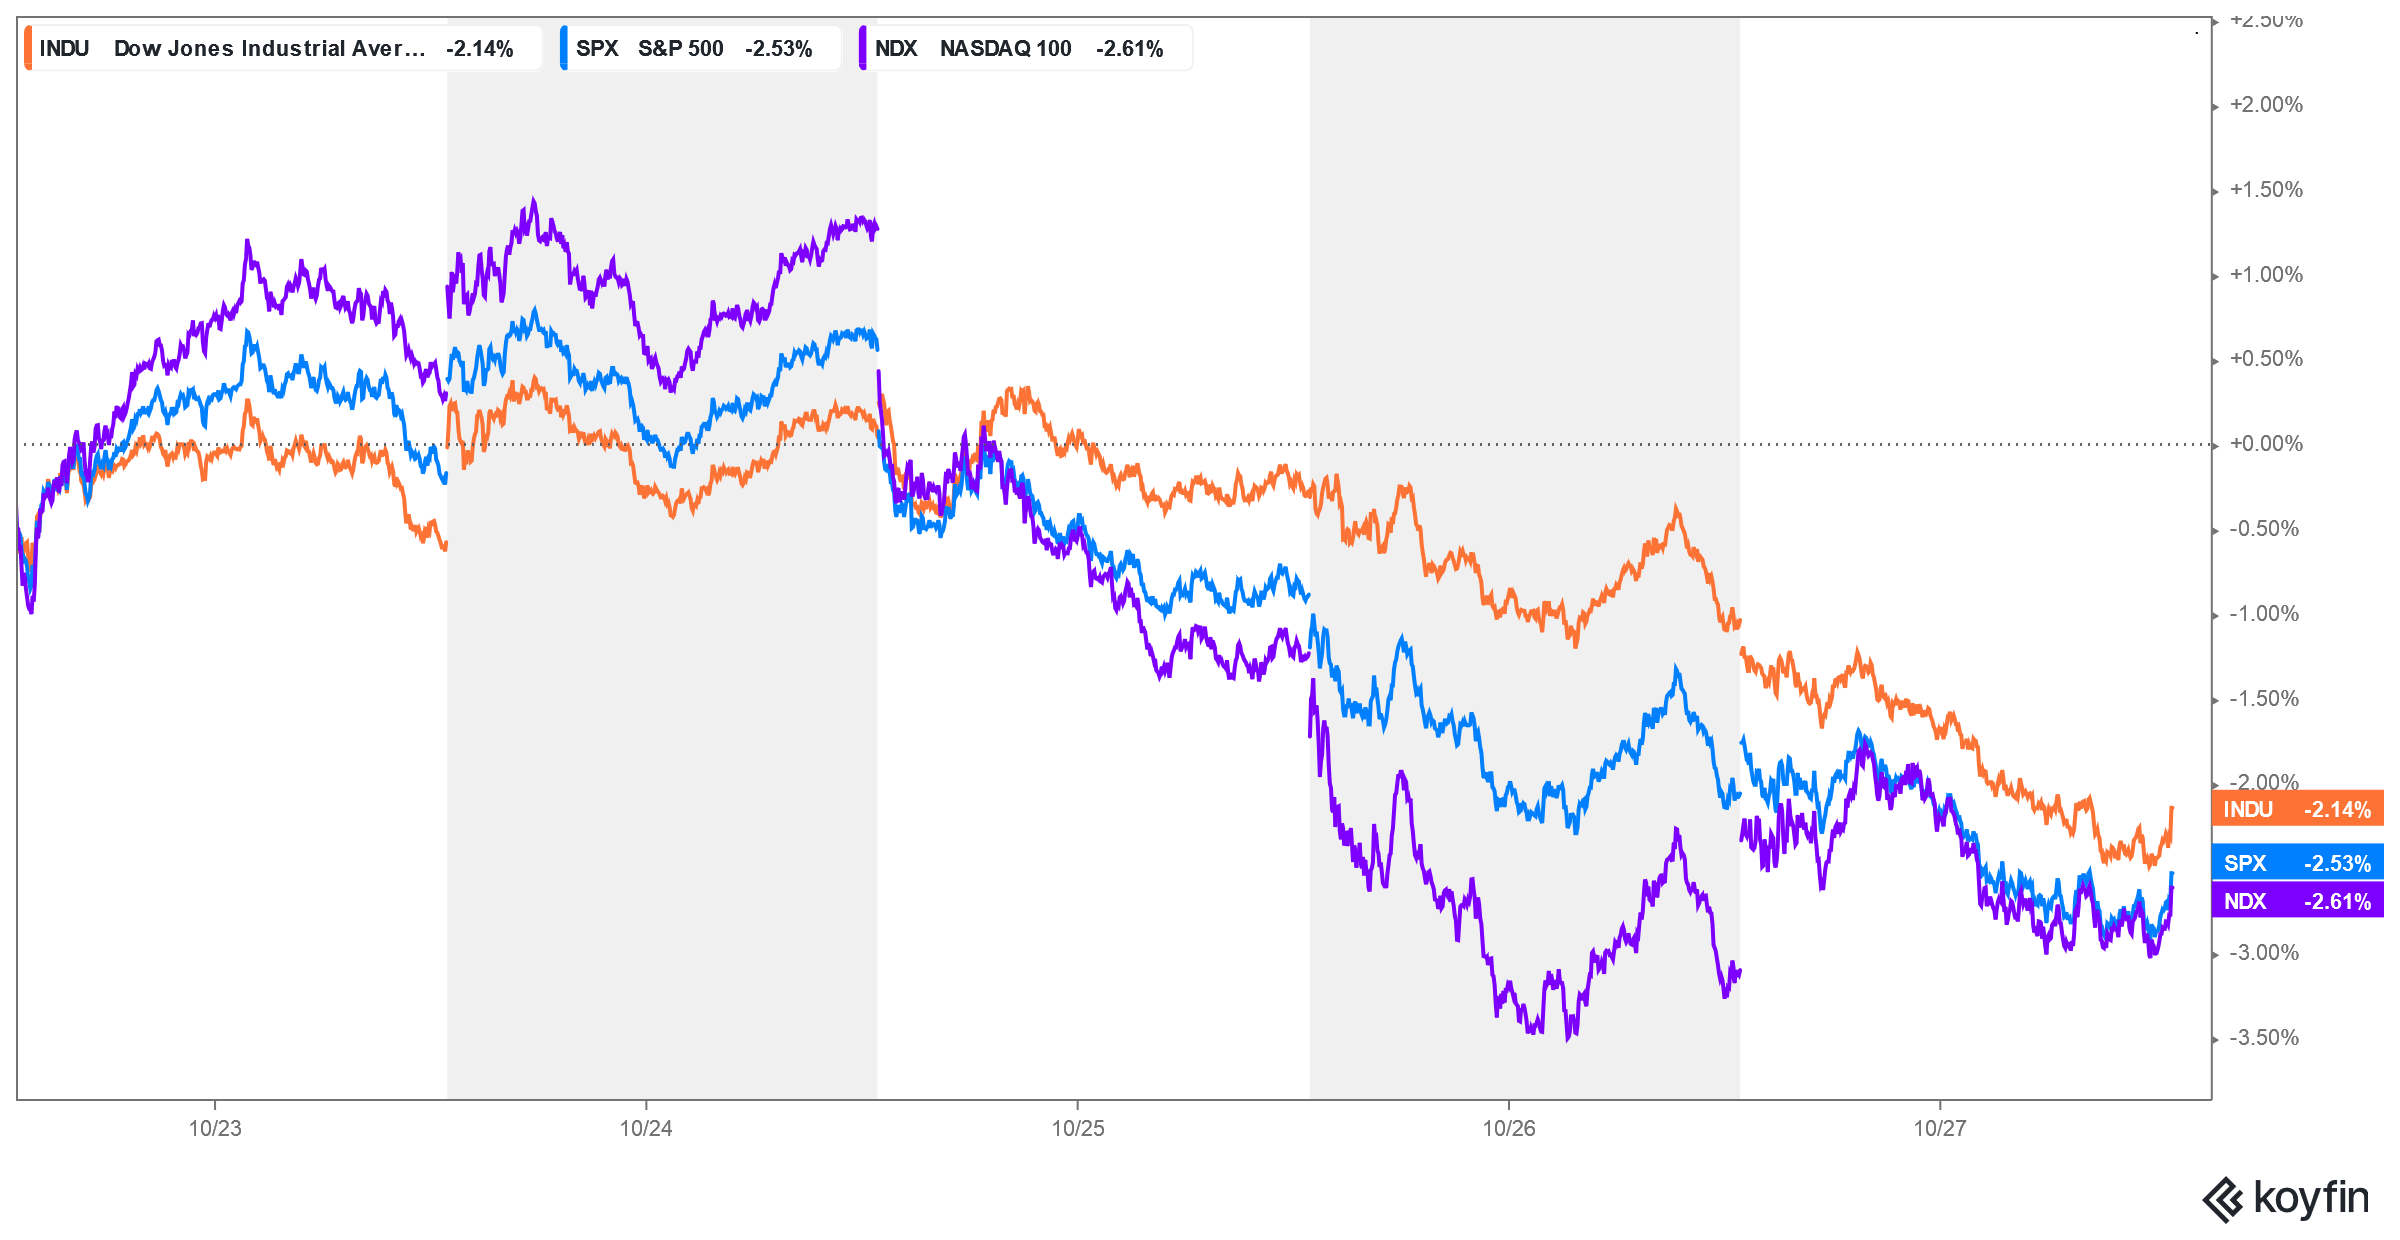 Stocks suffered a second week of sharp declines with most major indices moving into the lower quartile of the year’s ranges. The weekly charts are now in oversold conditions and sentiment is in extreme fear. The Dow broke through a critical trendline on the long-term charts and closed at the lowest weekly settlement since 27 March 2023, and the lowest daily close since 24 March 2023. The Dow is once again lower on the year and is down over 9% from the year’s highs. Every index is now down between 9% and 16% across the board from the 2023 highs with the S&P reaching the psychological -10% value last week. Prices are reacting to a continued meltdown in the bond markets as well as heightening geopolitical news and continued political chaos in the US.
As mentioned, the weekly charts are in oversold territory and the dailies and hourlies are also deeply oversold with Friday’s closes. Time and price remain bearish and the S&P is now moving toward the 50% retracement of the entire move from the 2022 lows to the 2023 highs…reaching an over 10% decline with Friday’s close.
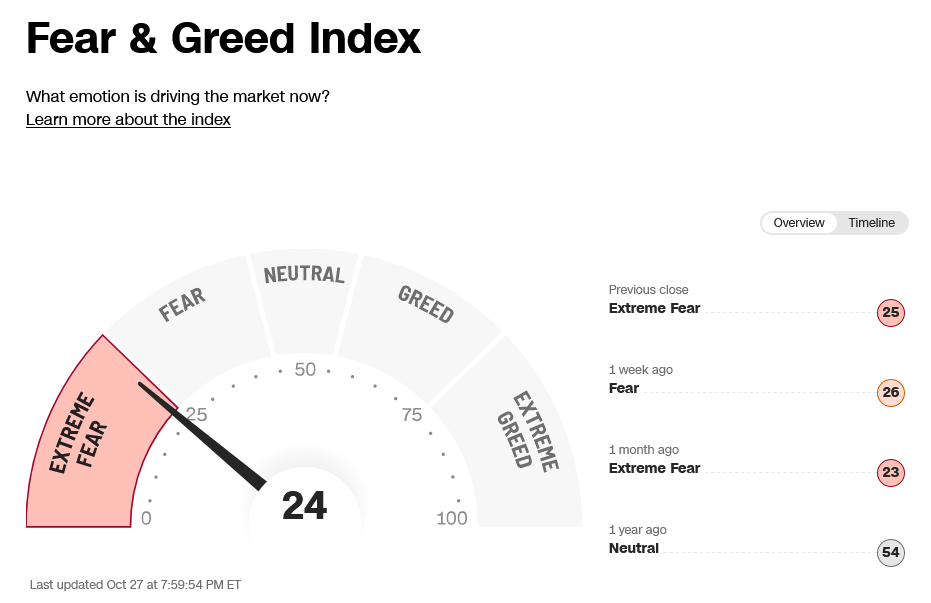
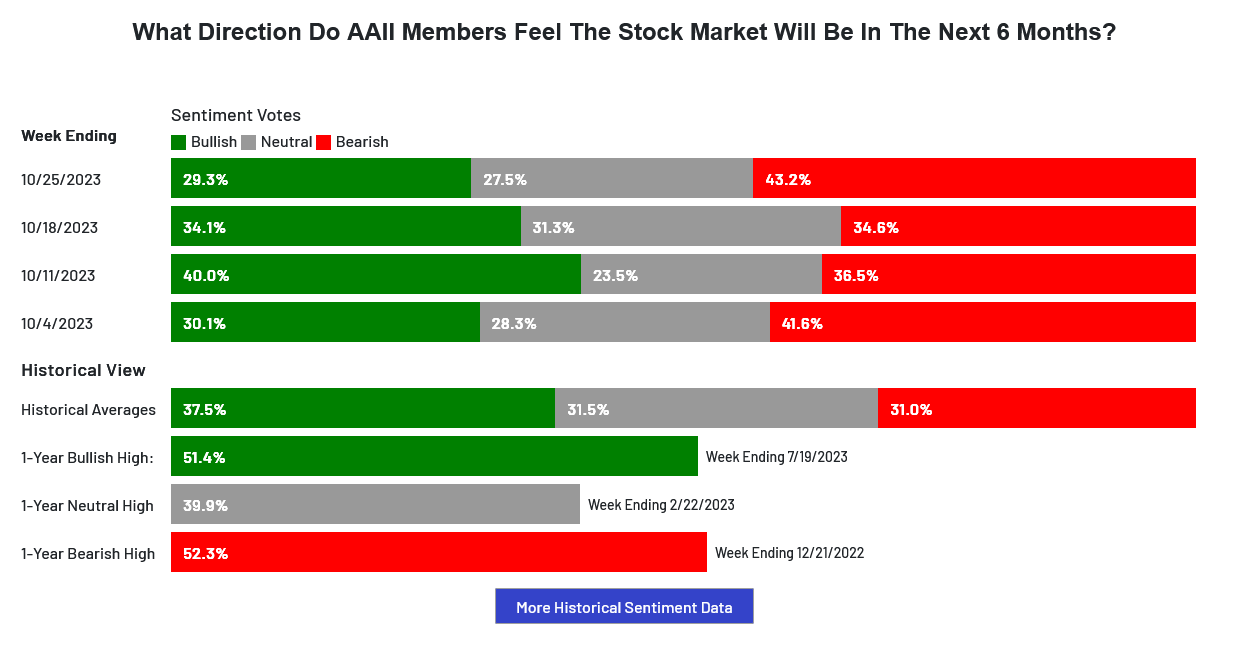
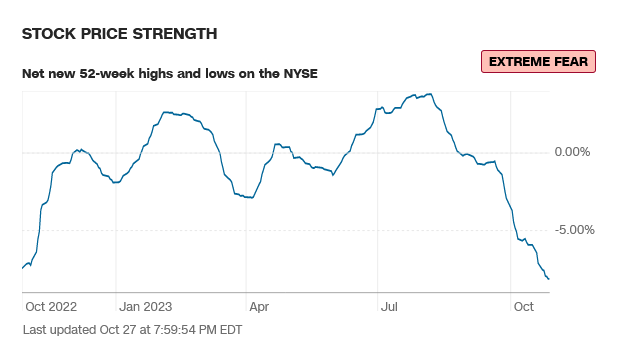
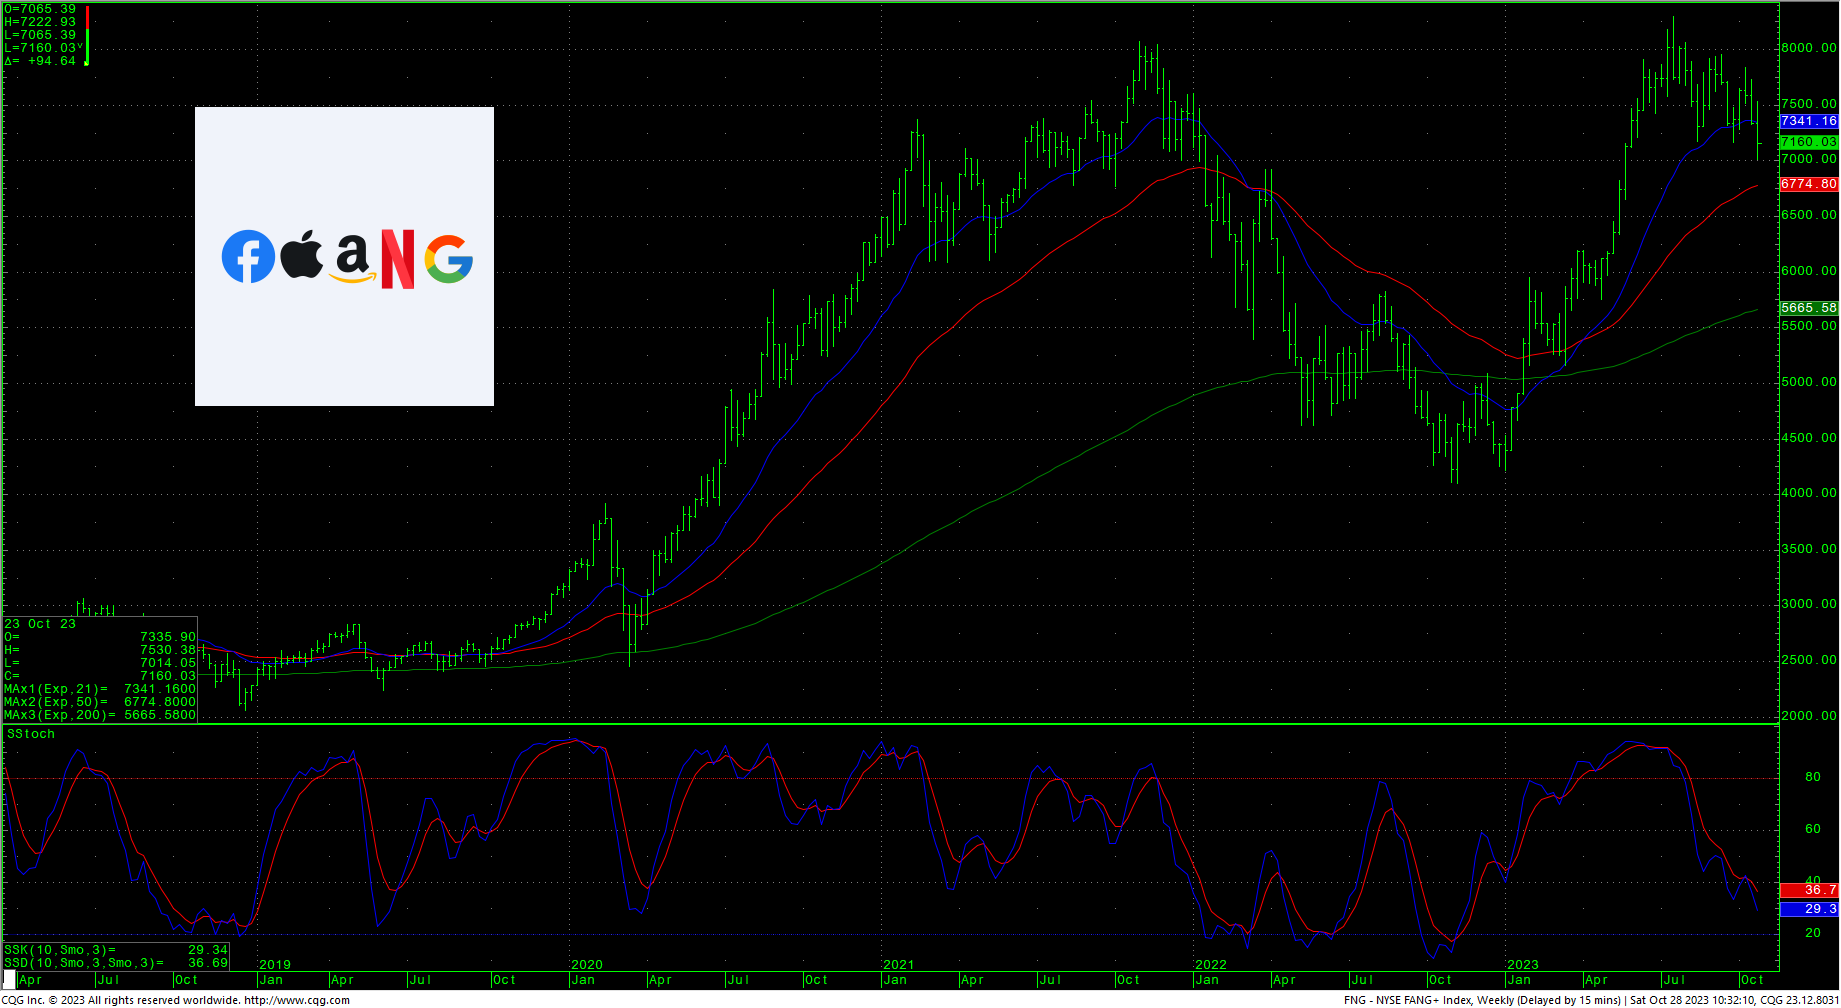
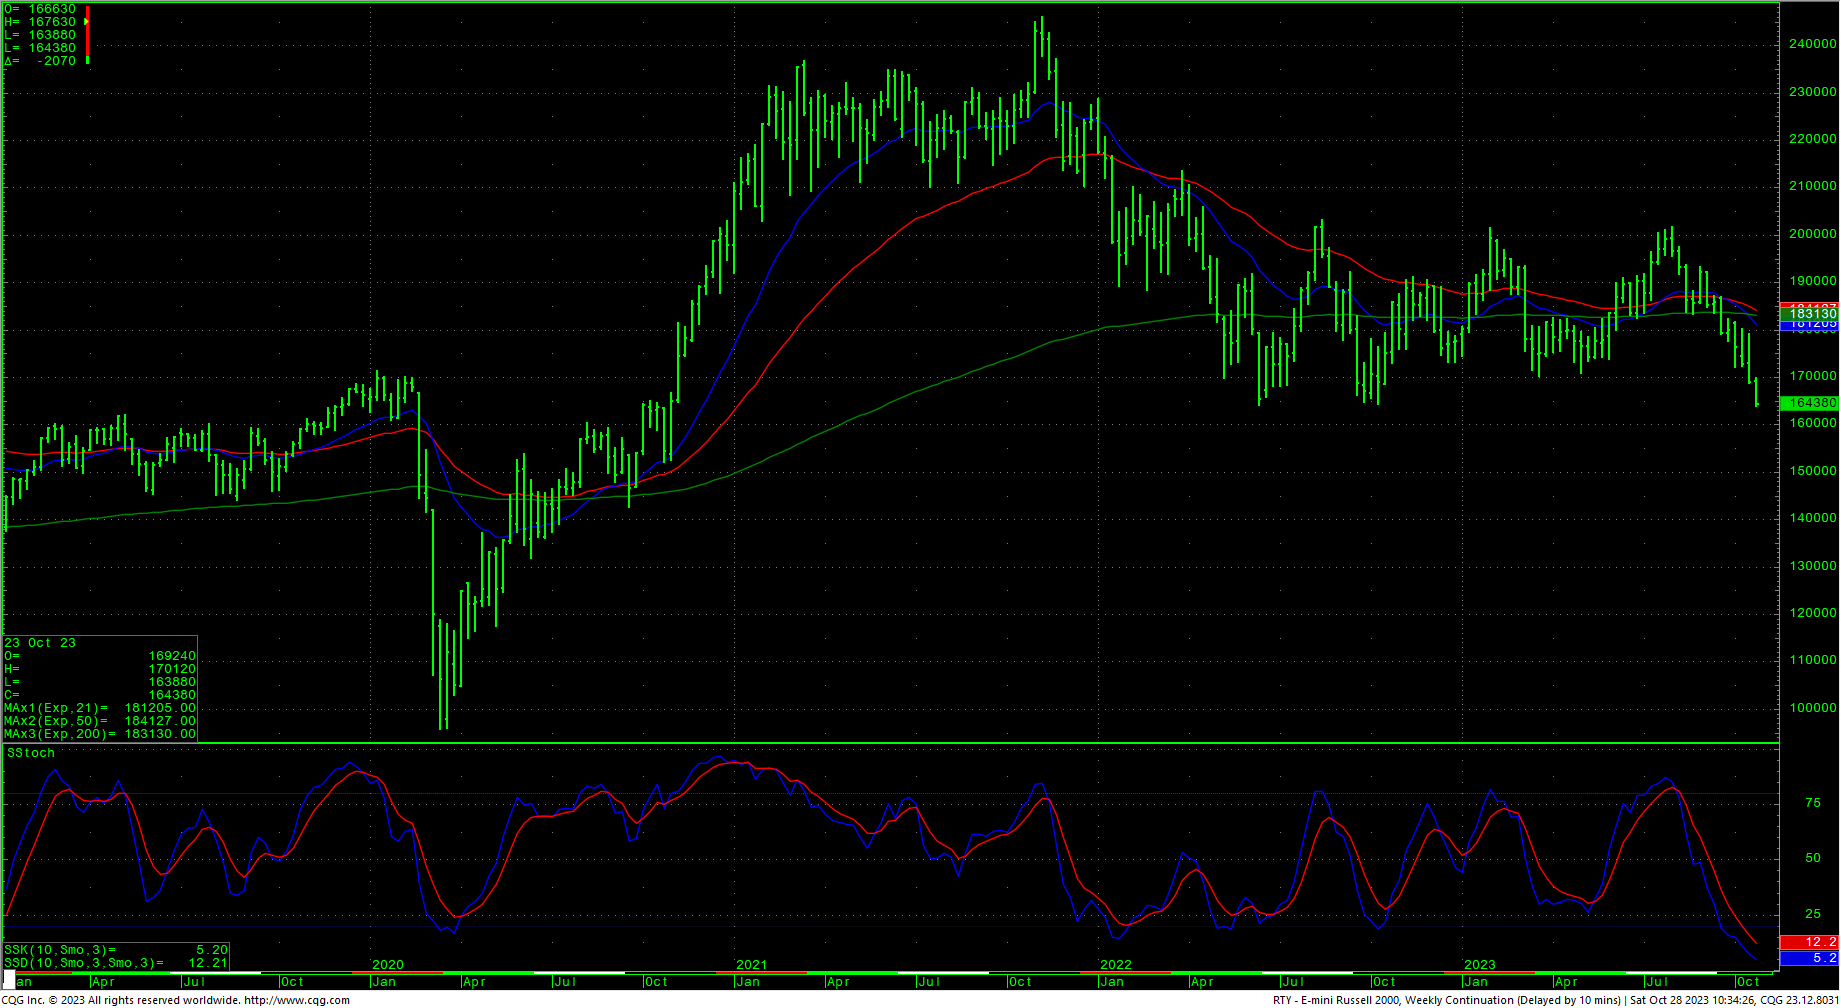
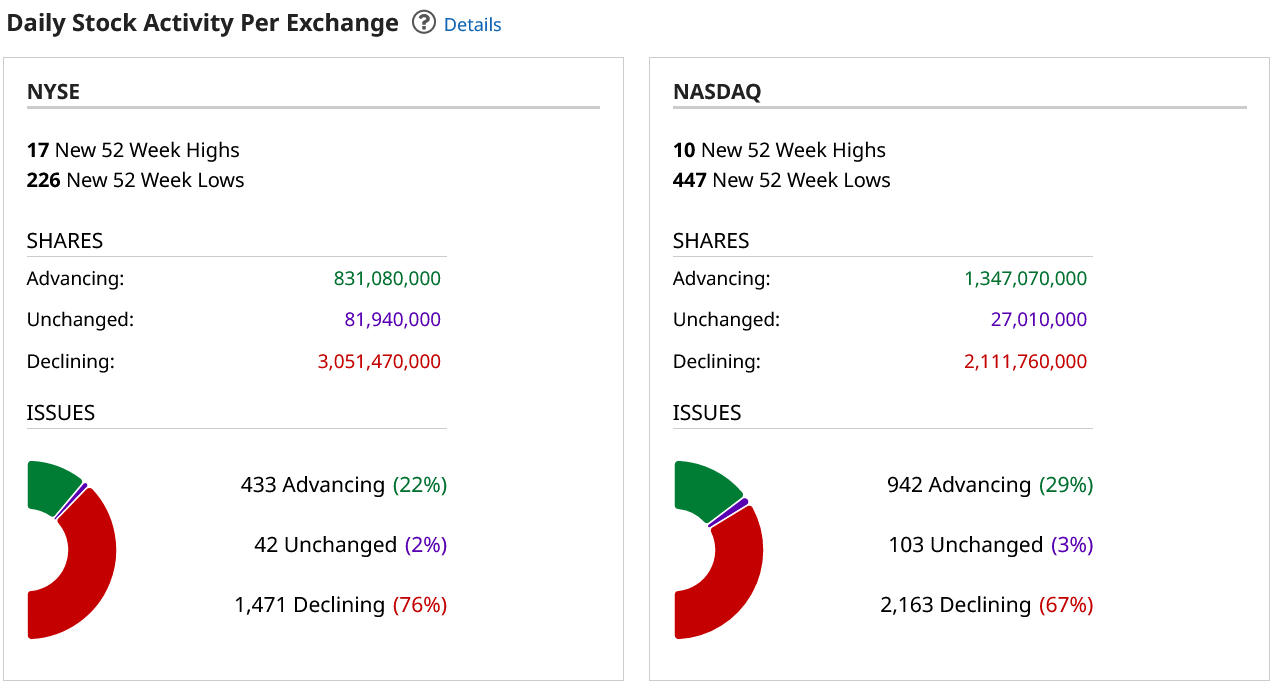 Sentiment remains in EXTREME FEAR. The AAII Sentiment: Pessimism is now at an unusually high level and is above its historical average of 31.0% for the sixth time in eight weeks. The VIX is reflecting the current panic as it trades to the highest level since March of this year. The 52-week, A/D has now plunged to -8.12% and is now testing the levels seen when prices bottomed in 2022…indicating extreme fear. The Put/Call ratio sits at 0.95, another fear reading. The Dow closed the week down -2.14%. The S&P was down -2.53%. The Nasdaq ended the week down -2.62%, the FANG closed down -2.40% with the Russell down -1.42%, as that market is moved into new 2023 lows. Bonds also plunged last week with all treasuries hitting new lows for the move. The 30-year daily chart is flashing a preliminary bullish divergence with the new lows. Once again, the nearby 30-year bond futures are testing monthly support in the 109232/108014 area. If there is ANY place where bonds might at least get a ‘dead-cat-bounce’ it would be at this level. The CRB closed down -0.94%, as crude oil finished slightly lower on the week. The Commitment of Traders CoT is flashing more potential bearish signals as speculators are still buying the market while the commercials are selling…a complete and total reversal of the trends from earlier this year. Asset managers continue with some modest liquidation while funds are nibbling at the market. This Thursday/Friday marks critical timing for stocks.
Timing Points
- 11/02-03 *** X
CNN Fear & Greed Index
AAII Investor Sentiment Survey
Dow Jones Industrial Average Weekly HLC
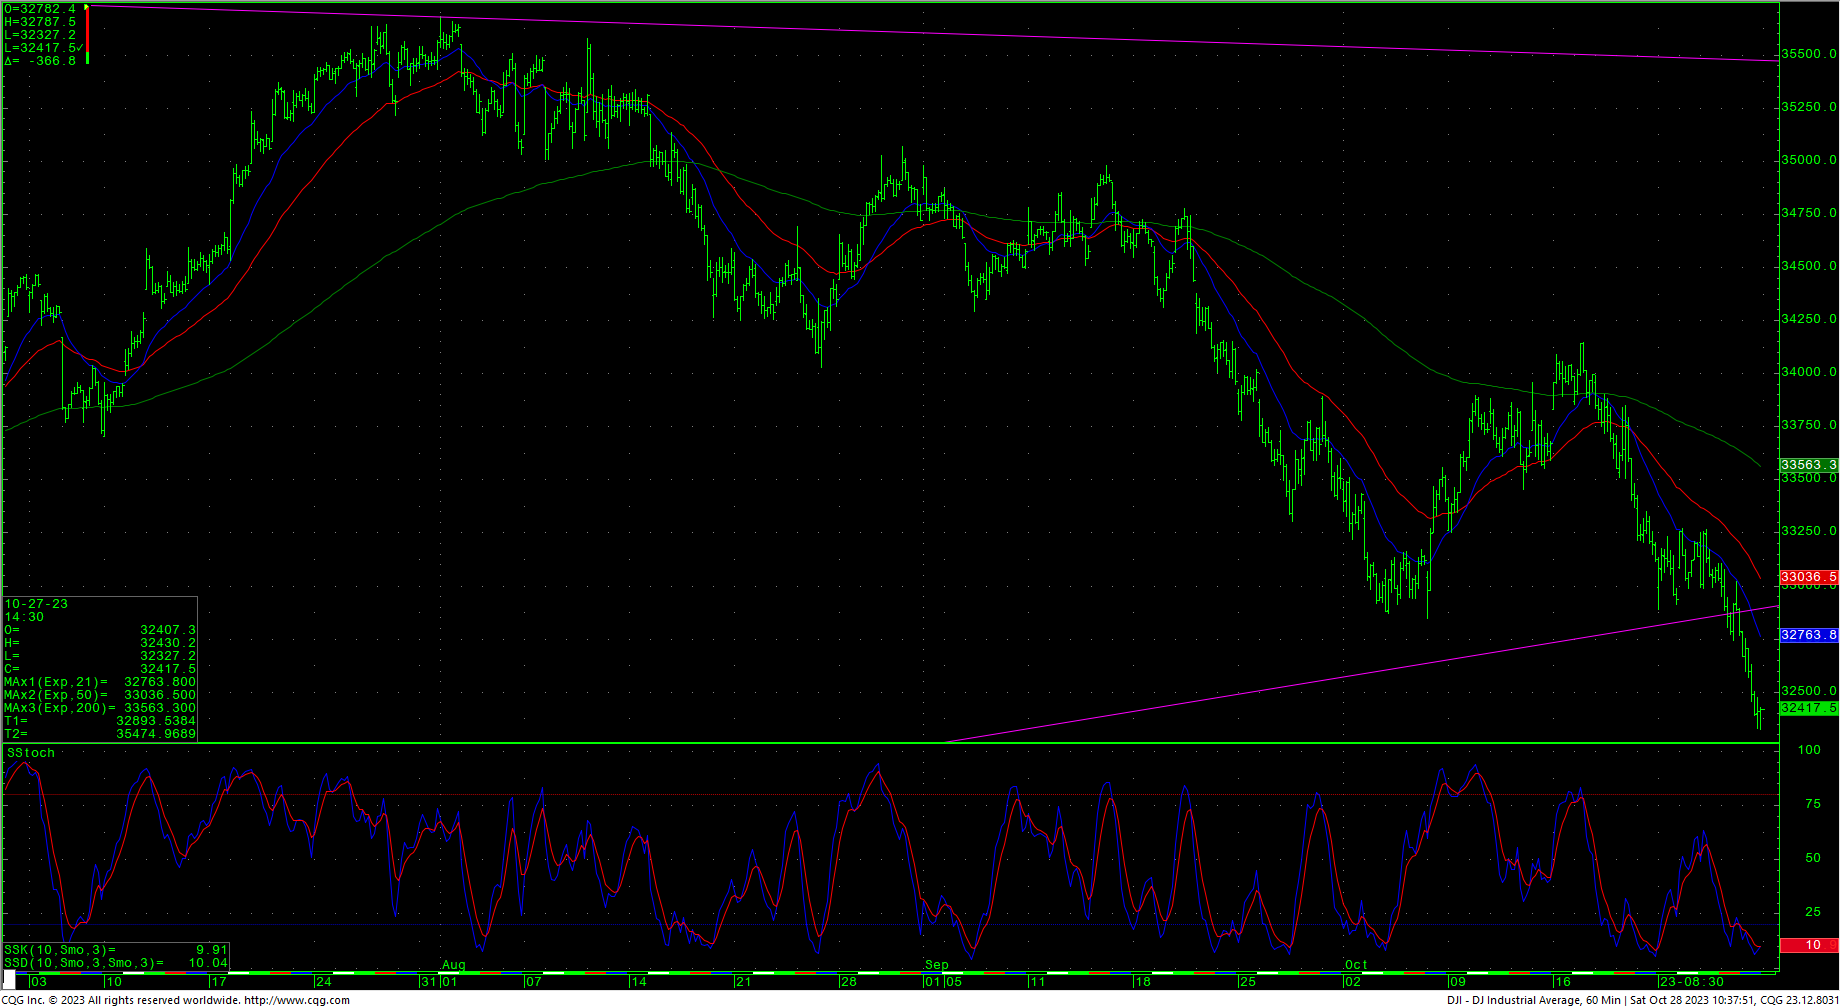
 The Dow hourly is deeply oversold on Friday’s close. The market breached some critical support and closed above the next key area of intermediate-term support against the 32170 level. That area represents a 50% retracement of the entire move from the 2022 lows to the 2023 highs. A continued breakdown with closes under 32170 is bearish and opens counts into the 34129 through 31341/31330 level. Closes under 31330 in the Dow will open potential to 29806 through 28660 with support at 30415 and 30317.
Resistance is 32755, 33021, 33235 and 33449/33455. Closes over 33455 are near-term friendly for a test of 33608 with potential to 34003, 34143 and possibly 34398/34410. A breakout above 34410 should minimally test 34841/34888. Daily closes over 34888 suggest a test of 35010 with counts to 35070. Closes above 35070 setup a test of the trading highs at 35679 with intermediate counts to 35824 and longer-term counts into a gap area on the daily at 35996 to 36044.
Dow Jones Industrial Average Hourly HLC
Support
- 32327 **
- 32276 **
- 32170 *** ↓
- 32020 **
- 31805 *** ↓
- 31727 **
- 31429 *** ↓
- 31341/31330 *** ↓
- 31250 **
- 31161 *** gap
- 31119 *** ↓ fills gap
- 30990 **
- 30837/30822 ***
- 30625 **
- 30415/30317 *** ↓
Resistance
- 32596 **
- 32755 ***
- 32920 **
- 33021 ***
- 33118 **
- 33235 *** ↑
- 33349 **
- 33449/33455 *** ↑
- 33607/33609 *** ↑
- 33714 **
- 33852 ** ↑
- 34003 *** ↑
- 34143 ** ↑
- 34220 **
- 34398/34410 *** ↑
S&P 500 Cash Index
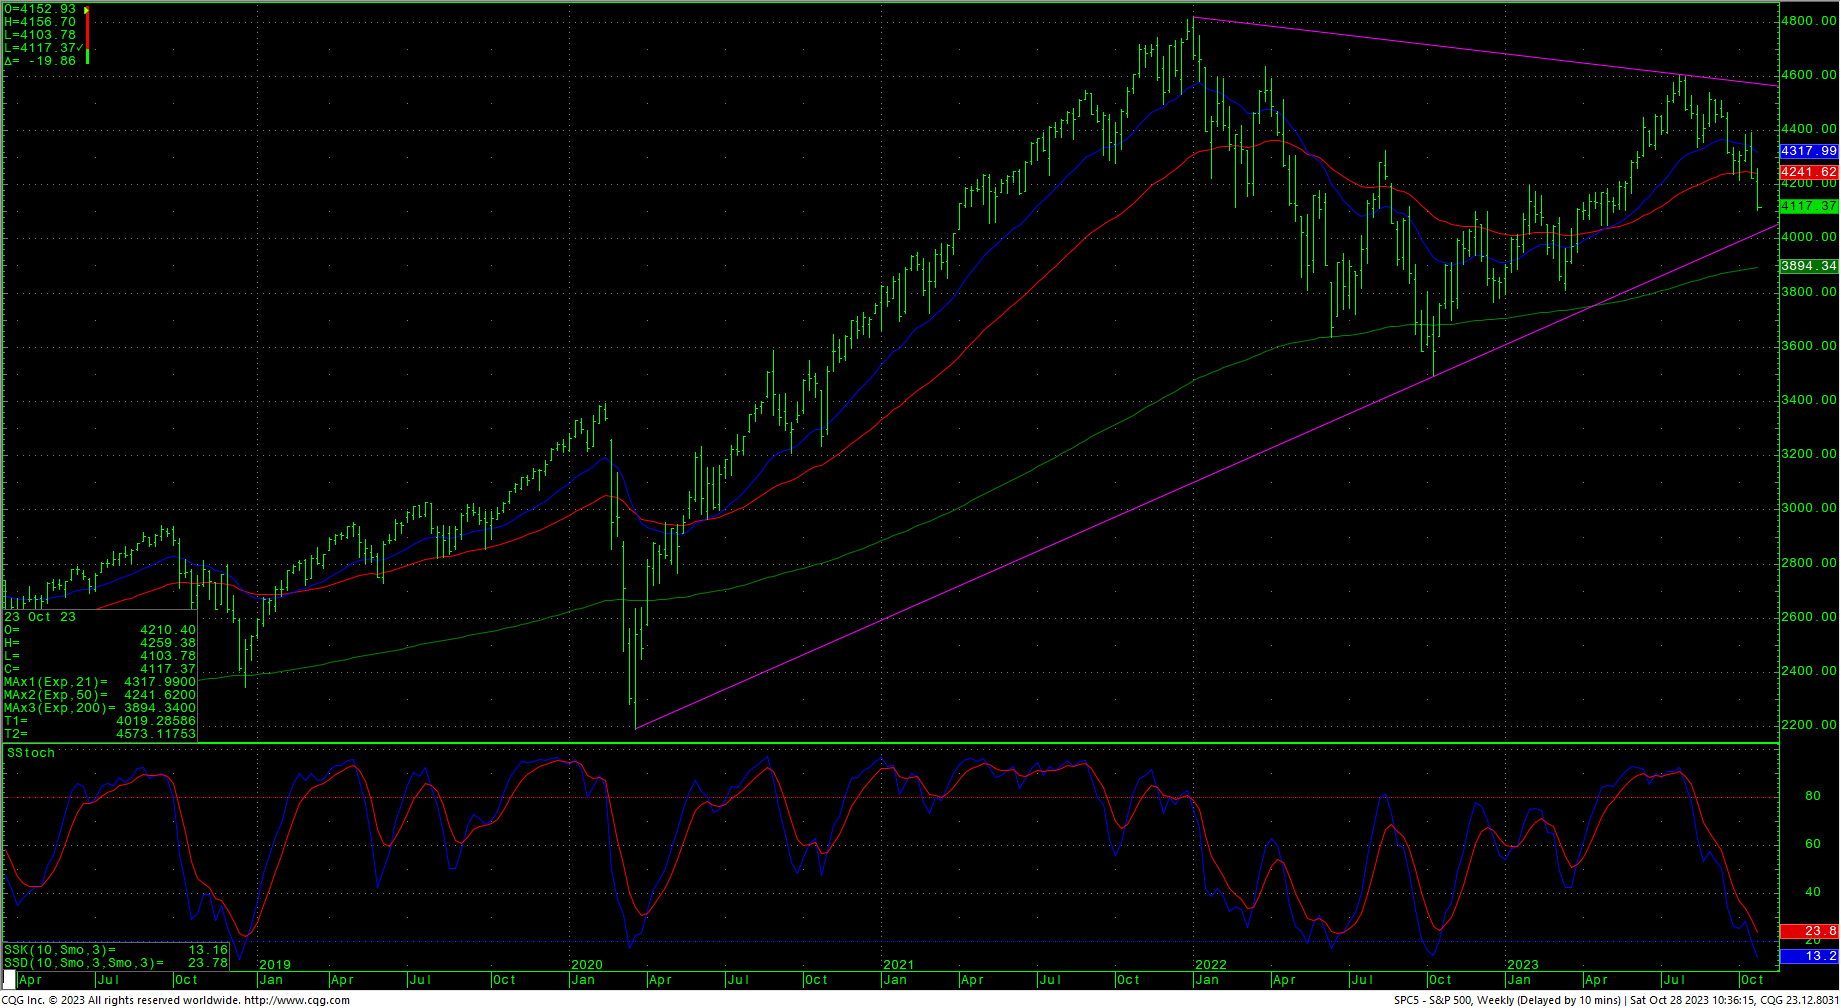
The S&P is deeply oversold on the hourly and both the daily and weekly charts are into oversold territory. Prices are still holding above a potential downside target in the 4049 area. A continued breakdown with daily closes under 4049 opens counts to critical long-term support of 3917/3910. Daily closes below 3910 open counts to 3815 and 3770/3754 with potential to monthly support at 3505/3491. A move under 3491 is bearish and opens counts to 3195/3185.
Resistance is 4172, 4214, 4249 and 4383/4288. Closes over 4288 setup 4323 with potential to 4375/4380 through 4393. A drive over 4393 should minimally test resistance at 4509/4511. A breakout over 4511 is friendly and sets up a move to 4607. Closes above suggest a minimal test of 4637. A breakout with closes above 4637 opens potential toward 4748 and ultimately 4818. Above the record highs opens counts to 4952/5000 with potential to 5144.
S&P 500 Index Weekly HLC
Support
- 4103 **
- 4049 *** ↓
- 3917/3910 *** ↓
- 3875 **
- 3754/3750 *** ↓
- 3625 **
- 3500/3491 *** ↓
- 3441 **
- 3415 **
- 3279 **
- 3233 ** ↓
- 3195/3185 ***↓
Resistance
- 4149 **
- 4172 **
- 4214 **
- 4249 ***
- 4263 **
- 4283/4288 *** ↑
- 4308 **
- 4323 *** ↑
- 4375/4393 *** gap
- 4401 ** fills gap
- 4412/4417 *** ↑
- 4455/4460 **
- 4509/4515 *** ↑
- 4527 **
- 4541 **
- 4550 **
- 4575 *** ↑
- 4593 **
- 4607 *** ↑


