
“Empowering Your Financial Success”
Daily Market Insights: November 14th, 2023
Global Markets Summary:
Asian Markets:
- Nikkei 225 (Japan): +1.92%
- Hang Seng (Hong Kong): Closed.
- Shanghai Composite (China): Closed.
European Markets:
- DAX (Germany): +1.76%
- CAC 40 (France): +1.01%
- FTSE 100: +0.08%
US Futures:
- S&P Futures: opened @ 4458.97(+1.07%)
US Market Snapshot:
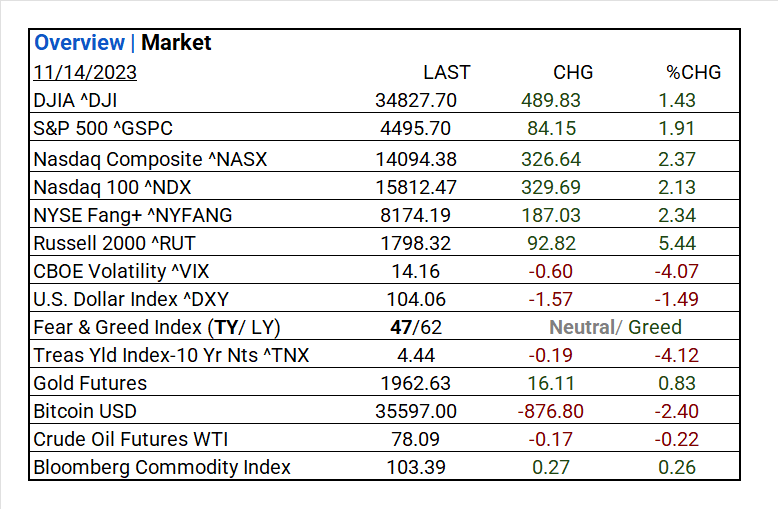
Key Stock Market Indices:
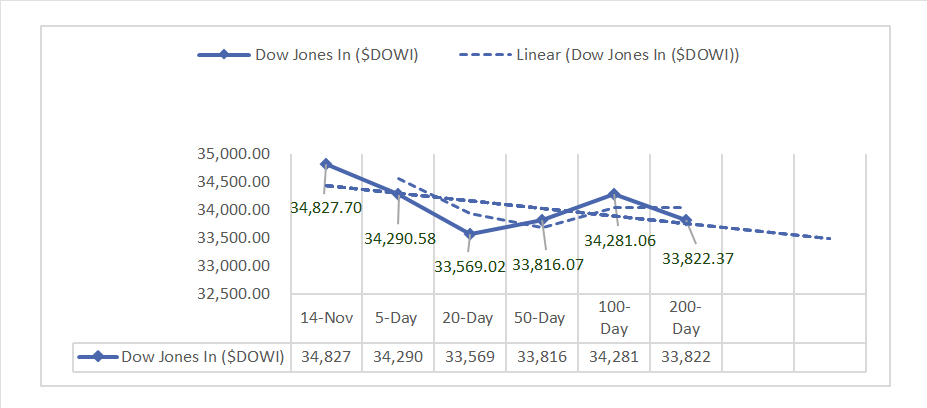
- DJIA ^DJI: 34,827.70 (489.83, 1.43%)
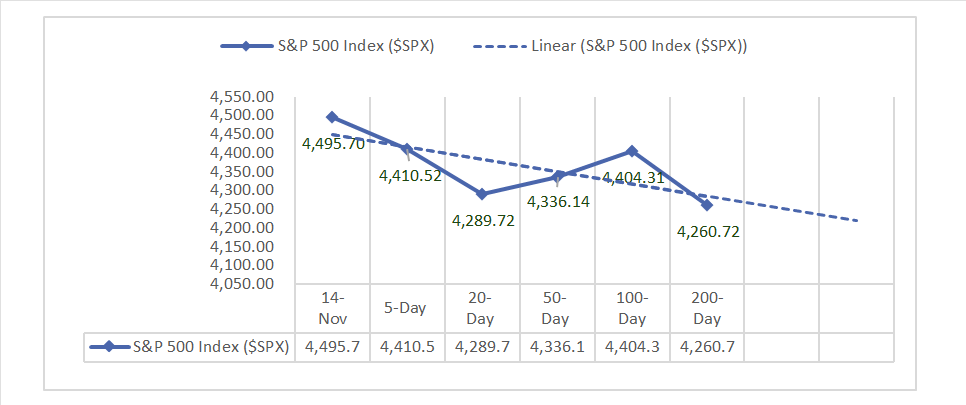
- S&P 500 ^GSPC: 4,495.70 (84.15, 1.91%)
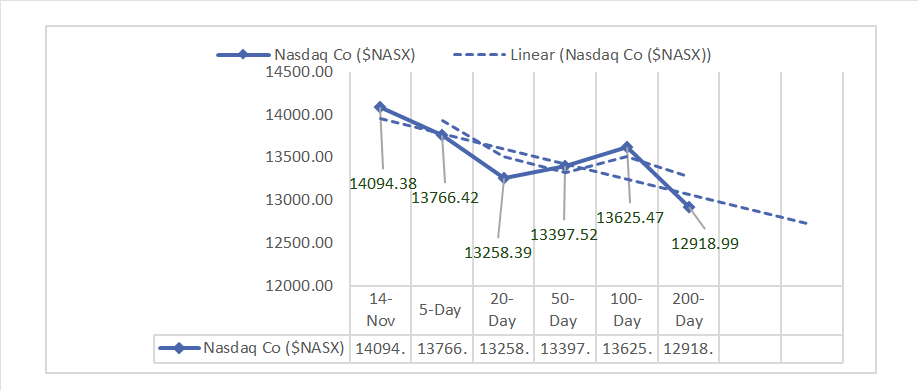
- Nasdaq Composite ^NASX: 14,094.38 (326.64, 2.37%)
- Nasdaq 100 ^NDX: 15,812.47 (329.69, 2.13%)
- NYSE Fang+ ^NYFANG: 8,174.19 (187.03, 2.34%)
- Russell 2000 ^RUT: 1,798.32 (92.82, 5.44%)
Market Insights: Performance, Sectors, and Trends:
- Economic Data: In October, NFIB Business Optimism Index held at 90.7. CPI recorded 0% monthly and 3.2% yearly, while Core-CPI showed 0.2% monthly and 4.0% yearly, slightly below consensus.
- Market Indices: Major indices closed with solid gains: DJIA at 34,827.70 (+1.43%), S&P 500 at 4,495.70 (+1.91%), Nasdaq Composite at 14,094.38 (+2.37%).
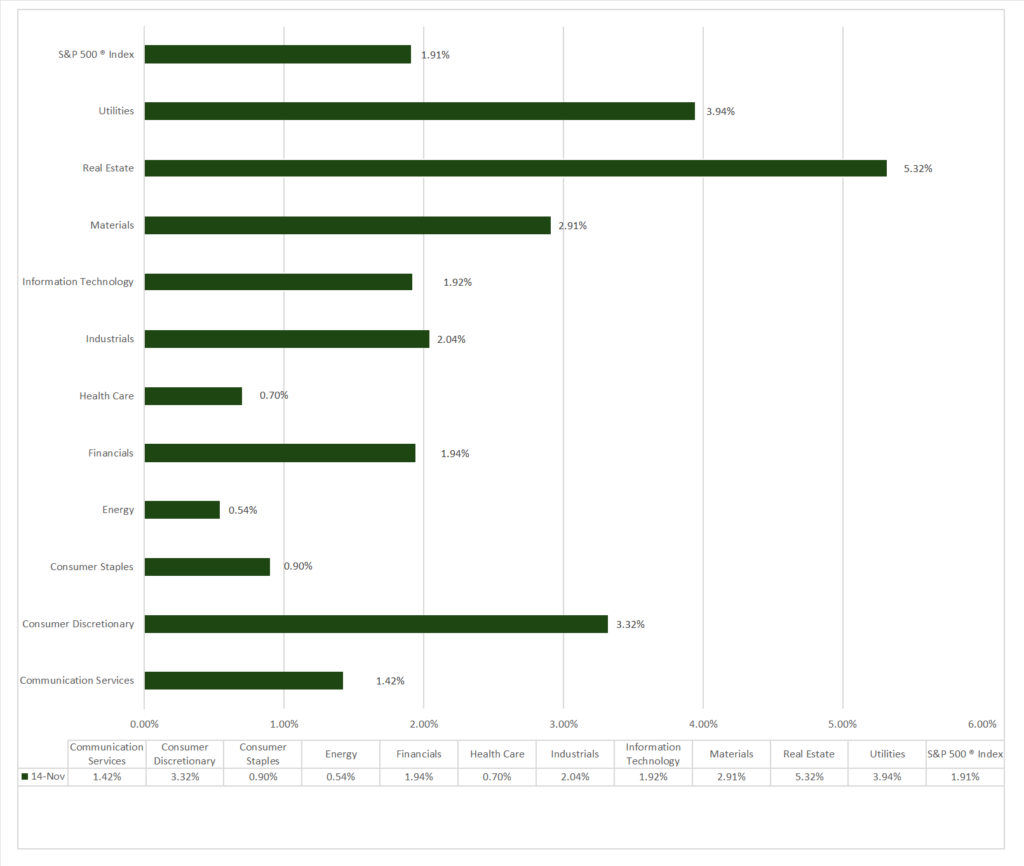
- Sector Performance: All 11 sectors were higher, with Real Estate (+5.32%) leading and Energy (-0.54%) lagging. Top industries: Office REITs (+11.35%)
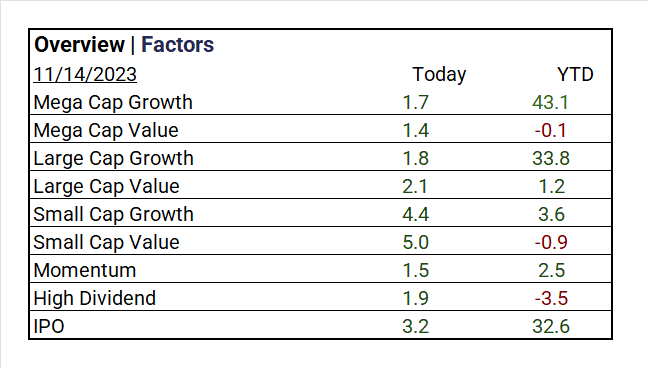
- Factors: Small Caps outperform.
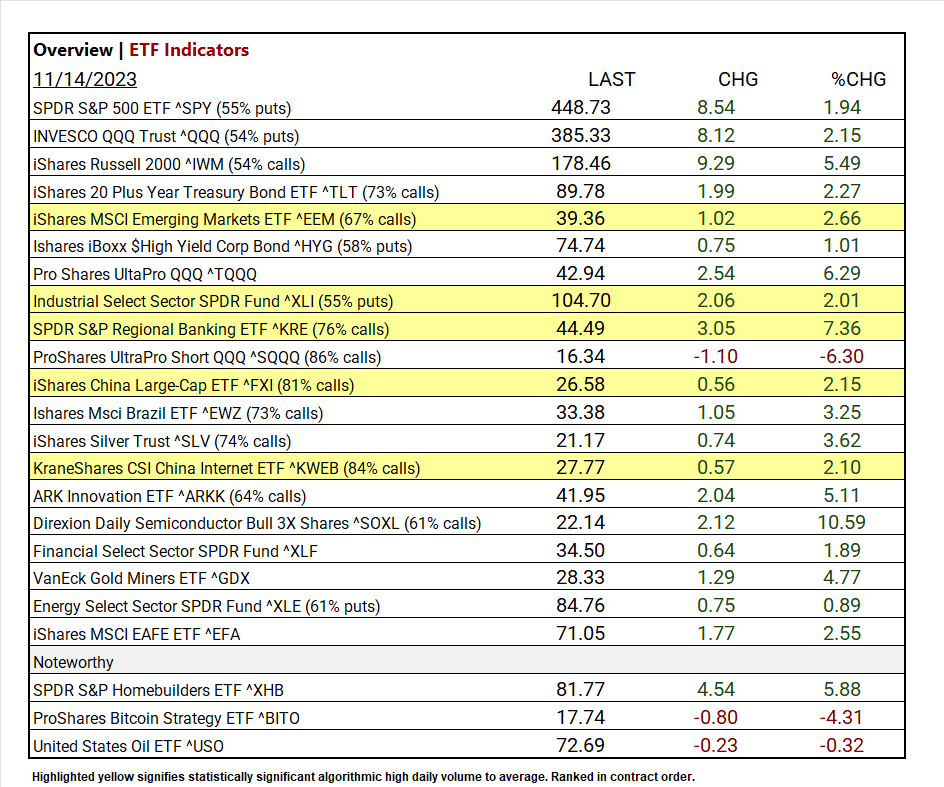
- Top ETF: Direxion Daily Semiconductor Bull 3X Shares ^SOXL +10.59%.
- Low ETF: ProShares UltraPro Short QQQ ^SQQQ -6.30%.
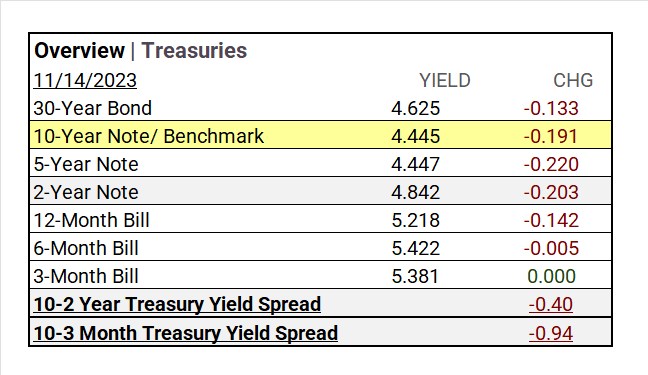
- Treasury Markets: Yields declined across the curve, the 10-Year Note to 4.445 (-0.191) and the 2-Year Note to 4.842 (-0.203). The 10-2 Year Treasury Yield Spread contracted -0.40.
- Currency and Volatility: The U.S. Dollar Index declined, CBOE Volatility fell 4.07%, and the Fear & Greed reading reflects Neutral.
- Commodity Markets: Gold futures and Bloomberg Commodity Index gained, Bitcoin and Crude Oil futures declined.
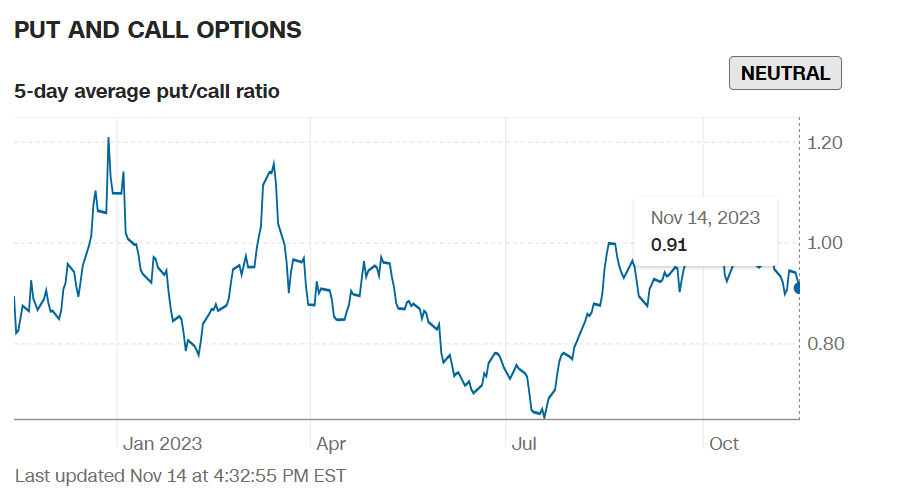
- Notable: Options market activity, SPDR S&P Homebuilders ETF ^XHB+ 5.88%, iShares 20 Plus Year Treasury Bond ETF ^TLT +7.42% in past 10 days.
Sectors:
- All 11 sectors were higher, with Real Estate (+5.32%) leading and Energy (-0.54%) lagging. Top industries: Office REITs (+11.35%), Independent Power and Renewable Electricity Producers (+9.01%), Industrial REITs (+6.68%), and Water Utilities (+6.53%).
Treasury Yields and Currency:
- Yields declined across the curve: the 30-Year Bond fell to 4.625 (-0.133), the 10-Year Note to 4.445 (-0.191), the 5-Year Note to 4.447 (-0.220), and the 2-Year Note to 4.842 (-0.203). Shorter-term bills also dropped, with the 12-Month Bill at 5.218 (-0.142), the 6-Month Bill at 5.422 (-0.005), and the 3-Month Bill at 5.381. Additionally, the 10-2 Year Treasury Yield Spread contracted by -0.40, and the 10-3 Month Treasury Yield Spread narrowed by -0.94.
- Treas Yld Index-10 Yr Nts ^TNX: 4.44 (-0.19, -4.12%)
- The U.S. Dollar Index ^DXY: 104.06 (-1.57, -1.49%)
Market Volatility and Sentiment:
- CBOE Volatility ^VIX: 14.16 (-0.60, -4.07%)
- Fear & Greed Index (TY/LY): 47/62 (Neutral/ Greed).
source: CNN Fear and Greed Index
Commodities:
- Gold Futures: 1,962.63 (+16.11, +0.83%)
- Bitcoin USD: 35,597.00 (-876.80, -2.40%)
- Crude Oil Futures WTI: 78.09 (-0.17, -0.22%)
- Bloomberg Commodity Index: 103.39 (+0.27, +0.26%)
Factors:
- Small Caps outperform; Small Cap Value +5.0%, Small Cap Growth 4.4%.
ETF Performance:
Top 3 Best Performers:
- Direxion Daily Semiconductor Bull 3X Shares ^SOXL +10.59%
- SPDR S&P Regional Banking ETF ^KRE +7.36%
- Pro Shares UltaPro QQQ ^TQQQ +6.29%
Top 3 Lowest Performers:
- ProShares UltraPro Short QQQ ^SQQQ -6.30%
- Energy Select Sector SPDR Fund ^XLE +0.89%
- Ishares iBoxx $High Yield Corp Bond ^HYG +1.01%
US Major Economic Data
- NFIB Business Optimism Index for Oct: 90.7 (previous: 90.8)
- CPI: 0%/3.2% m.m/y.y (consensus: 0.1%/3.3%, previous: 0.4%/3.7%)
- Core-CPI: 0.2%/4.0% m.m/y.y (consensus: 0.3%/4.1%, previous: 0.3%/4.1%)
Earnings:
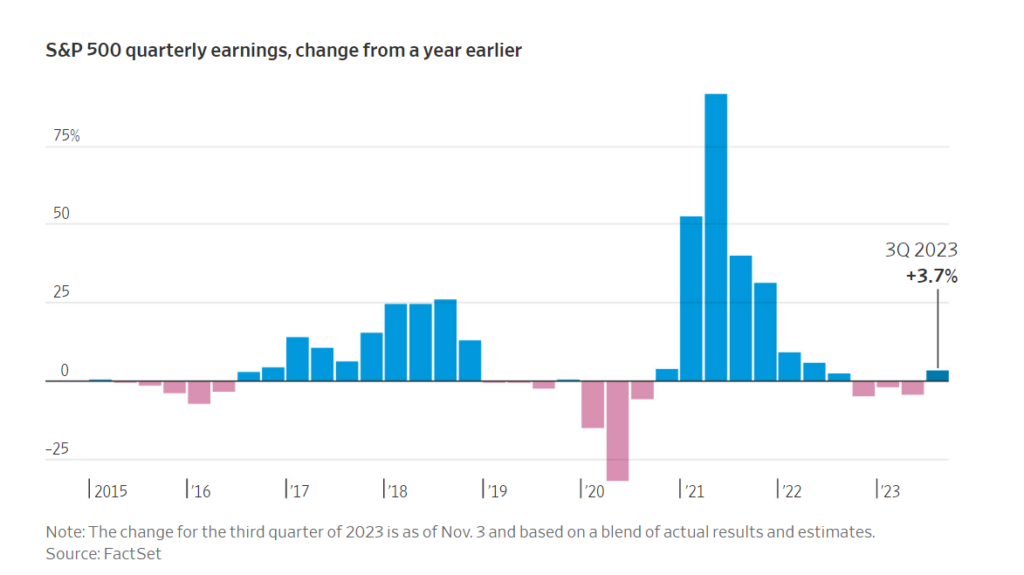
- Q3 Forecast: 116 companies in the index have issued EPS guidance for Q3 2023, Of these 116 companies, 74 have issued negative EPS guidance and 42 have issued positive EPS guidance. The percentage of S&P 500 companies issuing negative EPS guidance for Q3 2023 is 64% (74 out of 116), which is above the 5-year average of 59% but equal to the 10-year average of 64%. Eight of the eleven sectors are expected to see year-over-year earnings growth, with Communication Services and Consumer Discretionary leading the way. Conversely, three sectors, mainly Energy and Materials, are expected to experience earnings declines.
Notable Earnings Today:
- BEAT: Home Depot (HD), Mitsubishi UFJ Financial ADR (MUFG), Sumitomo Mitsui Financial ADR (SMFG), Johnson Controls (JCI), Terumo ADR (TRUMY), Vipshop (VIPS), Aramark Holdings (ARMK), CAE Inc. (CAE), Camtek (CAMT), Energizer (ENR).
- MISSED: Nu Holdings (NU), Alcon (ALC), Sea (SE), Tencent Music Entertainment Group (TME), Cosan ADR (CSAN), Getty Images Holdings (GETY).
Resources:
News
Investment and Growth News
- Mitsubishi Heavy Backs Battery-Management Startup Element Energy – Bloomberg – Bloomberg
- Early OpenAI Investor Khosla Ventures Closes In on $3 Billion for Venture Funds – WSJ
- Walgreens Wants the Corner Drugstore to Be an Online Delivery Hub – WSJ
Infrastructure and Energy
- Exxon Aims to Produce Lithium in Rare Foray From Fossil Fuel – Bloomberg
- Alaska Judge Sides With ConocoPhillips on New $7.5 Billion Oil Project – Bloomberg
Real Estate
- How Real-Estate Brokers Are Reacting to the Historic Commission Verdict – WSJ
- Germany Warns More Commercial Real Estate Pain Ahead – Bloomberg
Central Banking and Monetary Policy
- Cooling Inflation Likely Ends Fed Rate Hikes – WSJ
- Fed Officials Tout Inflation Progress, Still See Long Way to Go – Bloomberg
- Charting the Global Economy: Fed, BOE Leave Rates Unchanged – Bloomberg
International Market Analysis (China)
China’s economic recovery uneven in October as property downturn continues, but retail sales rise – SCMP