Stay Informed and Stay Ahead: Guidance, September 3rd, 2024
Election Years: S&P 500 Declines More Frequently and Sharply in September
September has earned a reputation as a challenging month for U.S. stock markets, particularly during election years. Statistically, the S&P 500 has posted average declines of 0.7% in September since 1928. In election years, this drop becomes even more pronounced, with the index falling in 60% of Septembers. This seasonal weakness is often attributed to investor uncertainty and risk aversion leading up to elections.
Market Turbulence in Election Years: A Historical Perspective
Historical data reveals that the 2008 election year saw a steep 9% decline in the S&P 500 during September, driven by both the global financial crisis and uncertainty around the incoming administration’s policies. Similarly, in 2016, the index fell by 0.1%, reflecting concerns over potential shifts in trade, healthcare, and regulatory policies.
Beyond index performance, market volatility tends to increase during election years. The VIX, a measure of market volatility, often spikes in September of these years. Historically, the VIX has been 10-15% higher in these Septembers compared to non-election years, reflecting heightened market sensitivity to political developments.
Historical Patterns and Market Impact
S&P 500 Index Performance
- Election Years: The S&P 500 typically experiences a steeper average decline in September, with the index falling in 60% of Septembers.
- Non-Election Years: The decline is less pronounced, reflecting lower uncertainty.
- Historical Average (1928-2023): September tends to be weak overall, with an average decline of 0.7%.
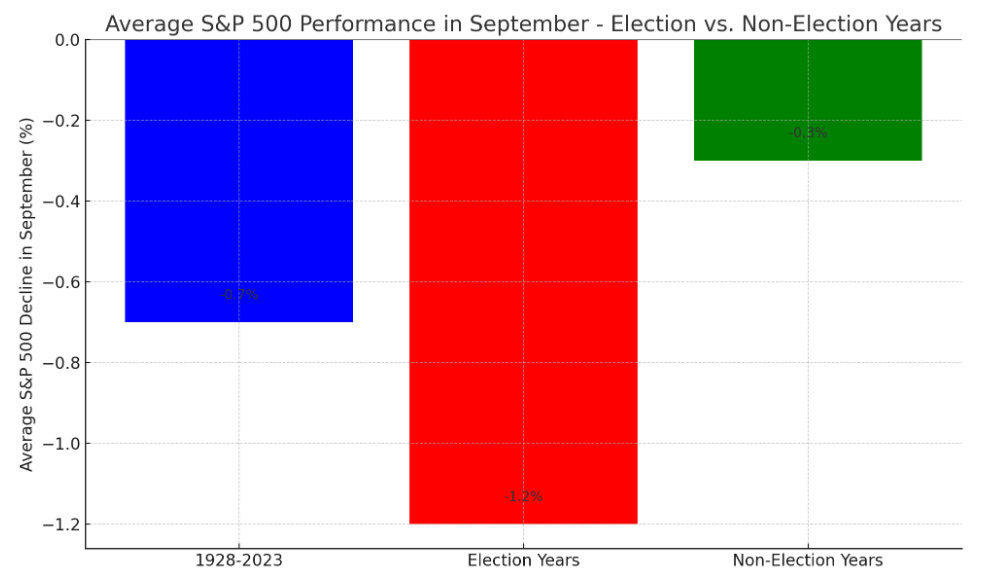
The bar chart that illustrates the average S&P 500 performance in September, comparing election years and non-election years with historical averages from 1928 to 2023.
The VIX index gauges market volatility and investor sentiment.
- 10-15% Increase in Election Years: The VIX typically spikes 10-15% higher during September of election years compared to non-election years, indicating increased market volatility.
- Election-Year Sensitivity: The chart shows significant volatility spikes during key election years, such as 2008, 2016, and 2020, reflecting investor uncertainty and risk aversion.
- Historical Trend: The VIX chart underscores a consistent pattern of elevated market sensitivity during election periods, helping investors anticipate potential volatility.
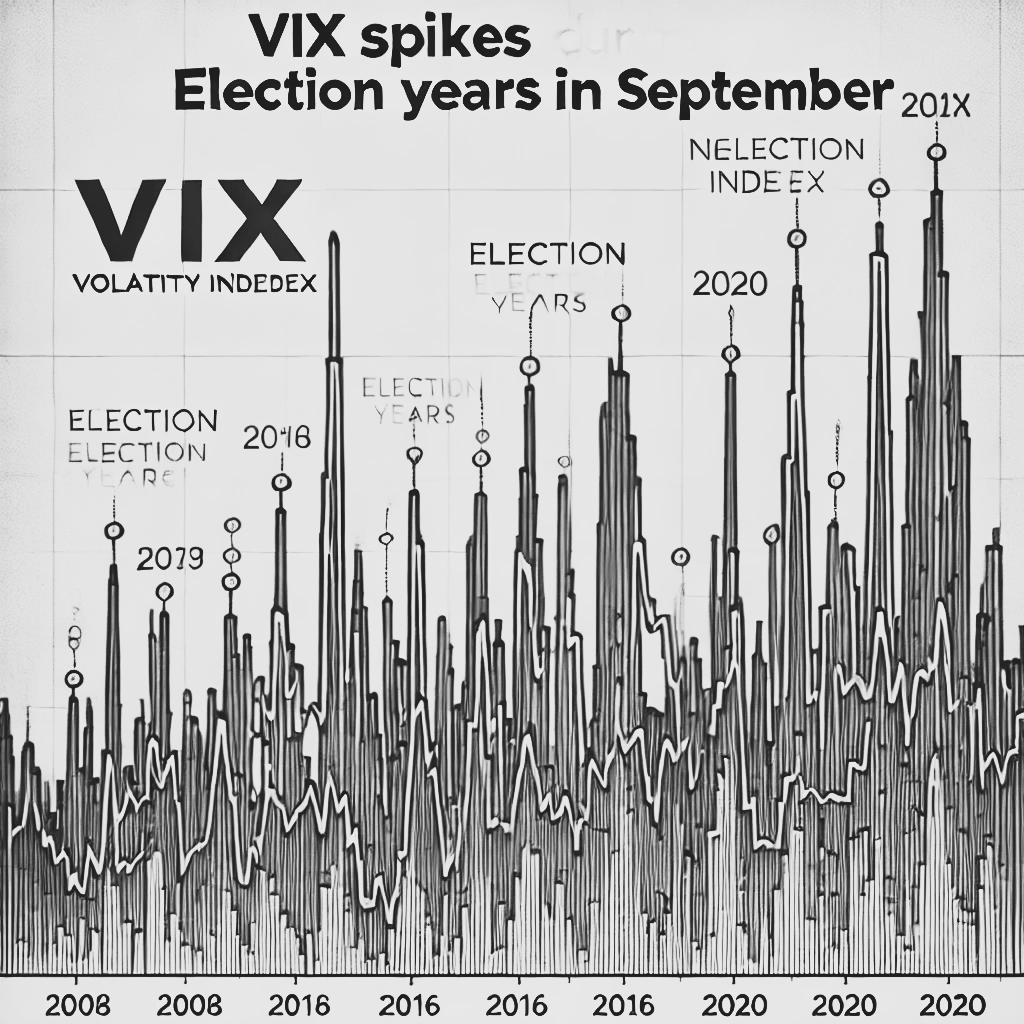
The VIX has a 10-15% increase in the VIX during September of election years compared to non-election years.
Long-Term Opportunity
While election years often bring short-term market volatility, they also present strategic investment opportunities. Historically, markets tend to recover and perform well over the long term once the uncertainty surrounding elections subsides. Investors who can navigate the volatility and focus on strong fundamentals may find attractive entry points during market dips.
Additionally, sectors directly impacted by policy changes—such as healthcare, energy, and technology—can offer significant growth potential depending on the election outcome. By staying informed and maintaining a long-term perspective, investors can capitalize on these opportunities to build a resilient and diversified portfolio.
Conclusion
Election years have historically contributed to increased market volatility and sharper declines in September. However, this volatility also creates opportunities for investors who remain focused on long-term growth. By staying informed and strategically navigating the uncertainty, investors can position themselves to capitalize on market shifts and potential sector-specific gains, ultimately leading to a more resilient portfolio.