101 SERIES
The yield curve is a plot of the interest rate yields on debt instruments of different maturities, holding risk, liquidity and tax treatment constant. Research over the last decade has uncovered predictive relationships between the slope of the yield curve and subsequent real activity and inflation.
The U.S. Treasury yield curve compares the yields of short-term Treasury bills with long-term Treasury notes and bonds. Yield curves differ primarily based on their underlying type of yield i.e. treasury yield, corporate bond yield, etc. There are four classifications of yield curves depending on their shape: the normal yield curve, the steep yield curve, the flat yield curve, and the inverted yield curve.
Factors That Affect the Yield Curve
They include the outlook for inflation, economic growth, and supply and demand. Slower growth, low inflation, and depressed risk appetites often help the price performance of long-term bonds. They cause yields to fall.
The yield curve as an indicator for recession
The slope of the Treasury yield curve is an accurate recession predictor with a reliable track record.
The yield curve often shows that longer maturities pay higher interest rates
If you chart-out interest rates against term to maturity (such as 1 year or 10 years), the result is called the yield curve. It normally slopes upward, indicating that longer maturities pay higher interest rates.
Three main shapes of yield curve shapes
There are three main shapes of yield curve shapes: normal (upward sloping curve), inverted (downward sloping curve), and flat.
July 2022 as the yield curve is inverted right now
The two- to 10-year segment of the yield curve inverted in late March for the first time since 2019 and again in June. FACT: The U.S. curve has inverted before each recession since 1955, with a recession following between six and 24 months.
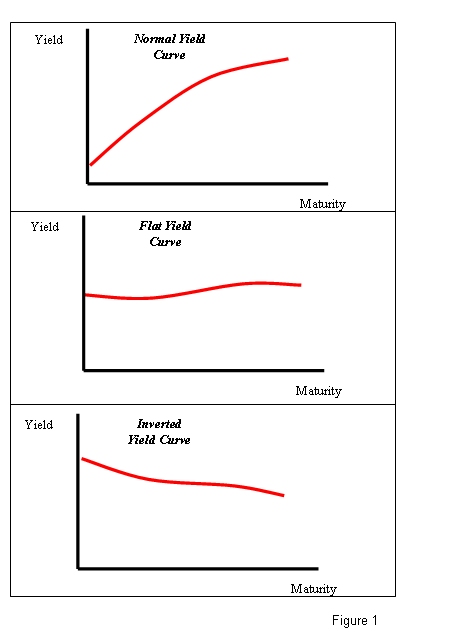
The normal yield curve is a yield curve in which short-term debt instruments have a lower yield than long-term debt instruments of the same credit quality. This gives the yield curve an upward slope. This is the most often seen yield curve shape, and it’s sometimes referred to as the “positive yield curve.”

