TECHNICAL ANALYSIS (by Intraday Dynamics)
Major Indices Week of November 29, 2024
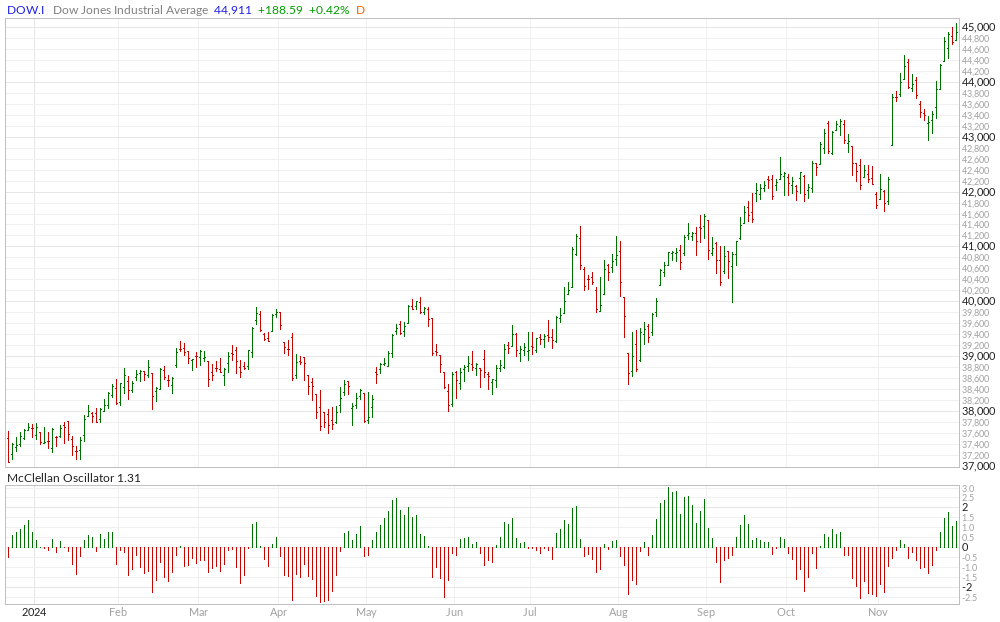
 Dow Jones Industrial Average Weekly Candles
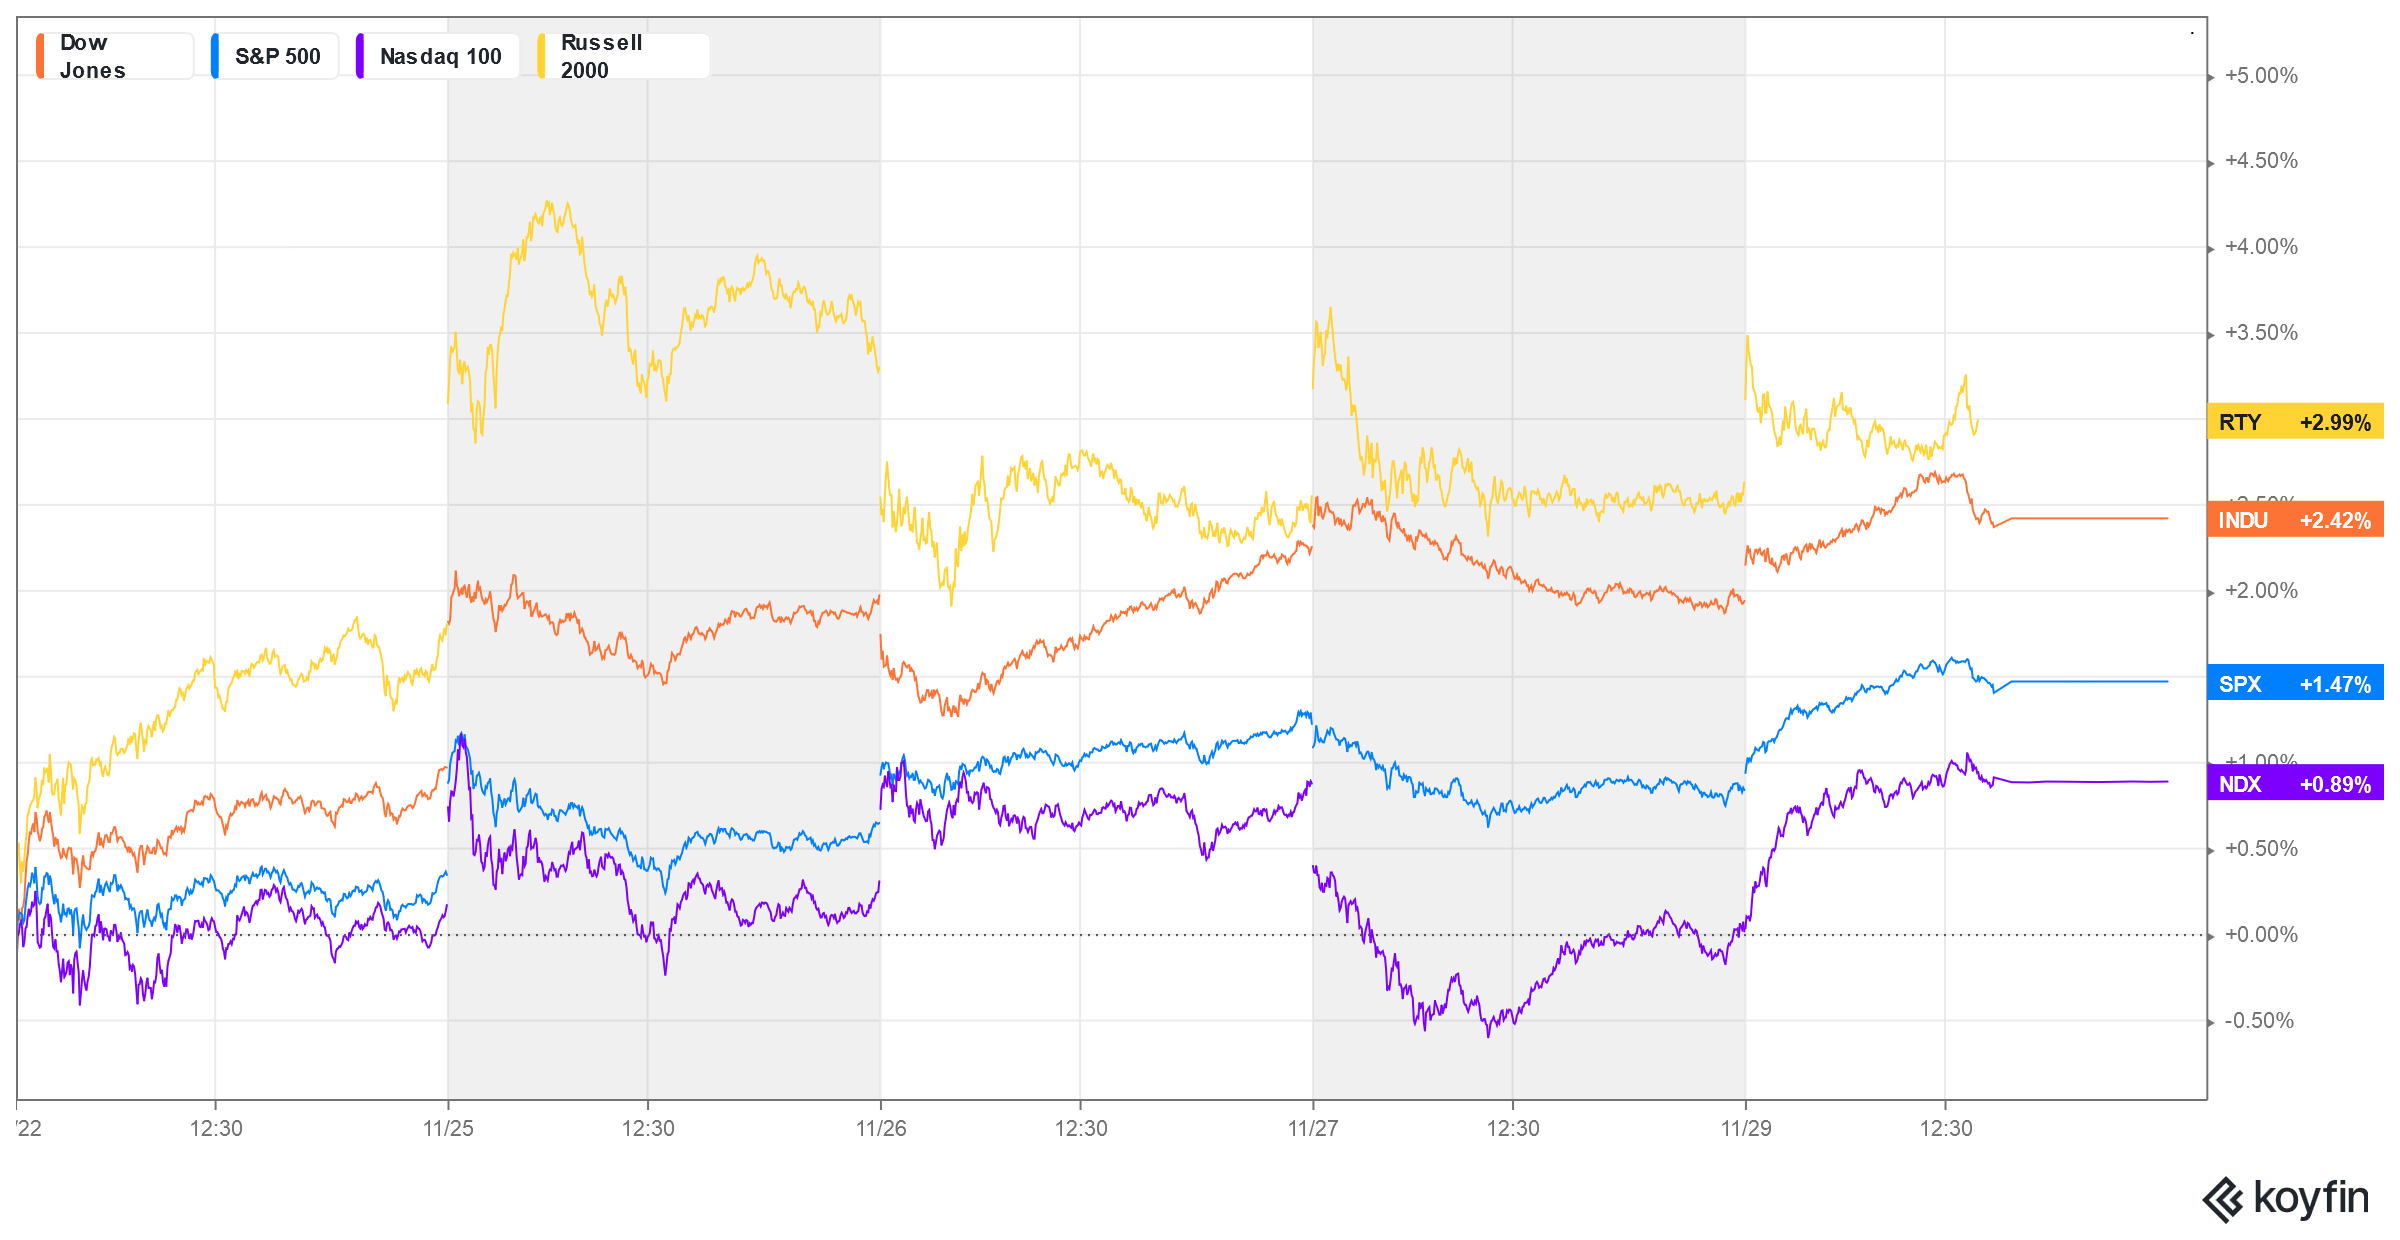
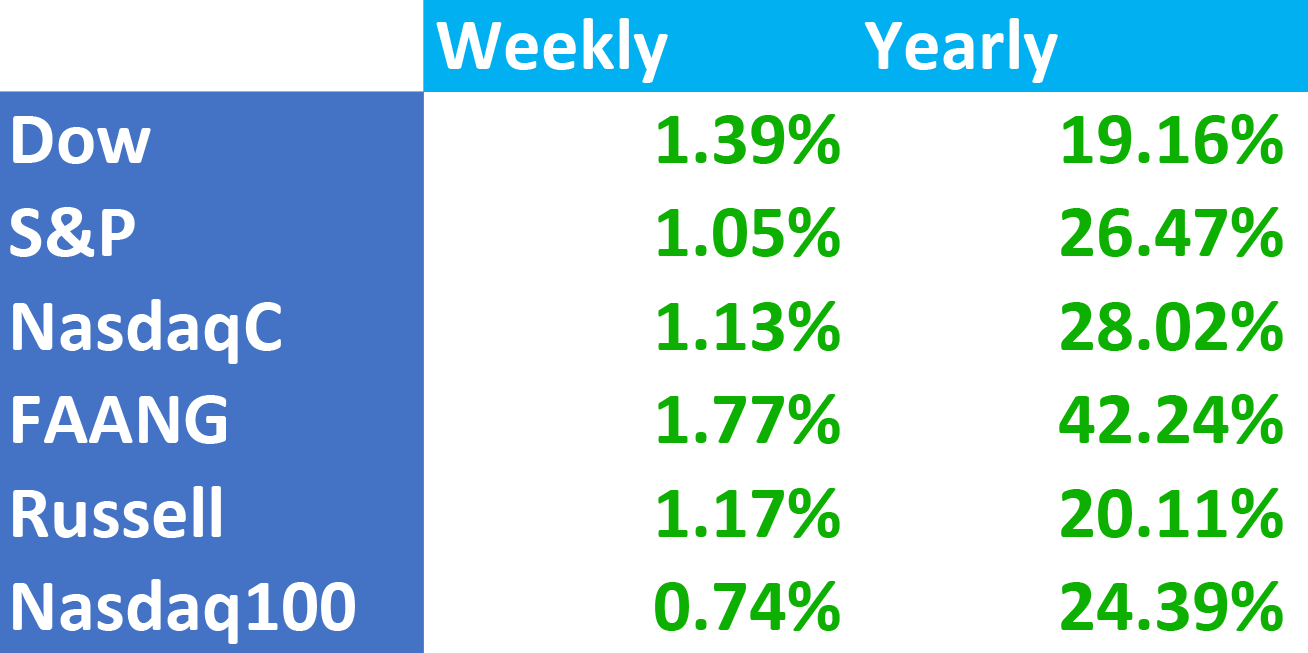
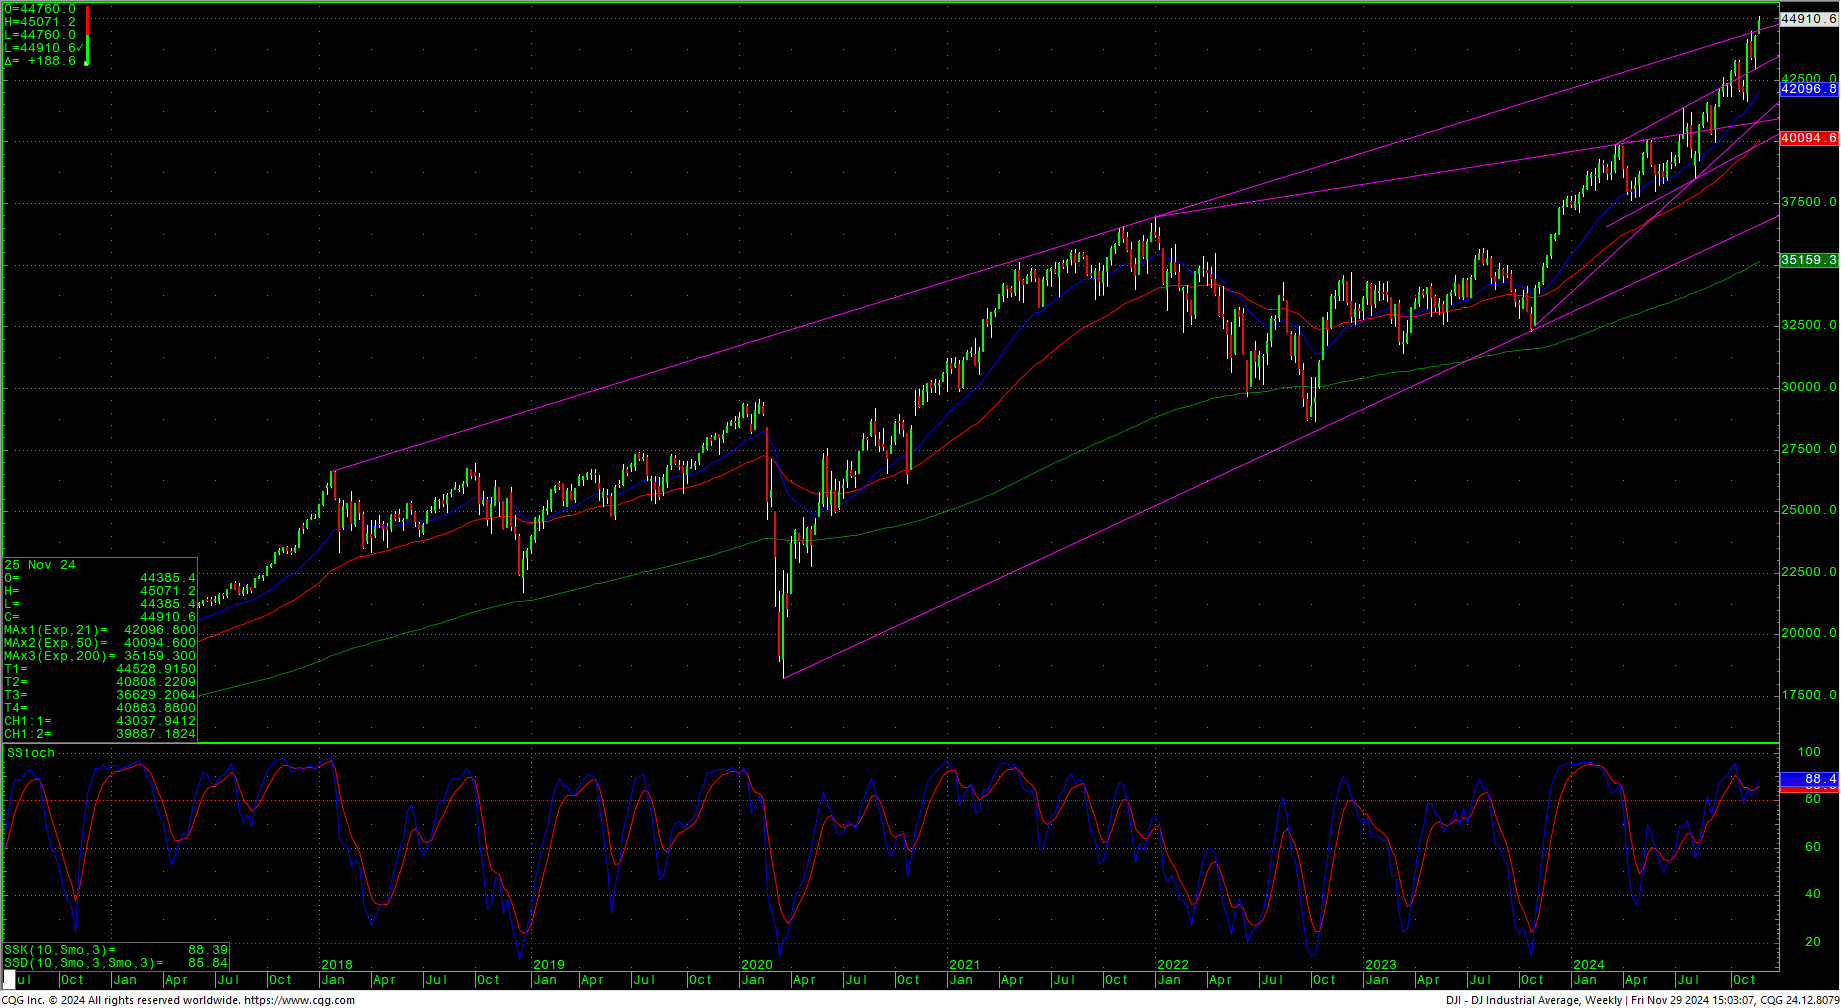 In a quiet holiday week, stocks continued the saccharine-induced rush to new highs. Prices finished out a robust November on the highs of the month with almost all major indexes setting record highs, including the Russell (with the weekly close basically tying the record set 1 November 2021). Gains were strong across the board with the FANG leading the charge, while it still sits just under the high set two weeks ago. Breadth is still better than the past two weeks. Price and time remain bullish in the short-term. The Dow took out the overhead channel line and closed over that key technical area.
The S&P was higher all week as it closed above the 6000 level. The weekly remains overbought with some preliminary bearish divergences, while the daily is in a large ascending wedge. The daily stochastics have hooked higher and has a preliminary bearish divergence. The index is up +26.47% on the year. Going back to 1990, only 3 years had better start: 1995, 1997, and 2013.
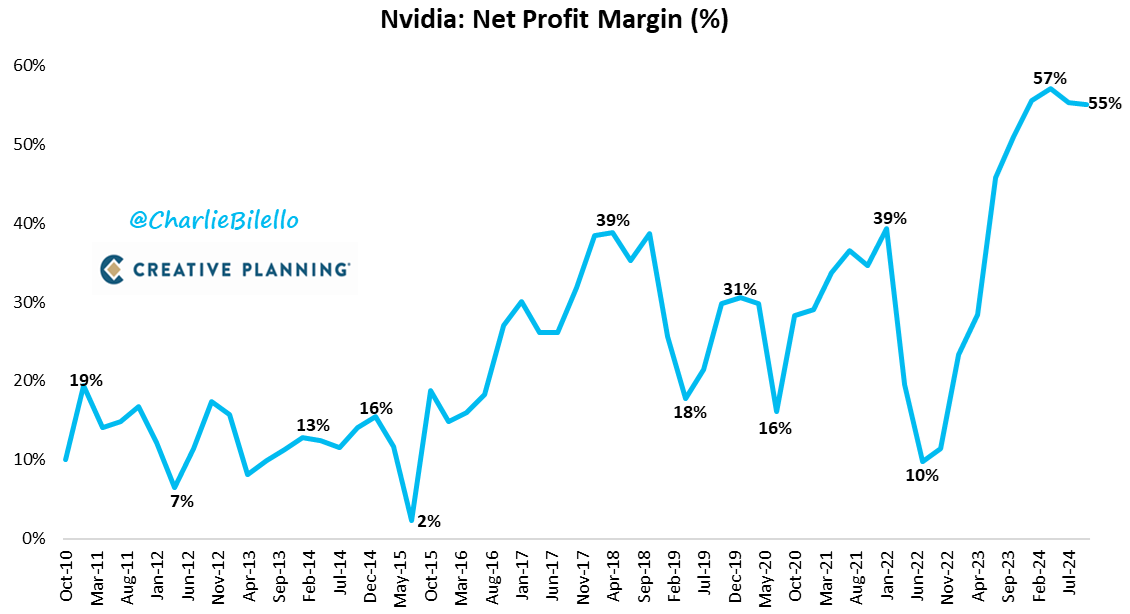
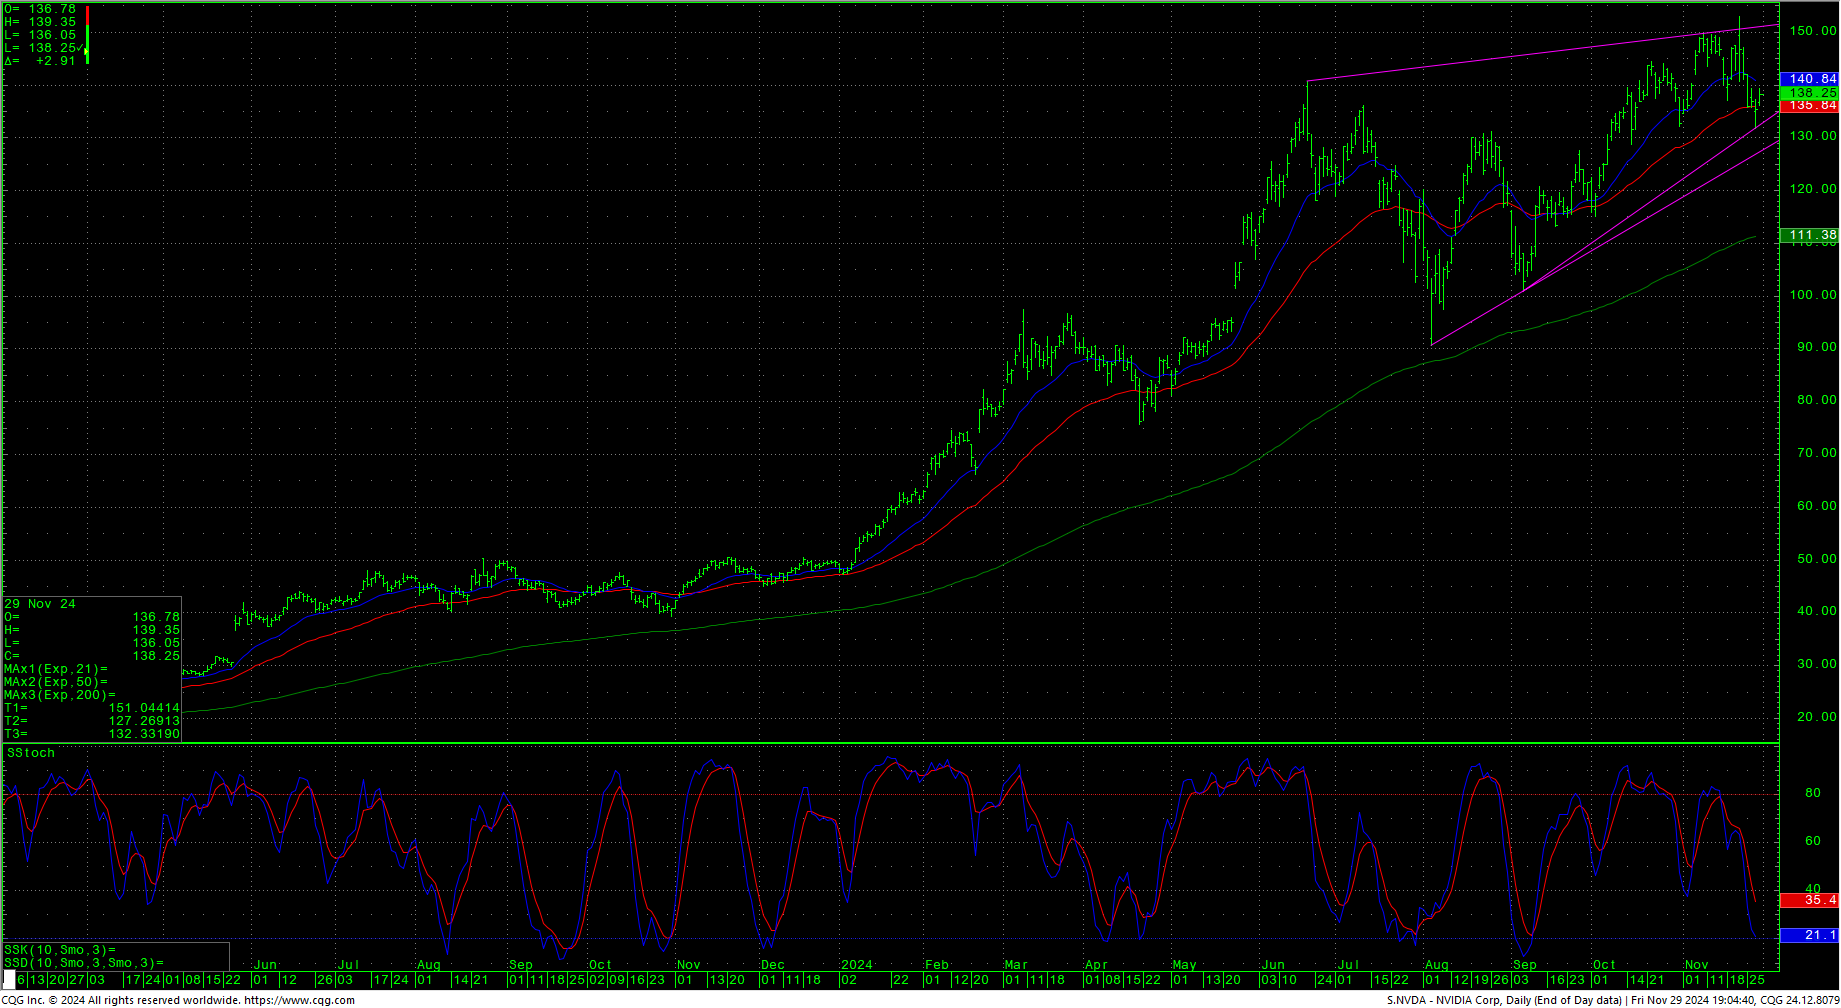
NVDA took out the 50-day MA midweek but recovered on Friday. The daily is down with the weekly overbought. Like the S&P and the FANG, NVDA is in a large ascending wedge. As Charlie Bilello points out: “Their new Blackwell chips are ‘estimated to cost around $30,000 each, meaning a cluster of 100,000 would cost $3 billion.’”
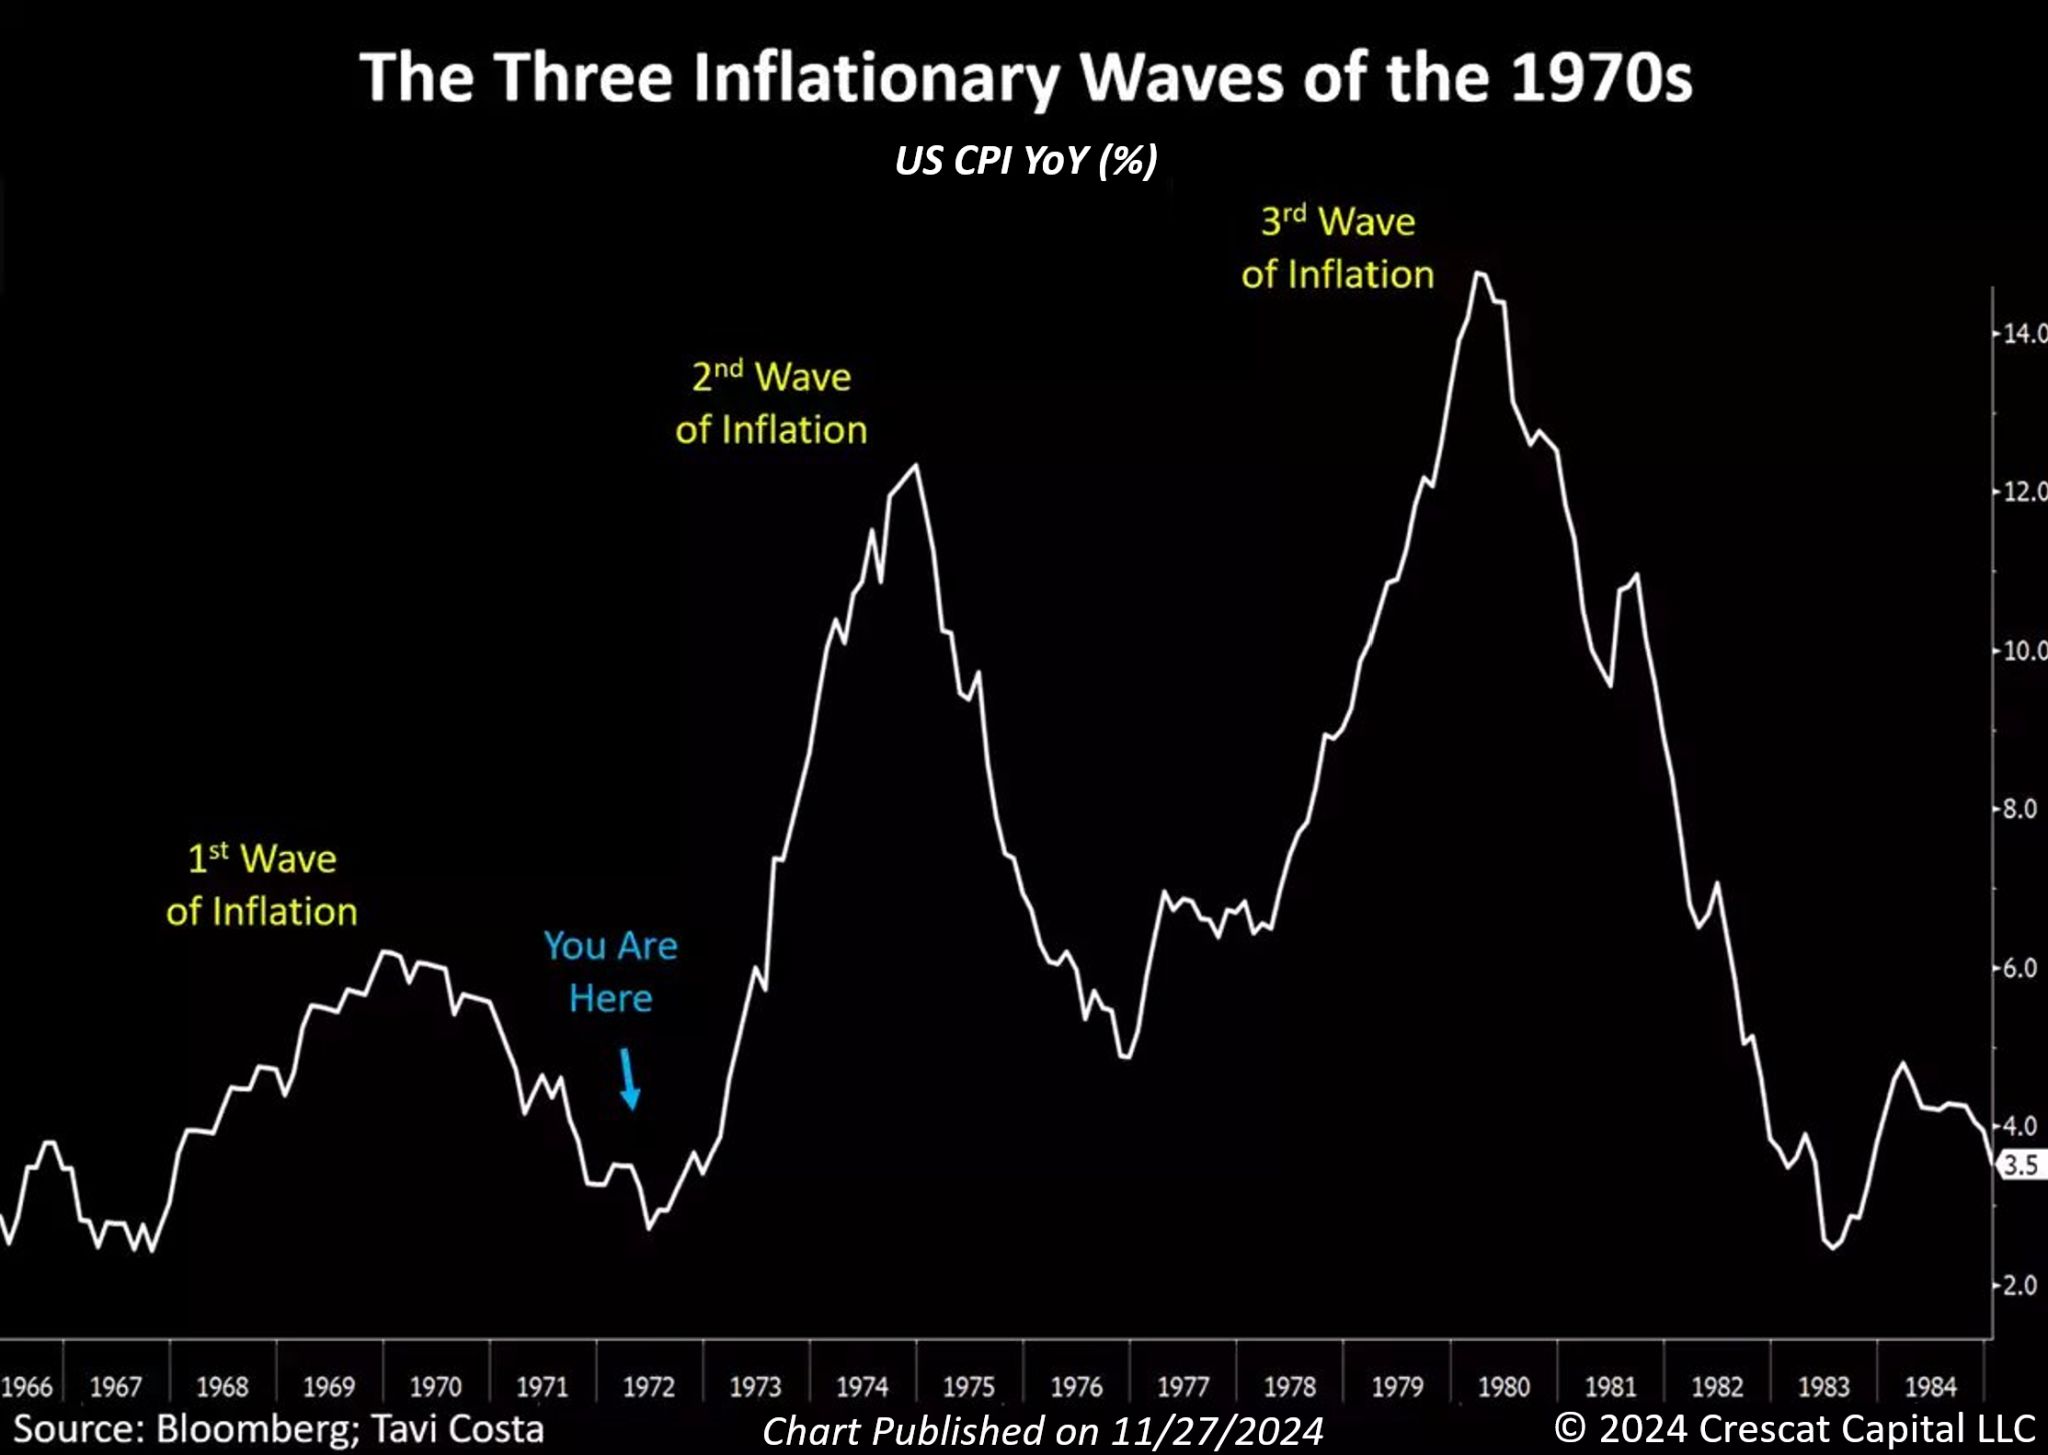
 With “tariff talk” dominating the news, people are dragging out the chart of the last inflationary period, although comparisons are based on widely different circumstances…one of which is the $36 trillion in government debt, the $1 trillion annual interest payment and the $1.16 trillion in consumer debt, the last one being the one that could really be significant.
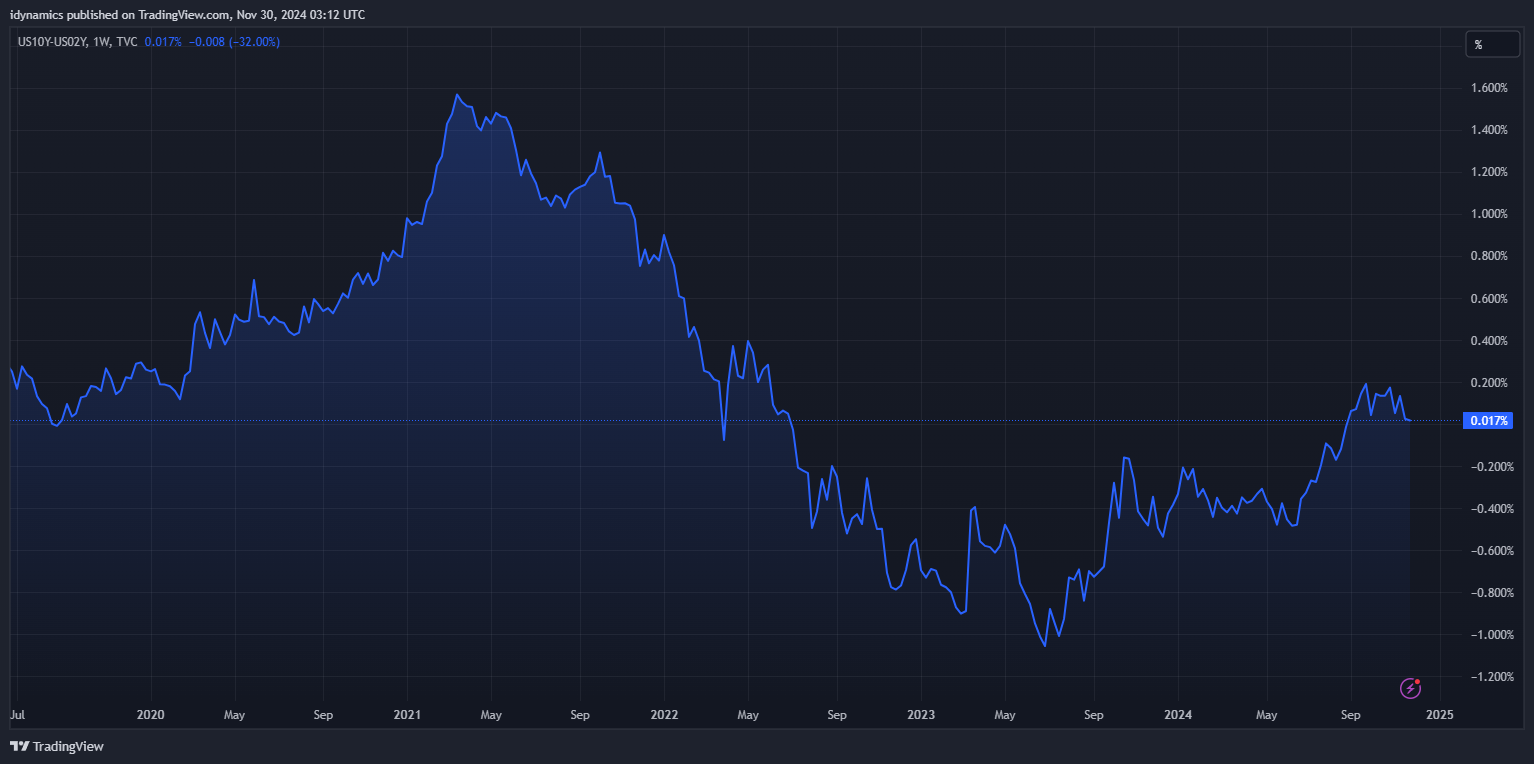
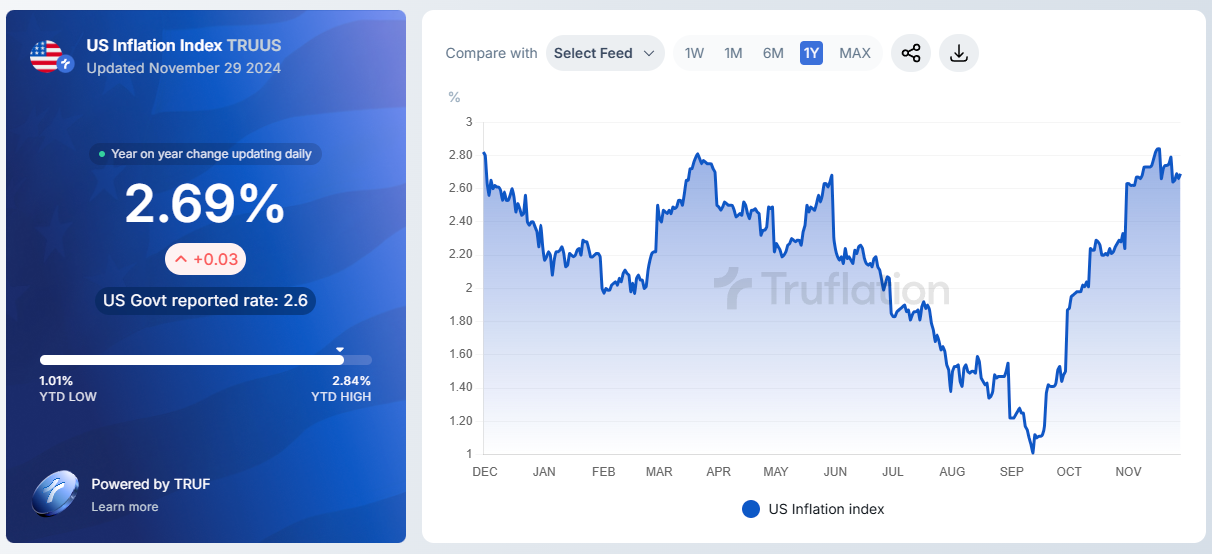
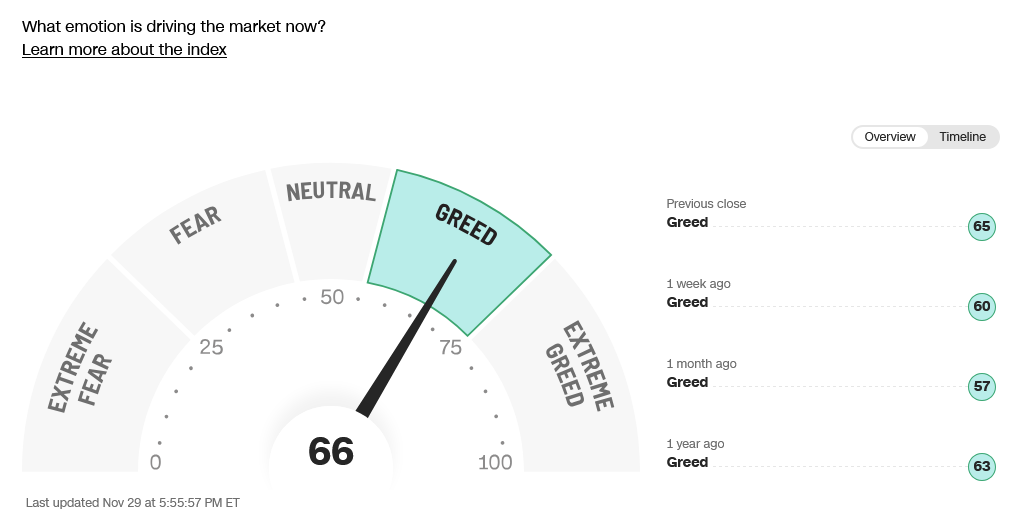
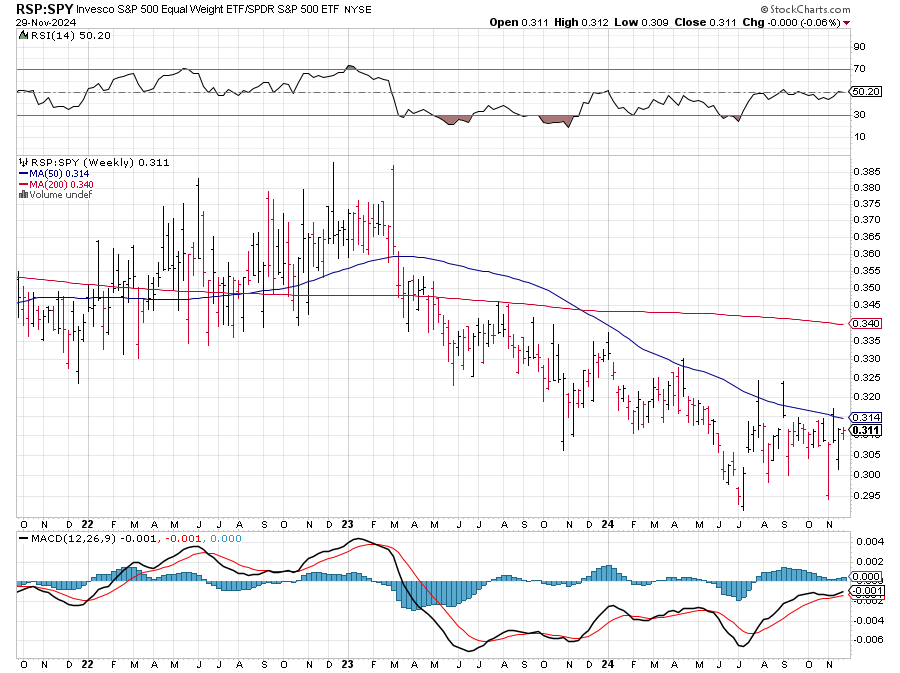
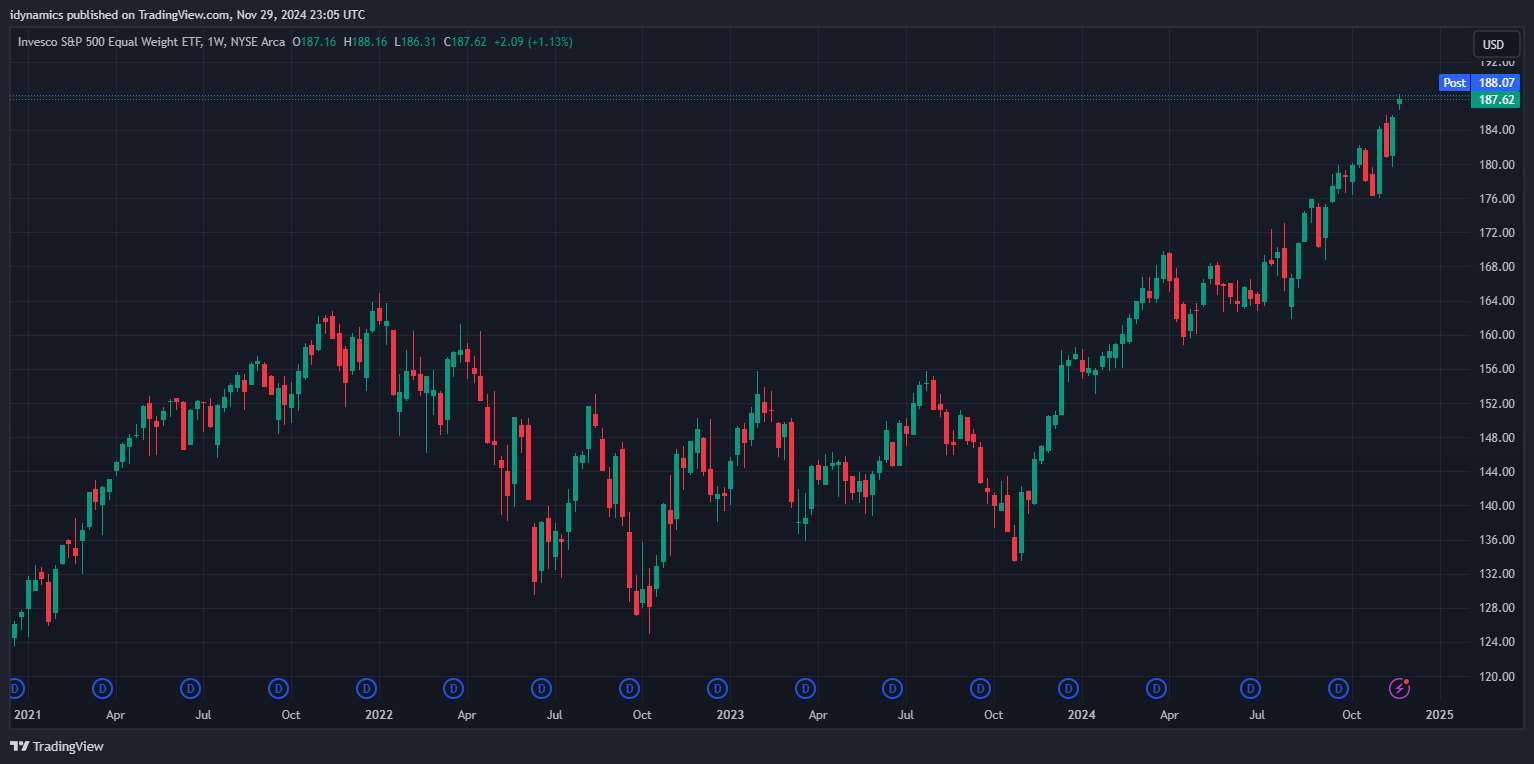
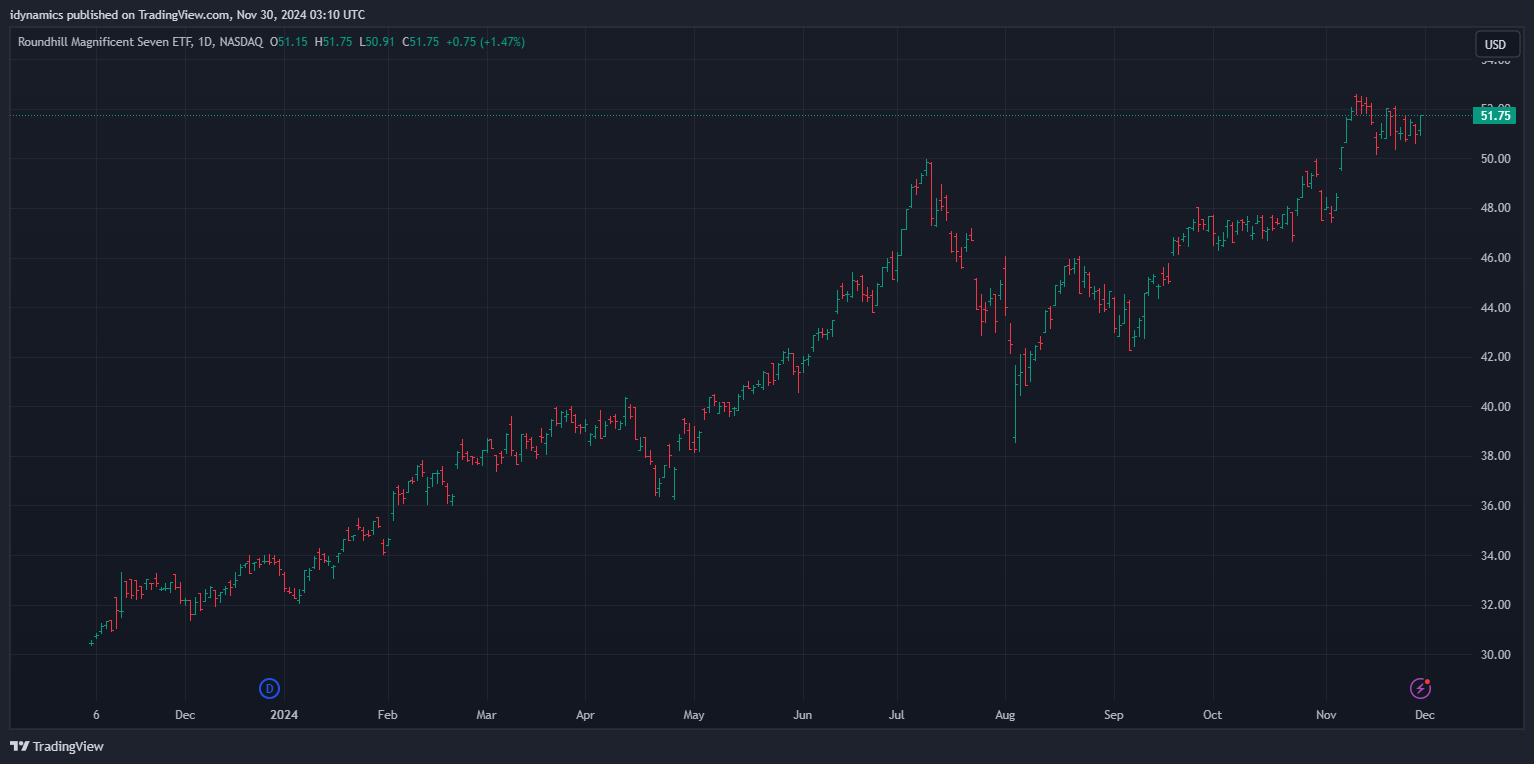
 The RSP:SPY stays stuck in a perpetual flat and sideways value since August of this year, even with the record highs in the RSP. Bonds rallied throughout the week, bringing yields down. The MAG7 traded another inside range on the week as the daily builds a flag following the gap on that chart. McClellan Oscillators are validating the upside action. Sentiment remains mixed with most indicators now neutral to greed. Truflation continues to settle toward the 2024 summer tops. The yield curve is still, barely, positive, hanging just over 0.00% at 0.017%.
10YR-2YR Yield Curve Weekly
 VIX Weekly H-L-C
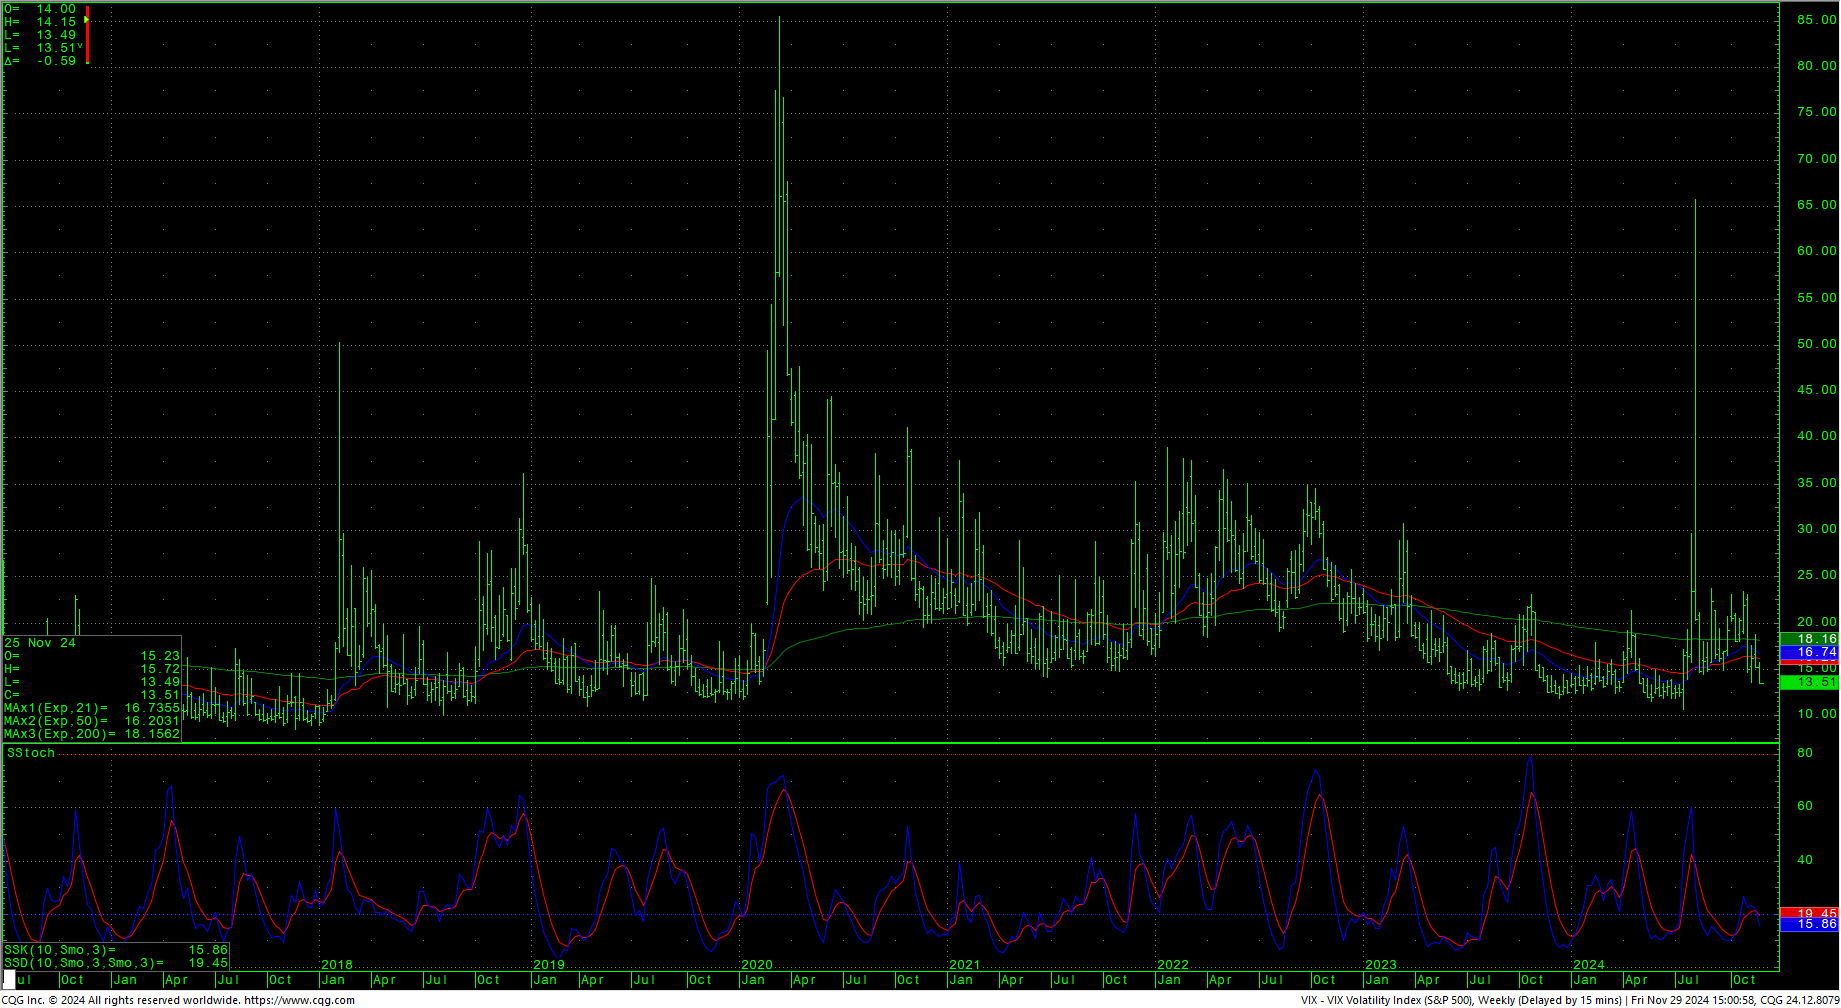
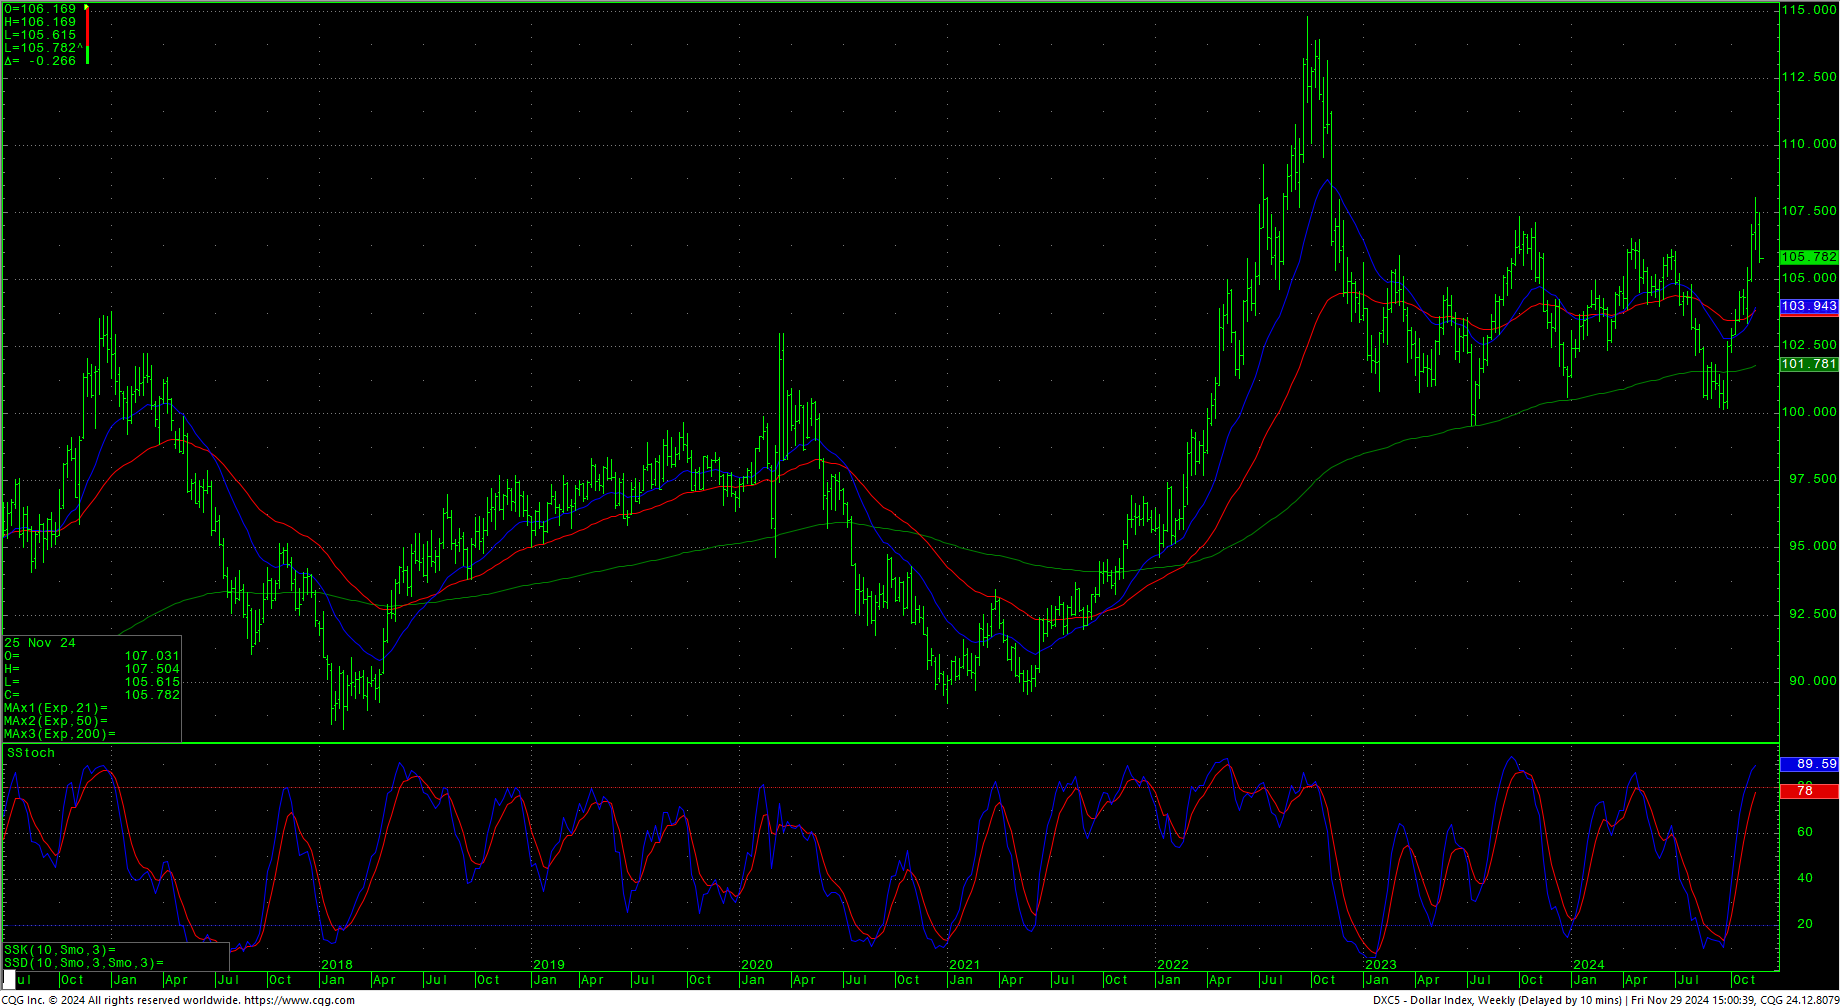
The VIX dropped and set the lowest weekly close since 16 July 2024. The US Dollar sold off sharply from the previous week’s rally that carried it to the highest daily close since 21 November 2022.
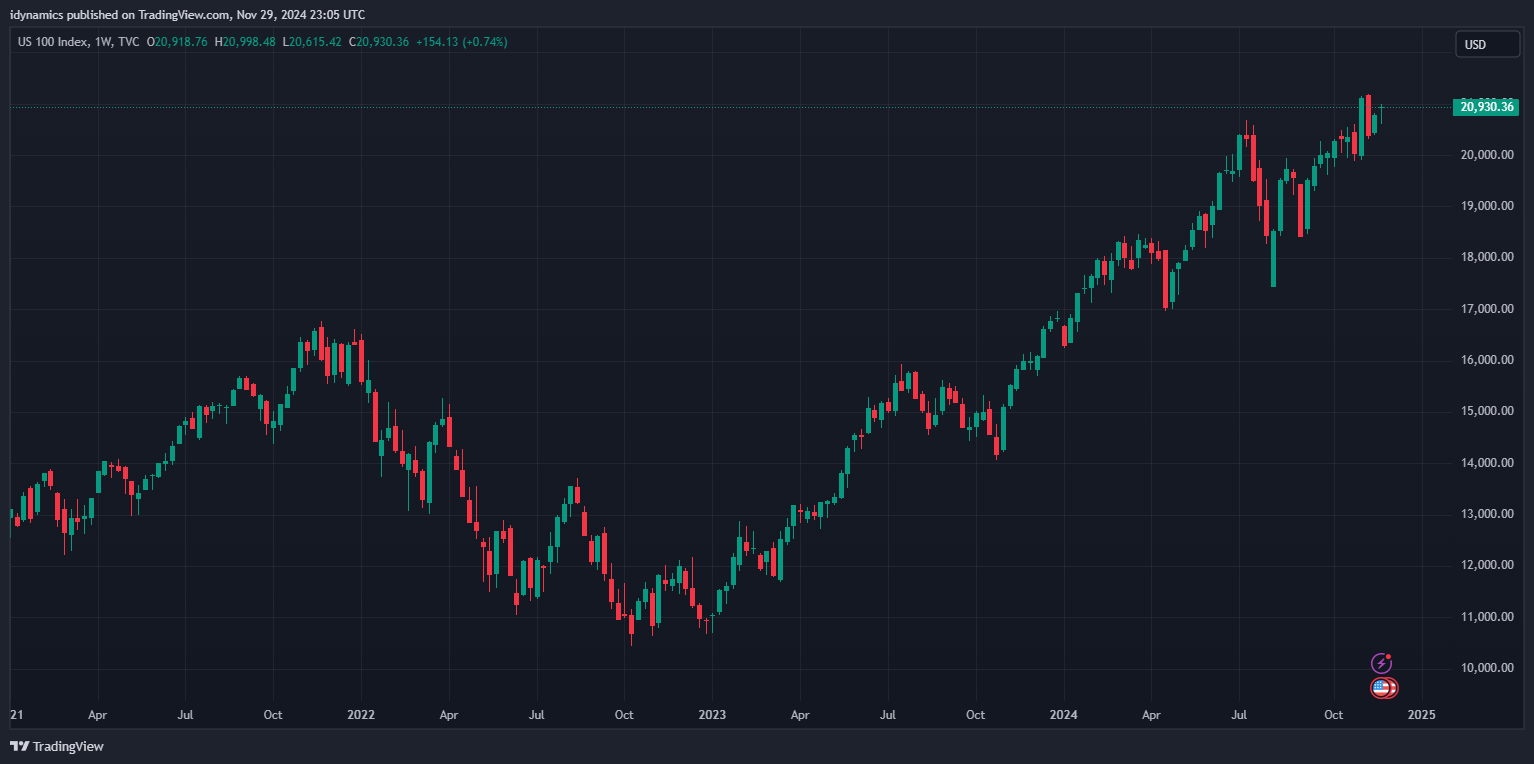
 Nasdaq 100 Weekly Candles
 52-Week A/D Line
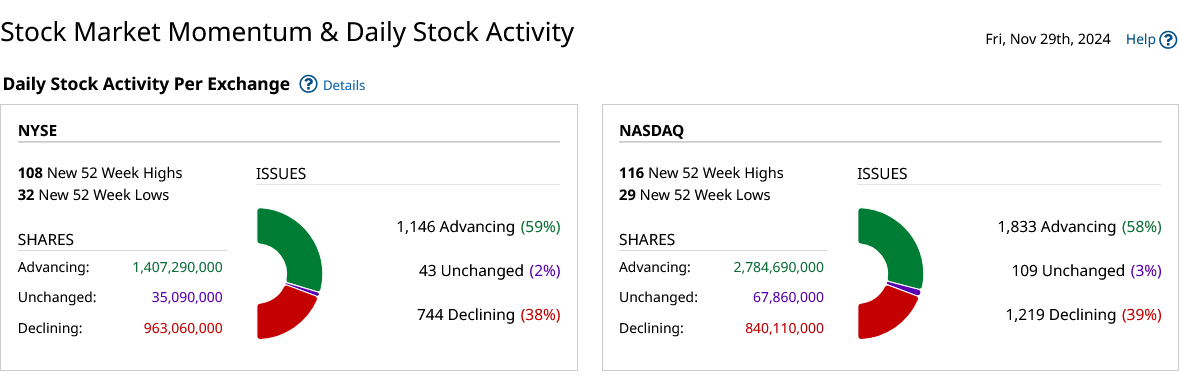
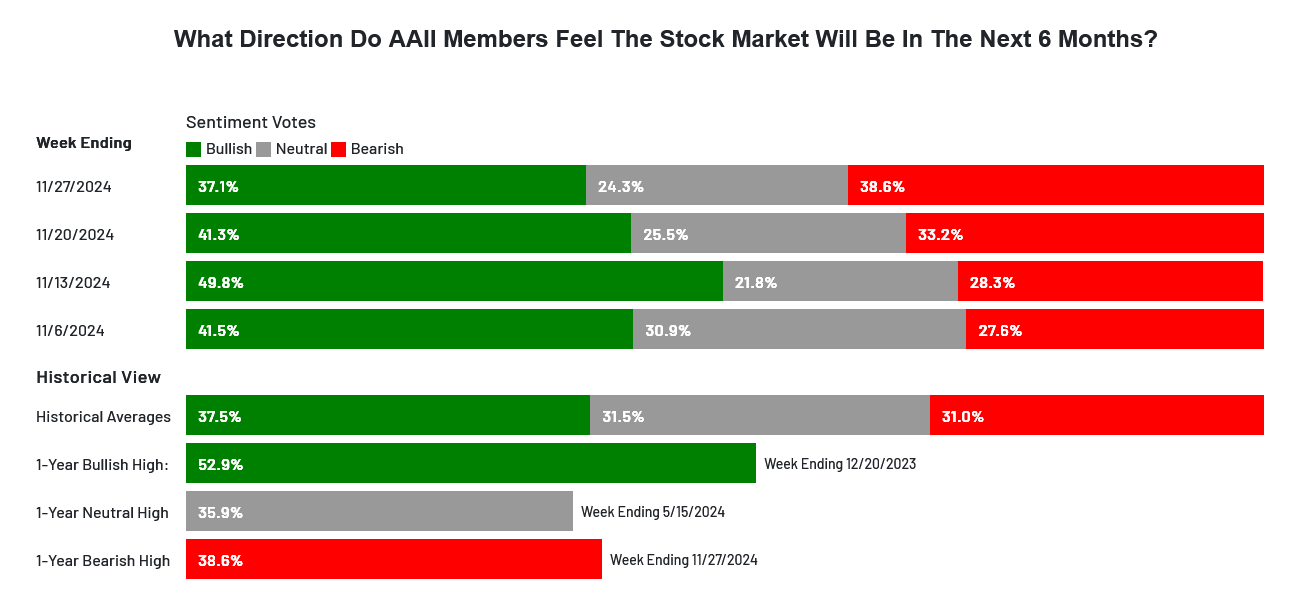
Breadth continued in healthier activity in light trading, with sentiment now showing fear.


