
TECHNICAL ANALYSIS (by Intraday Dynamics)
Note: No technical update for next weekend, next report is 12/20/24.
Major Indices Week of December 6, 2024
 Dow Jones Industrial Average Weekly Candles
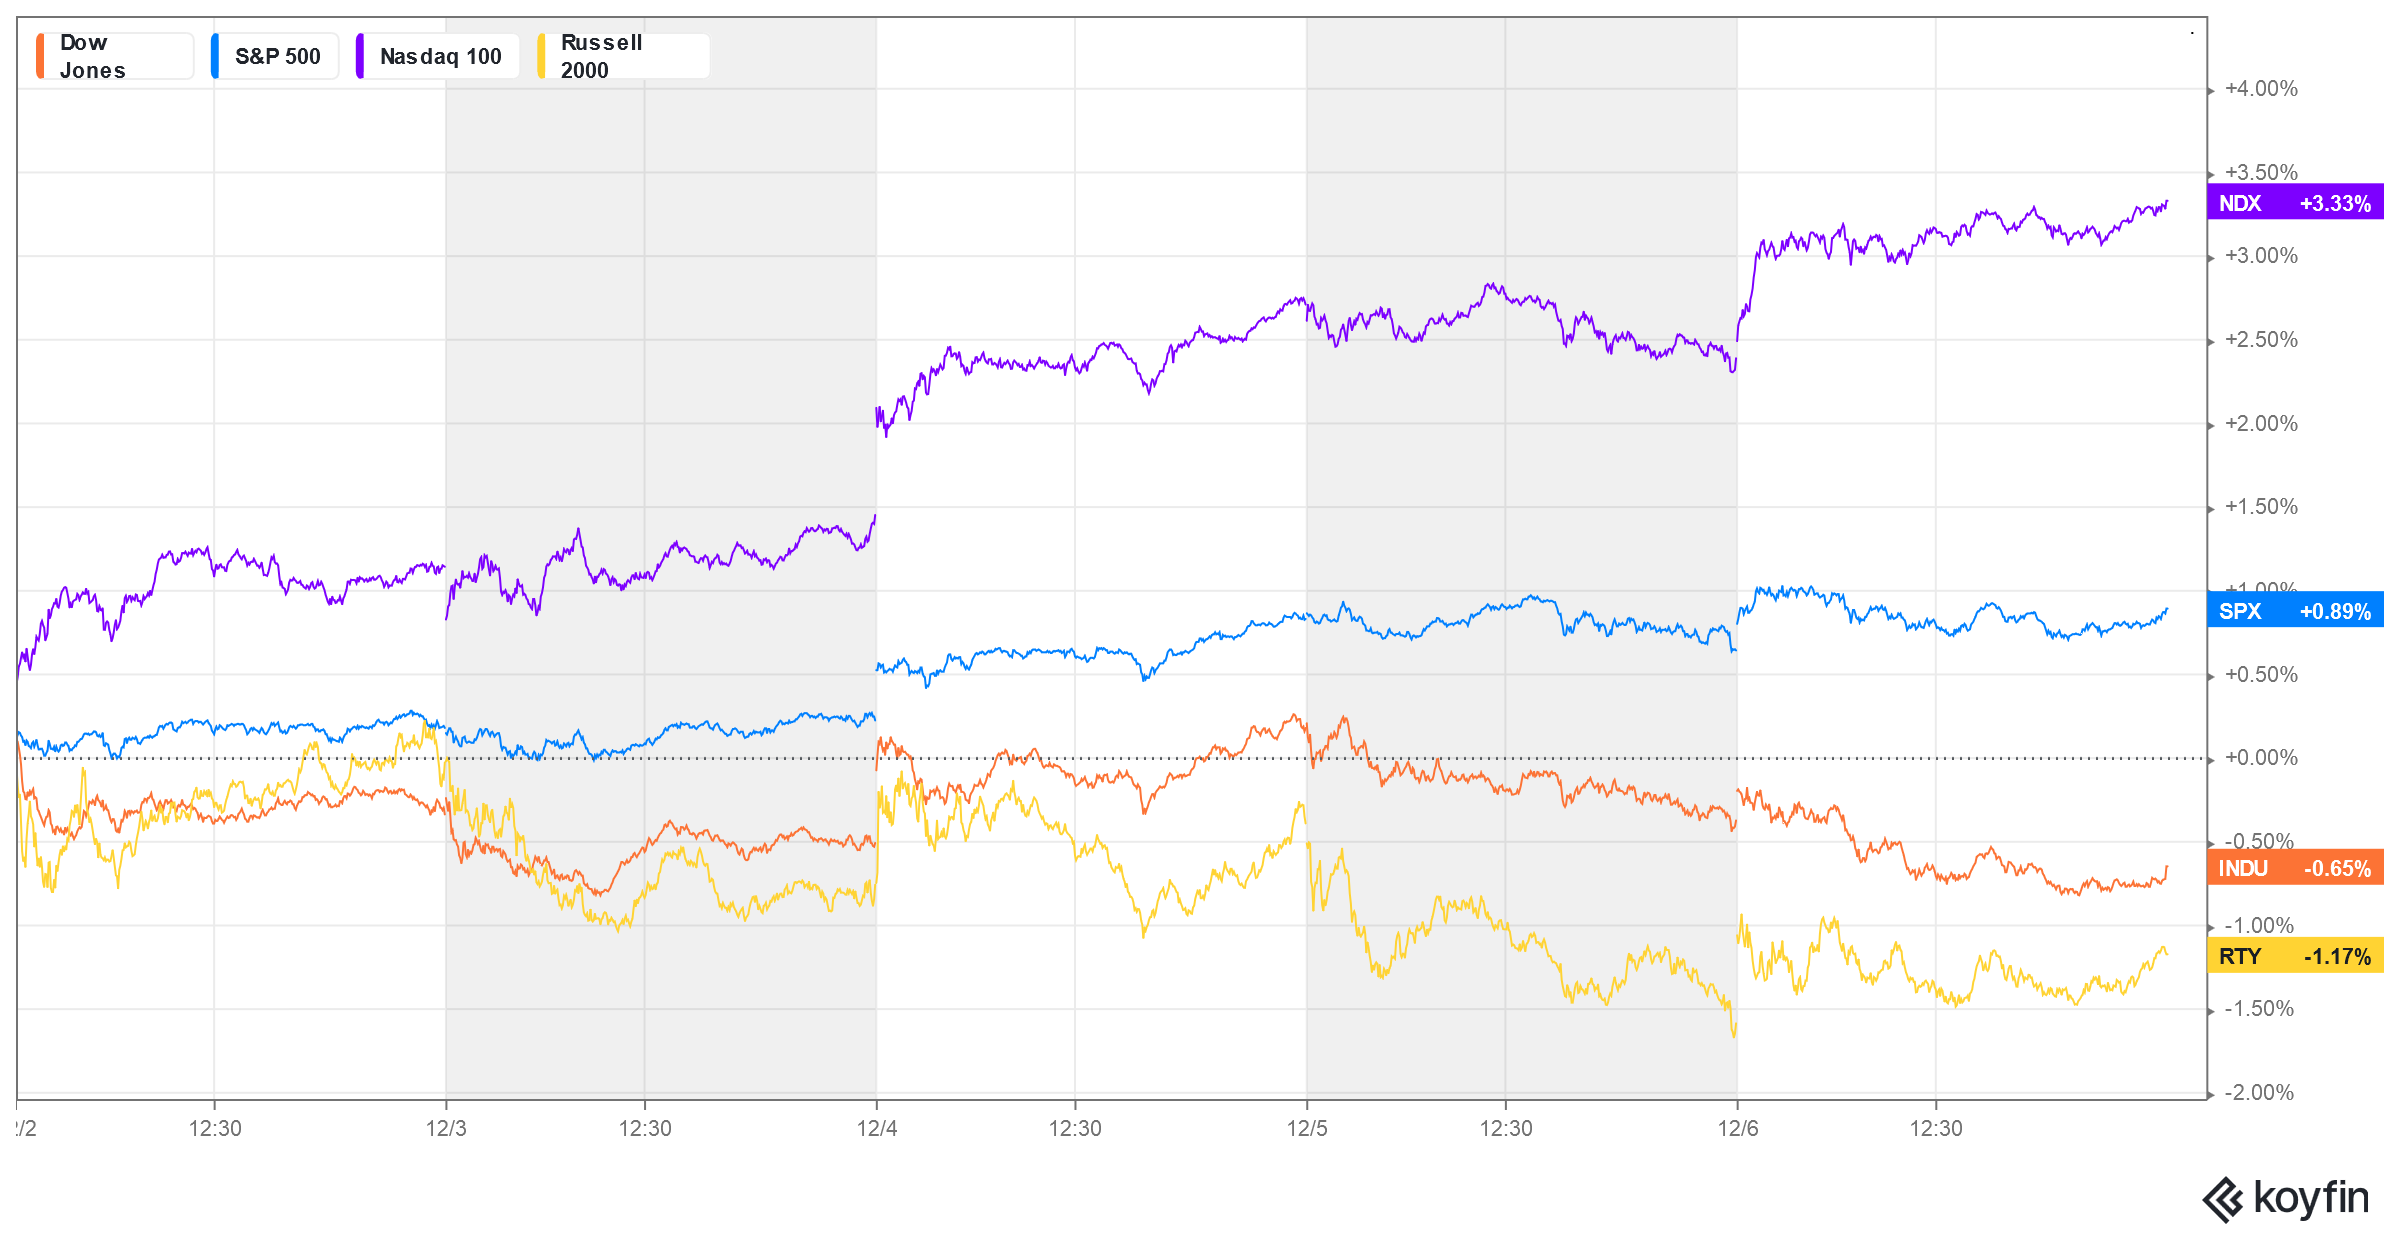
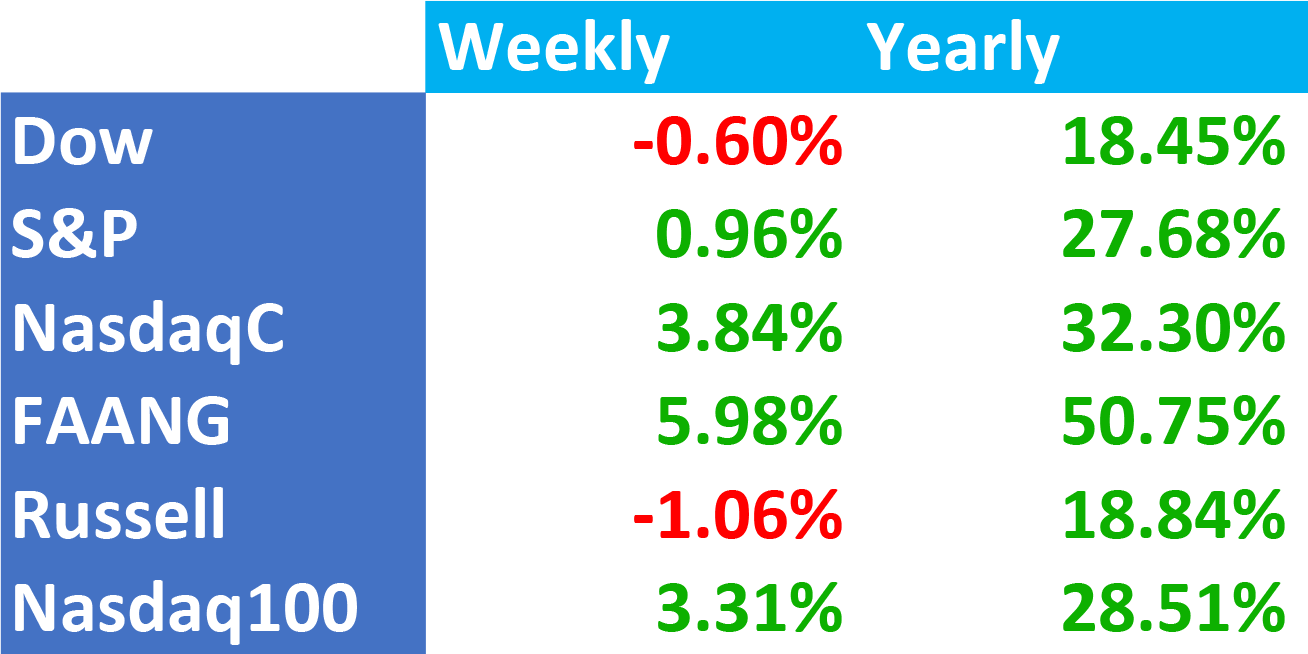
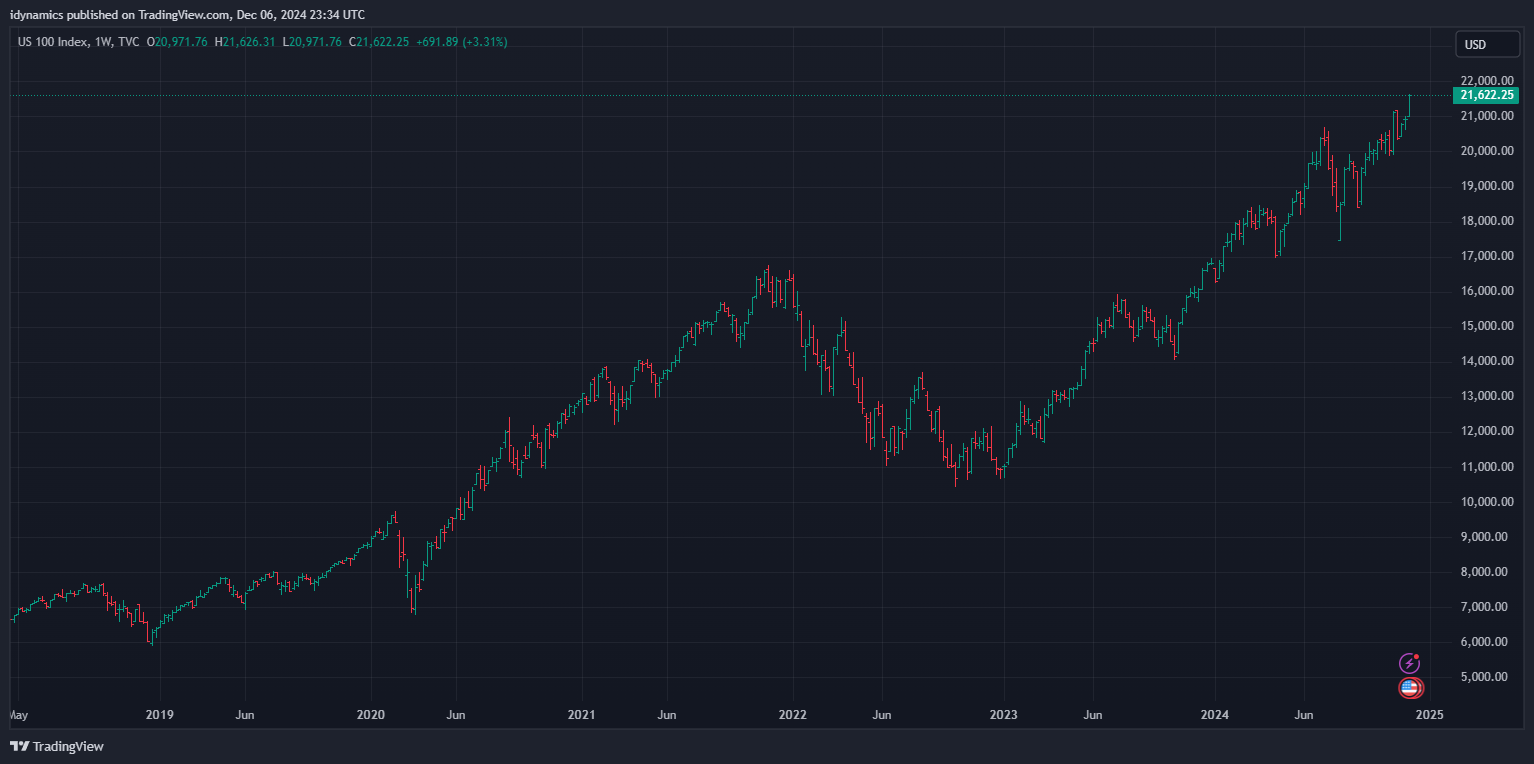
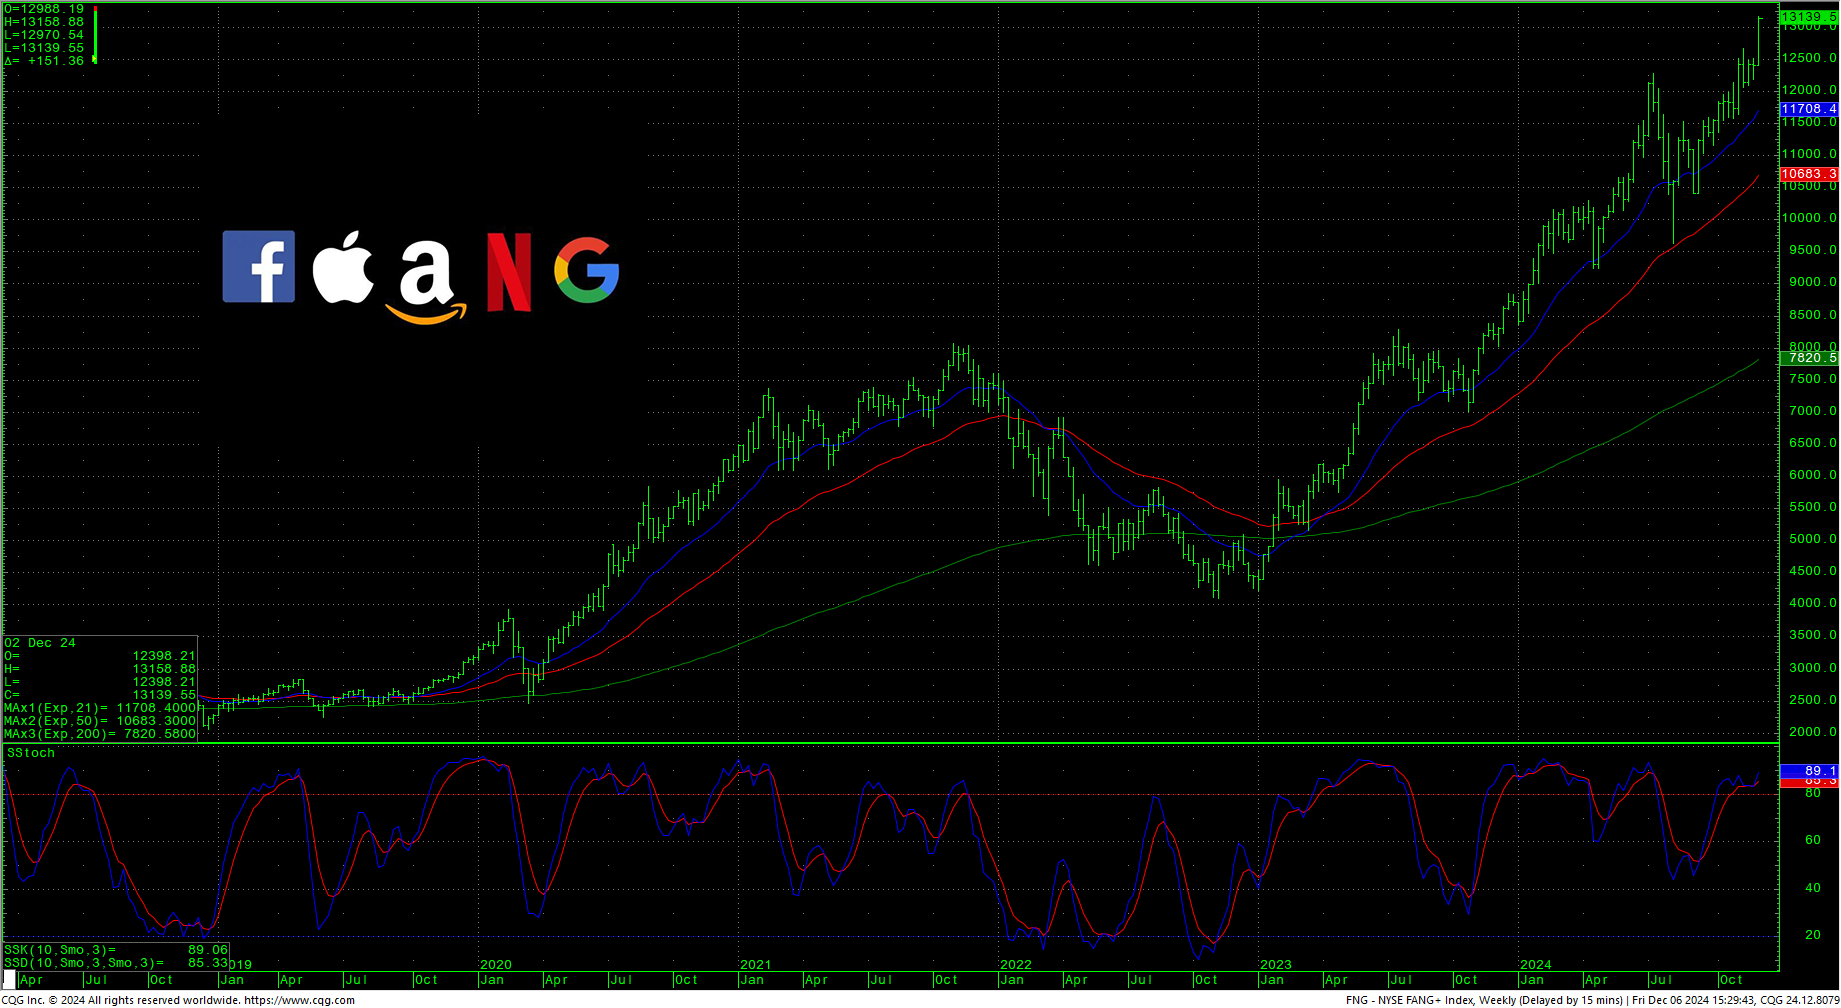
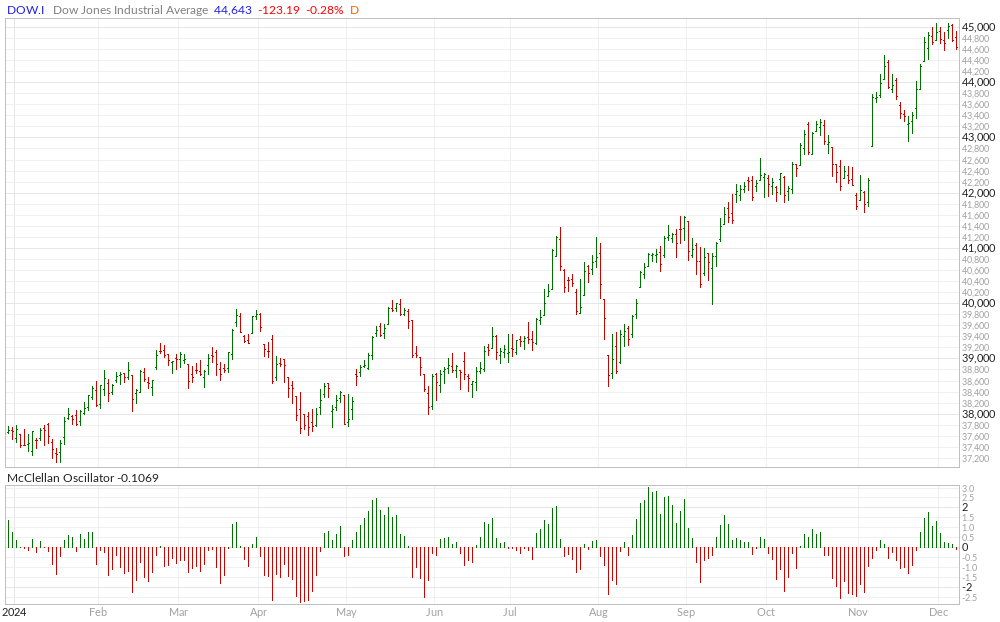
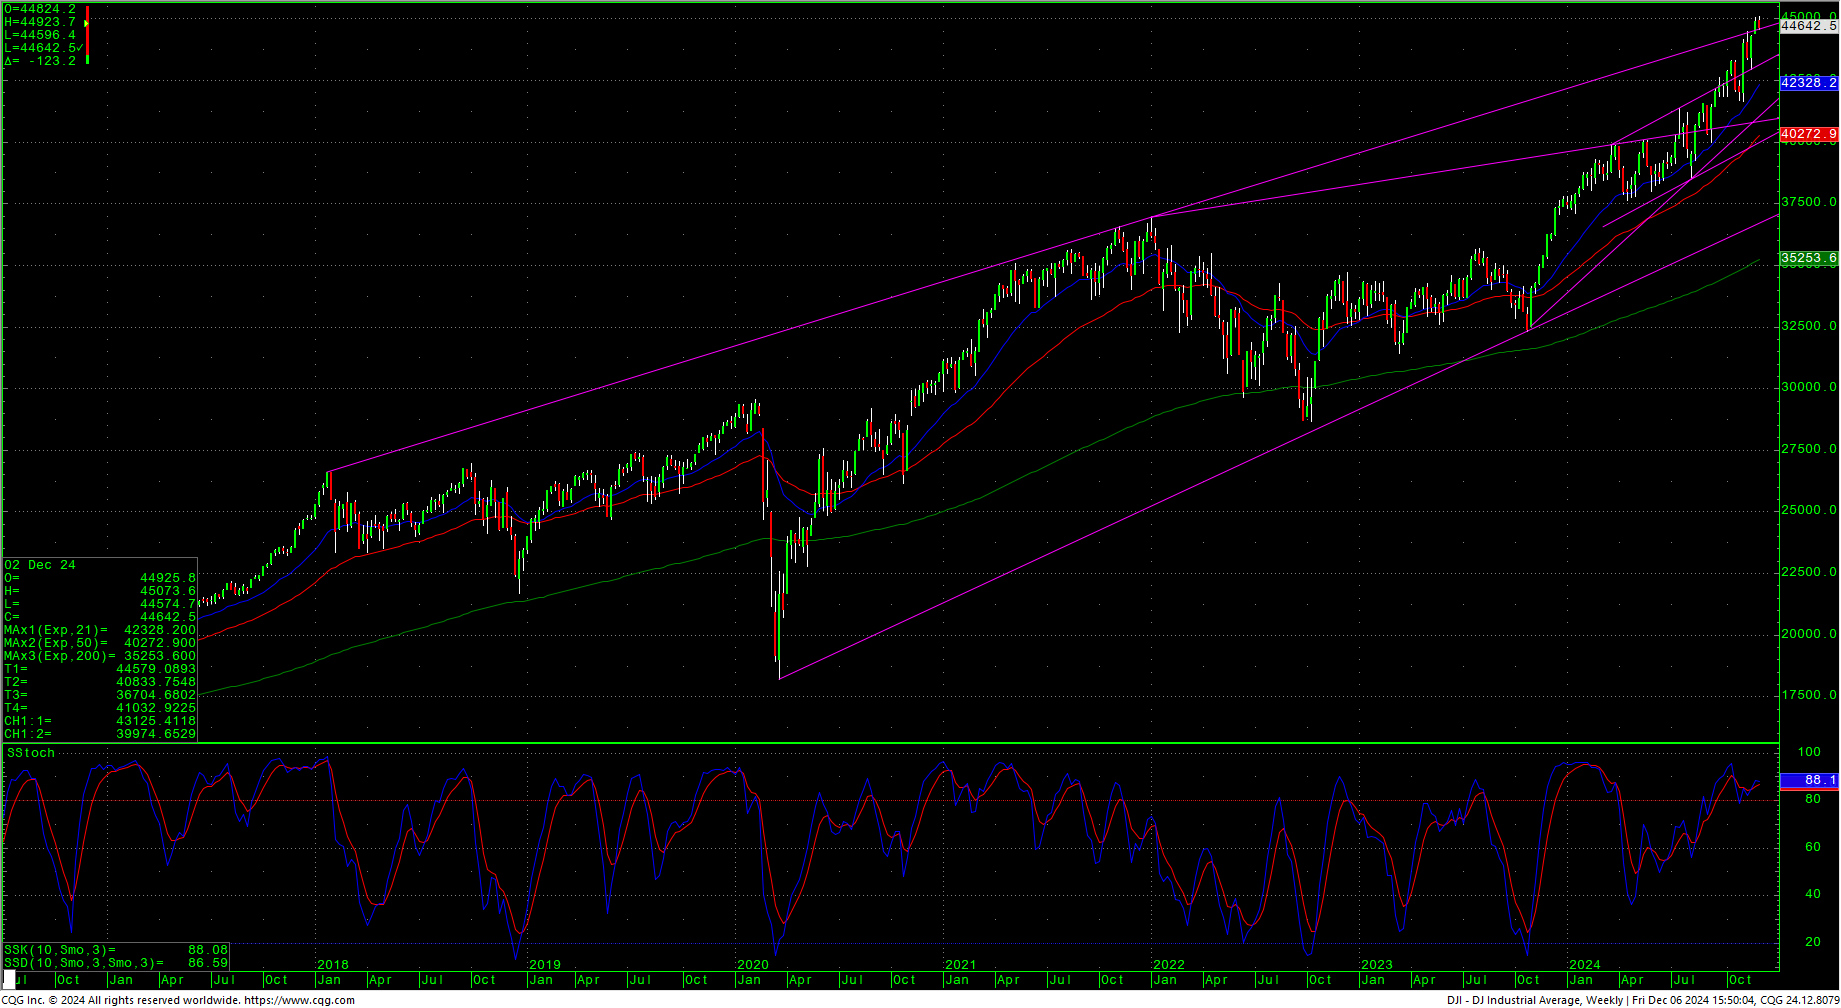 Mixed trade throughout the week as tech stocks soared while blue chips and secondaries sold off. The FANG led the charge, surging to a record and closing up almost +6% with the Nasdaq also setting records as the composite closes in on 20,000. The FANG is up over +50% on the year now. Thursday/Friday marked critical timing and that timing continues into this week with potential for larger ranges/volatility with the focus on geopolitical news. Breadth followed the indexes with the Nasdaq seeing better breadth while the blue chips showed the reverse. The Dow is still holding trade just above the channel line that it took out the previous week. Trading back under that area would be the first sign of short-term weakness. That line begins this week at 44629.
S&P 500 Futures Hourly H-L-C
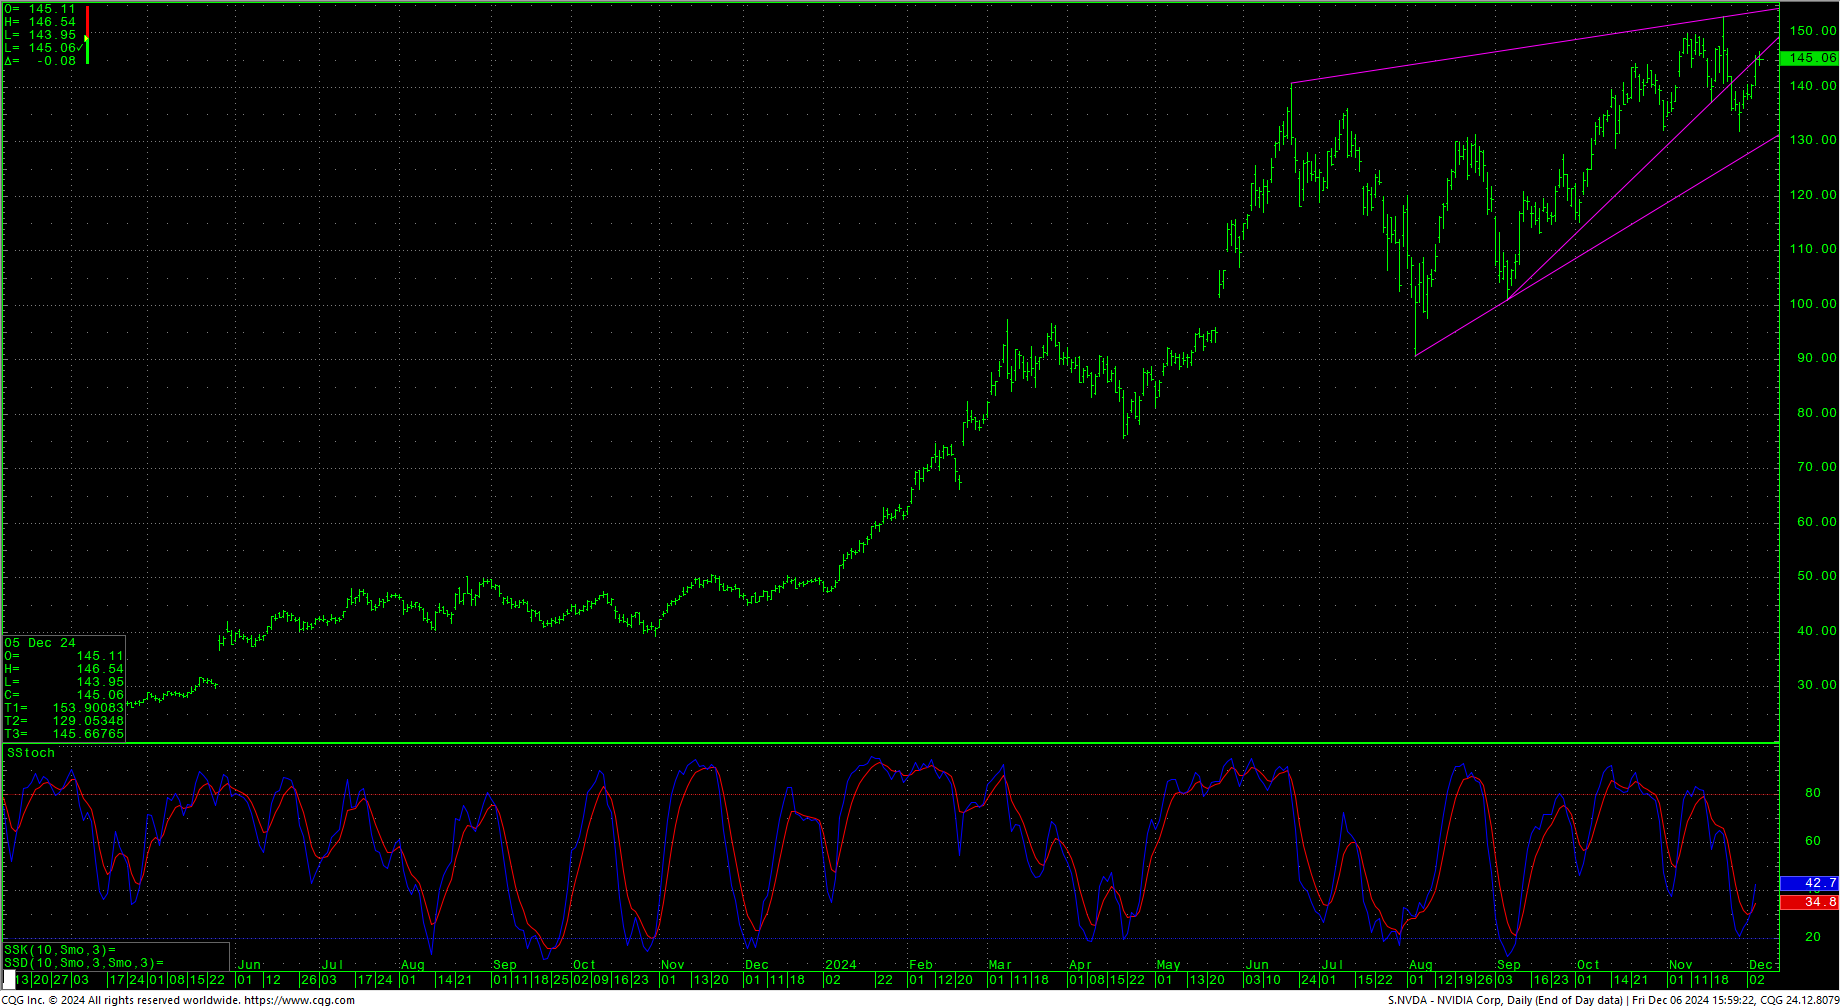
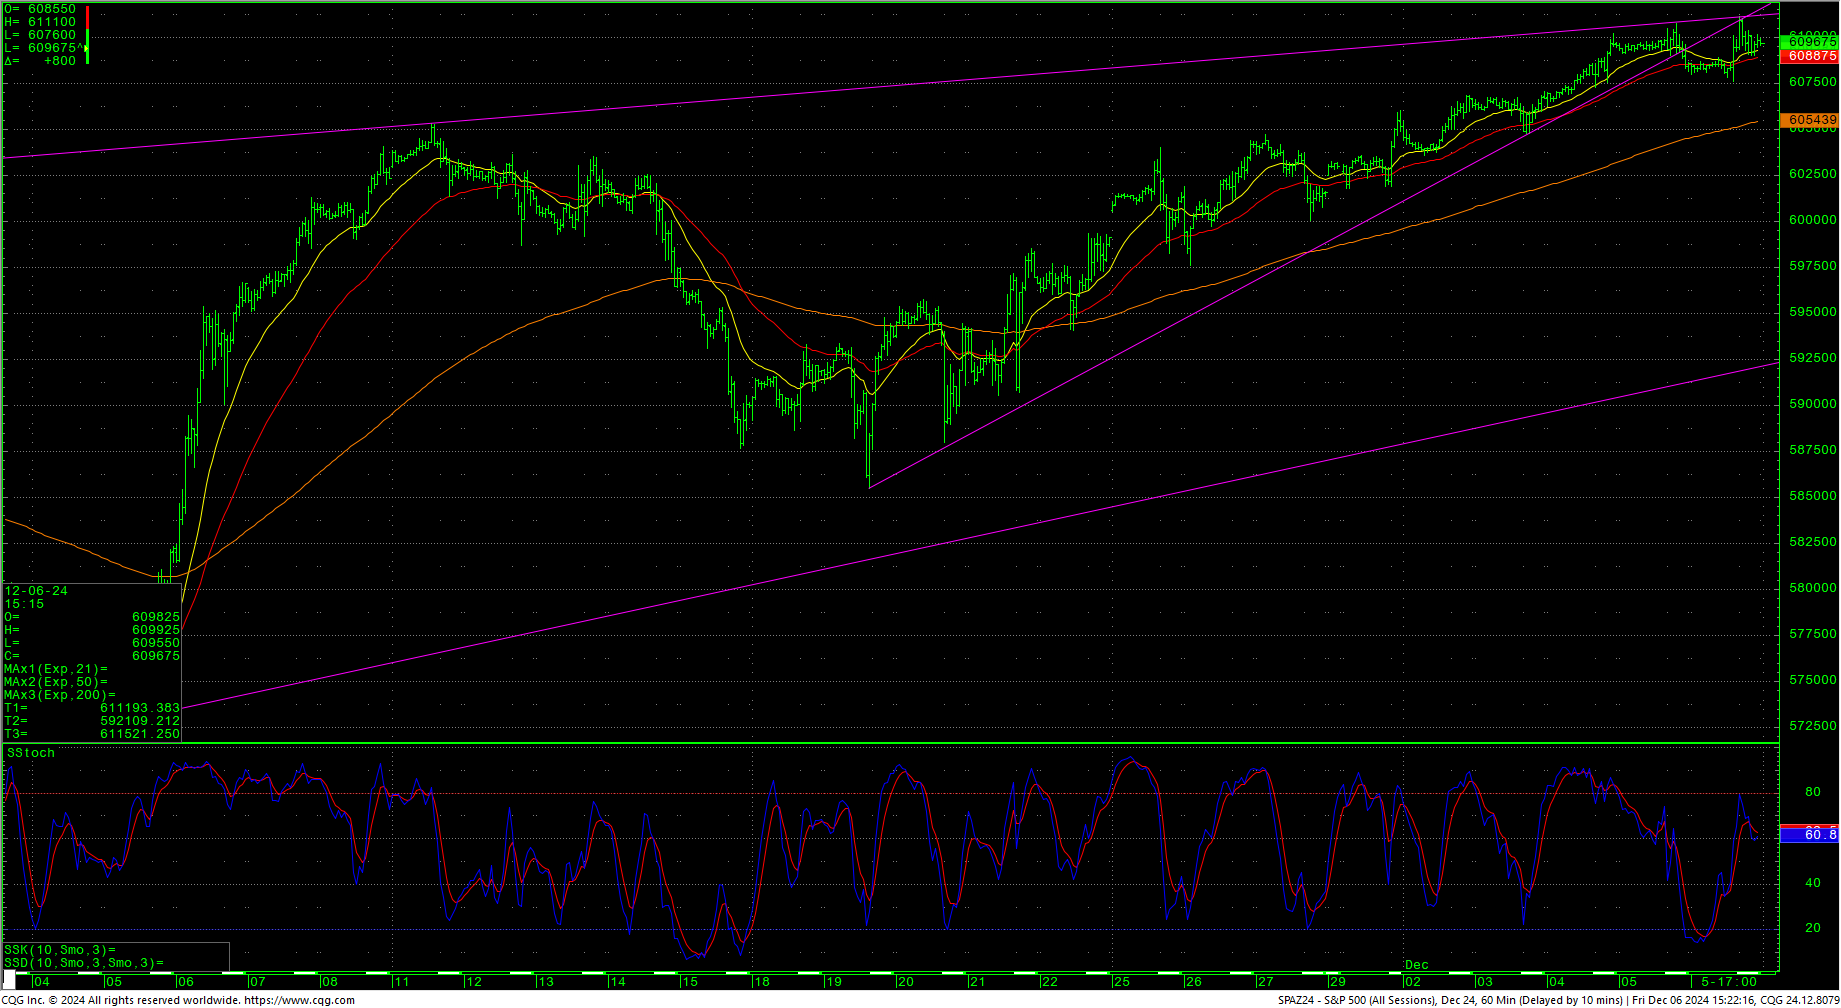 The S&P was higher throughout most of the week, setting a record high with the cash trading to within a fraction (0.03) of 6100. The futures traded to a key overhead trendline throughout the week and closed just under that resistance. The pattern resembles a large ascending wedge, something that can go either way. The daily stochastics are overbought.
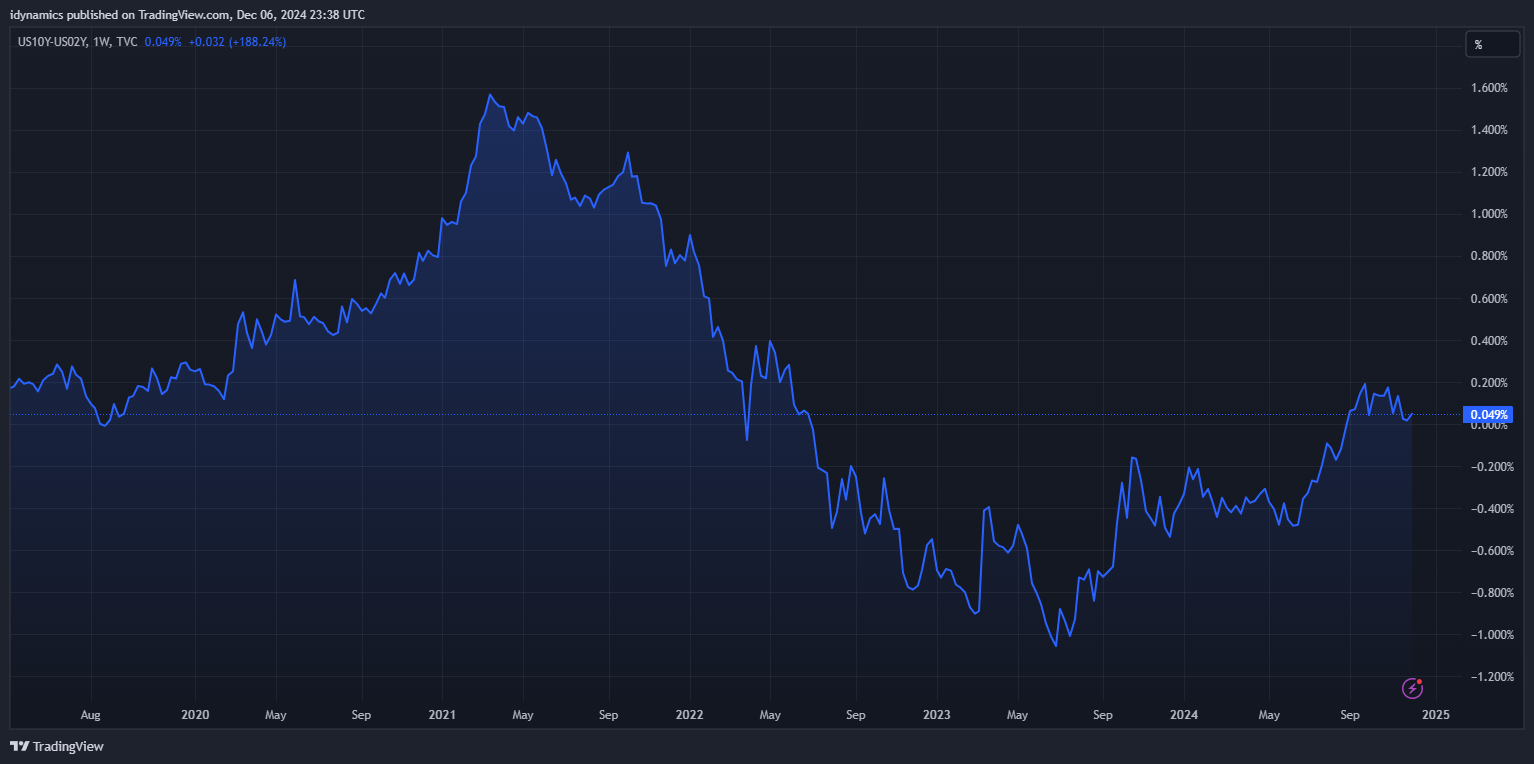
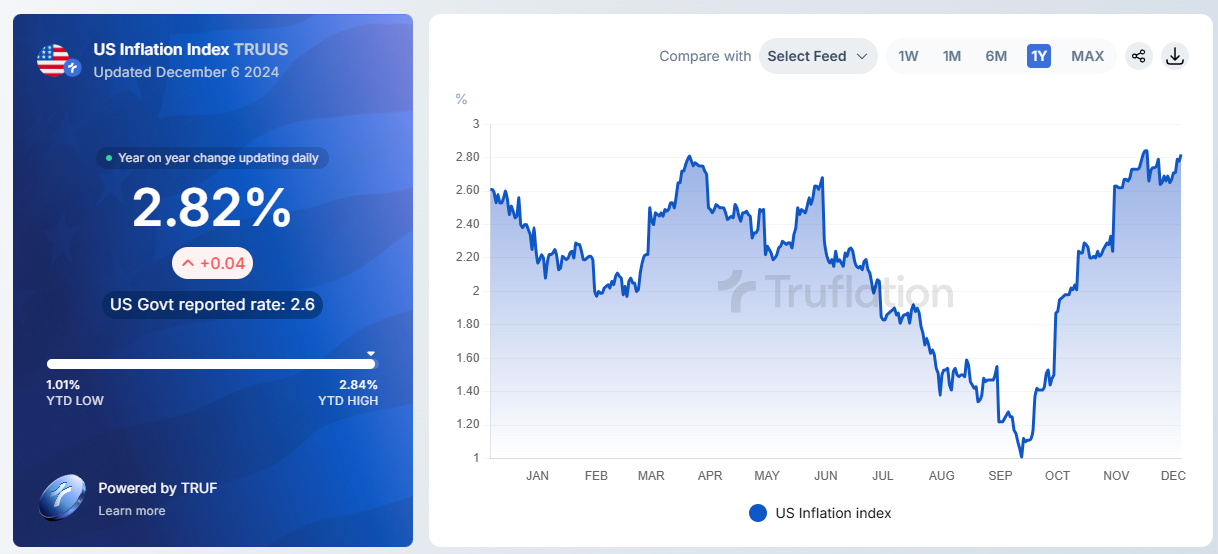
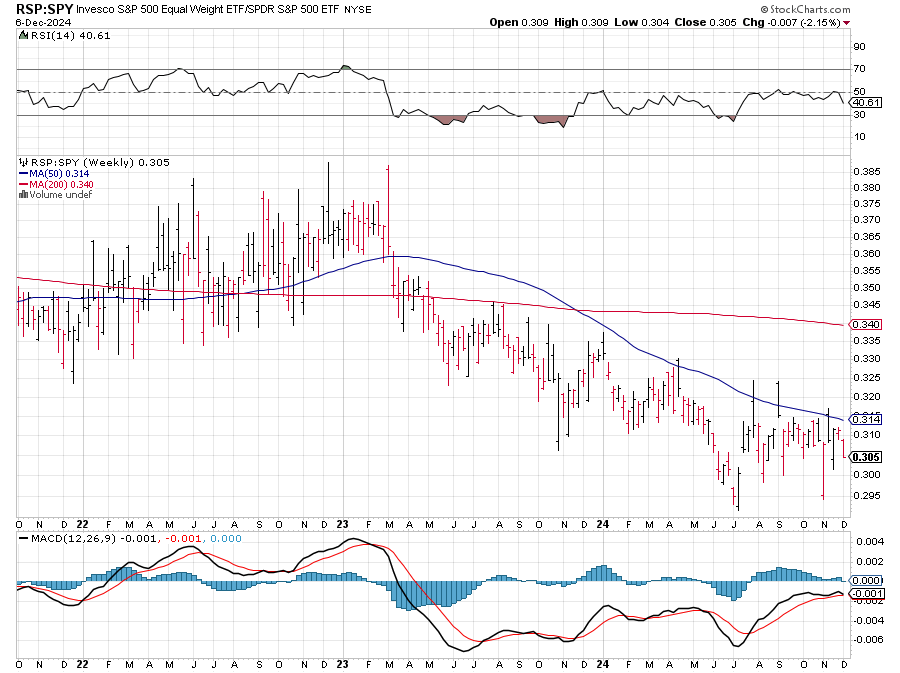
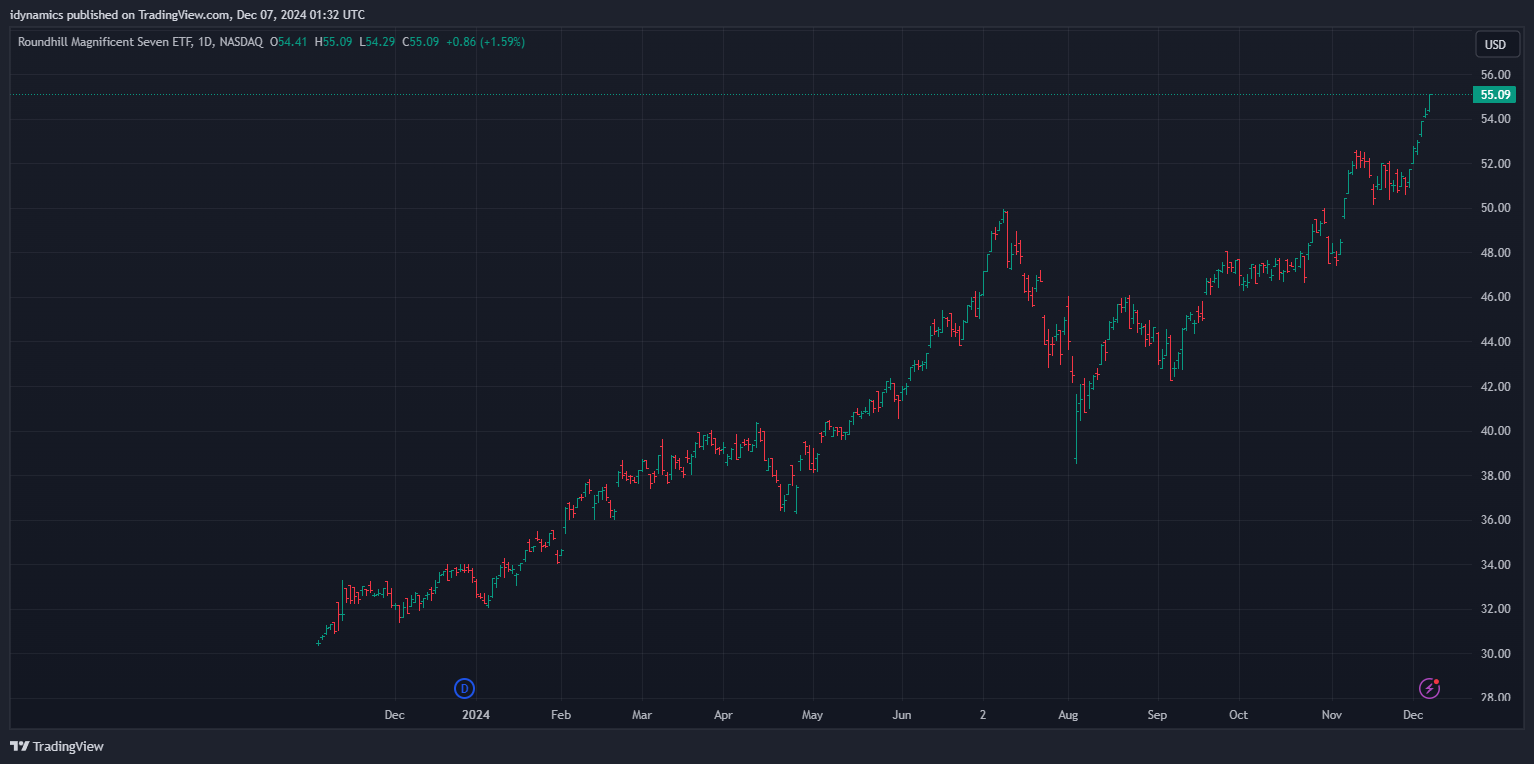
NVDA recovered and closed the week higher as it moved back to retest the steep trendline it breached the previous week. The RSP:SPY suffered a small loss and the weekly is threatening to turn down. The secondaries spent most of last week in negative territory. The MAG7 rocketed to record highs as it has broken out of the bull-flag pattern on the daily. McClellan Oscillators are threatening to turn lower. The focus now for the Dow is the gap left on 25 November 2024 at 44385.4 through 44323.9. That gap has potential to be an exhaustion gap on the daily. Sentiment is mixed but the VIX closed at the lowest level since 12 July 2024, a sign of extreme exuberance. The Yield Curve was up slightly and remains just above positive, ending at +0.049%. Truflation is holding near the tops set in the summer.
10YR-2YR Yield Curve Weekly
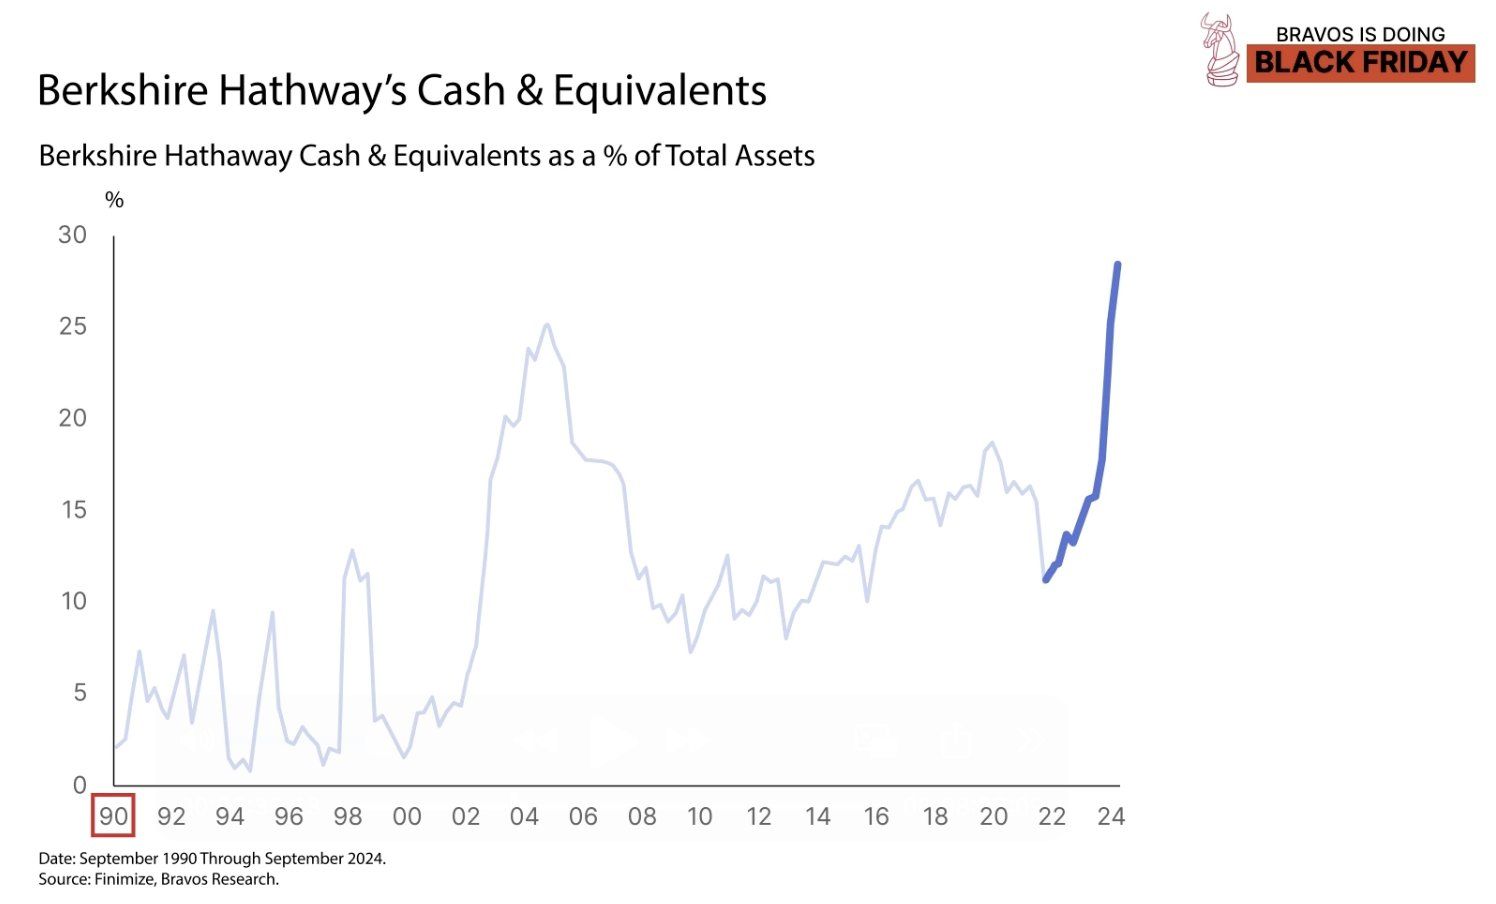
 Currently, Warren Buffet’s Berkshire Hathaway (misspelled) is holding the largest level of cash ever according to Bravos Research…over 25%.
 VIX Weekly Candles
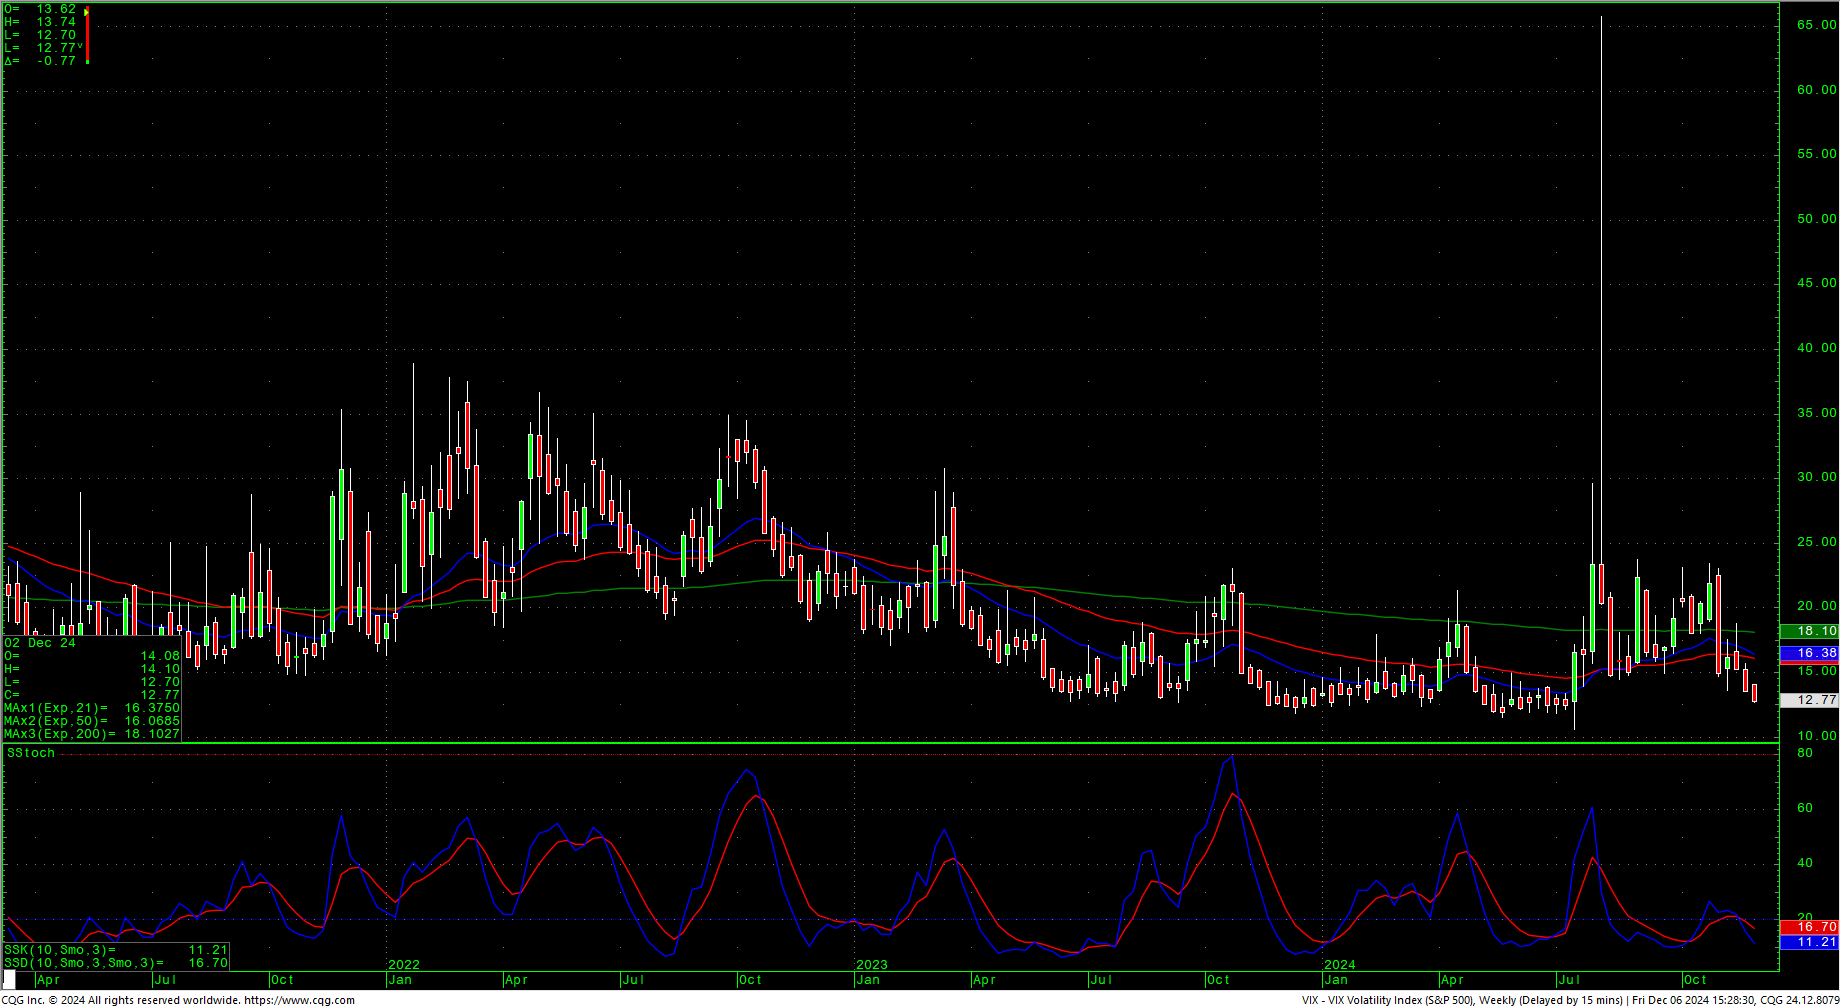
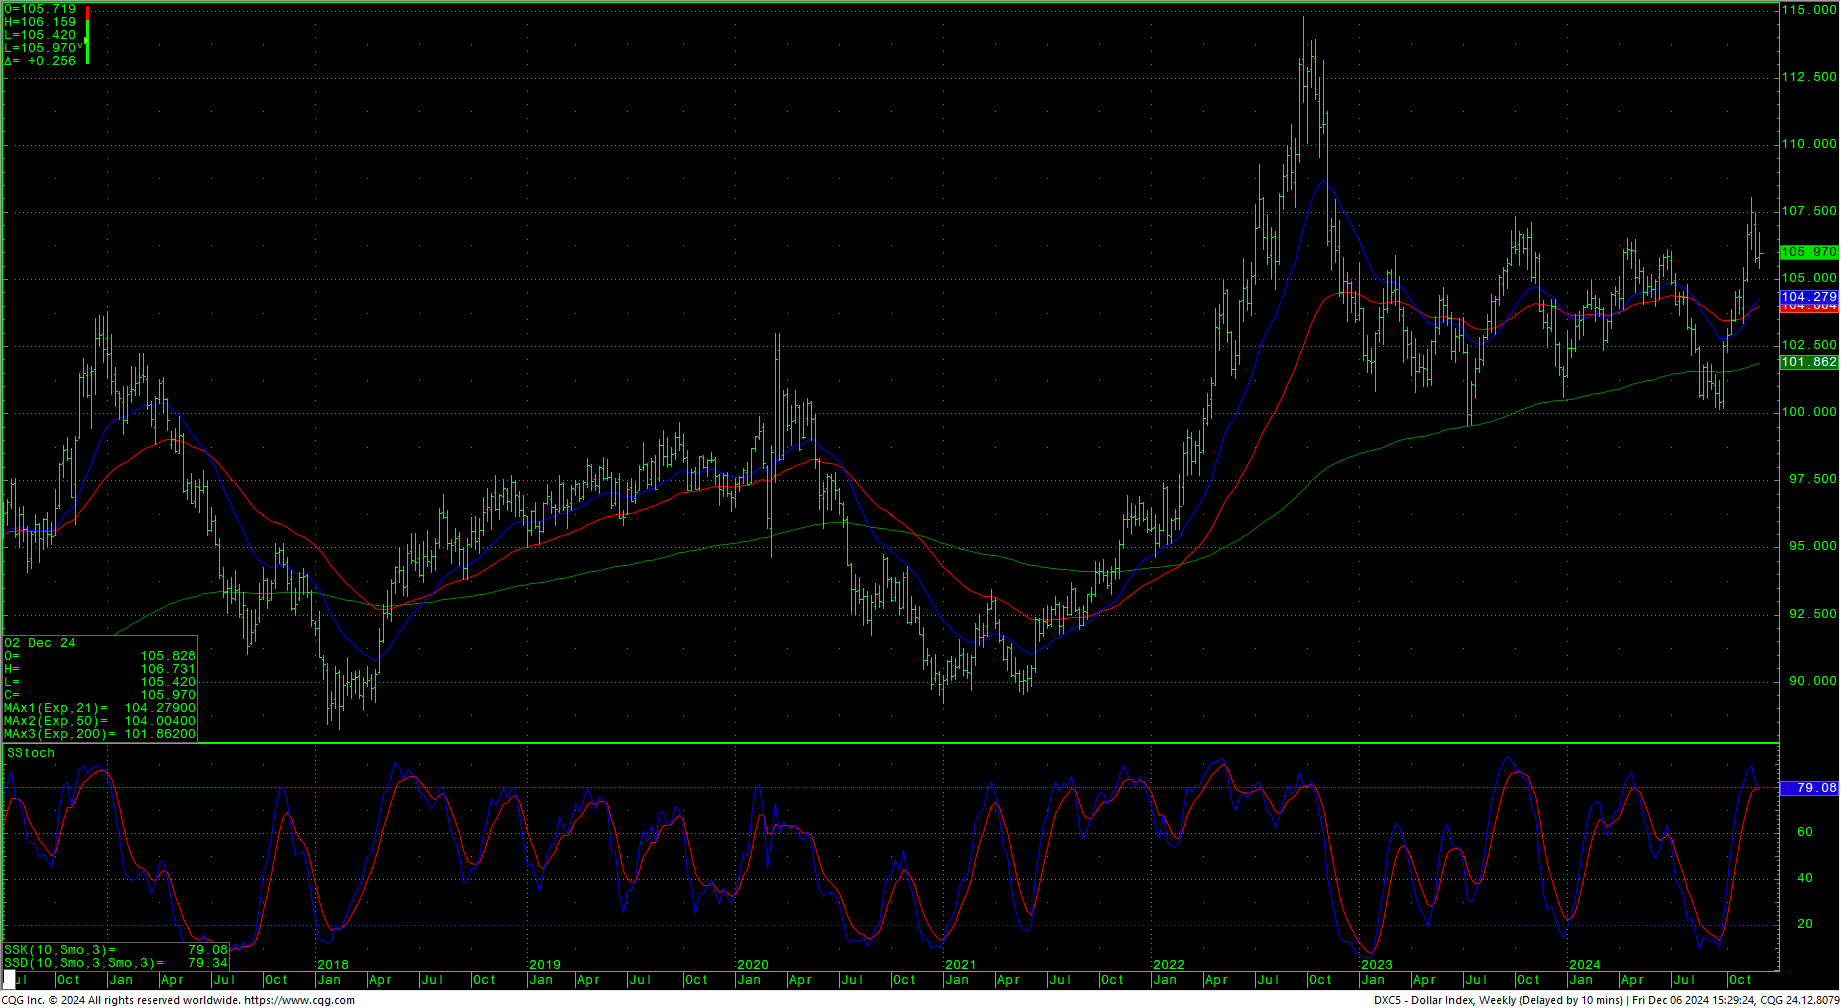
The VIX was lower all week and closed on the bottom of the weekly range at the lowest daily close since 12 July 2024. It is the lowest weekly close since 16 July 2024 (which marked a significant short-term top). The US Dollar closed out the week up slightly in the lower 50% of a reversal range.
 Nasdaq 100 Weekly H-L-C
 52-Week A/D Line
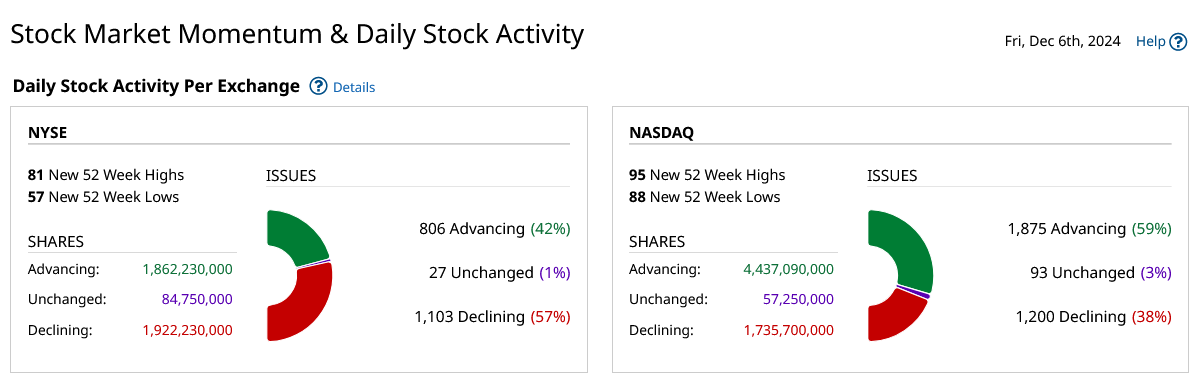
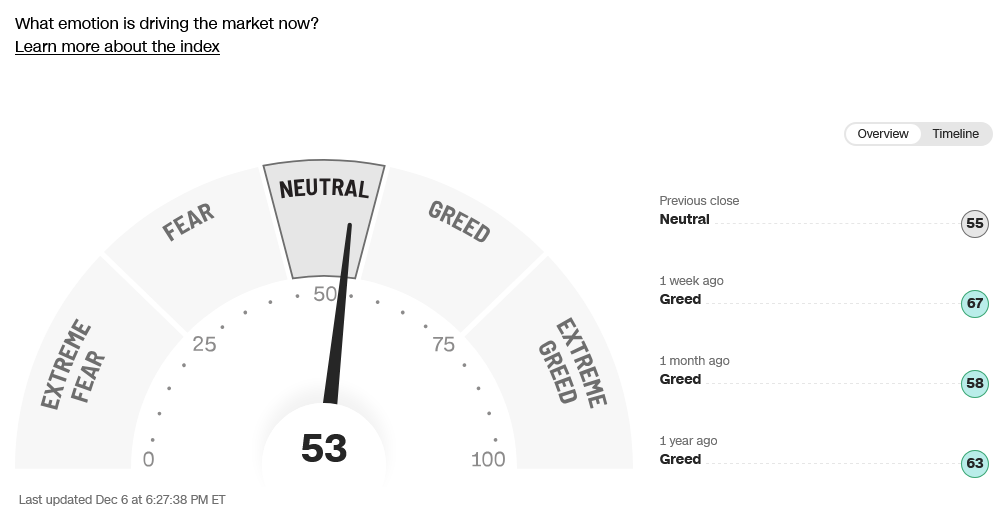
Breadth was mixed, good for the Nasdaq, bad for the rest of the market. Sentiment shows fear.


