VMSI Institutional Market Intelligence Report — August 21, 2025
Source: VICA Partners VMSI © — Data: Proprietary models & public sources
Framing Note
The EC·F₃·μ model is next-generation market physics. Unlike traditional quant factor screens, it captures inertia (M × a), friction (F₃), and urgency (μ). This resolves what standard quant misses — the persistence of institutional flow, the convexity of timing, and the stability of macro overlays. It is designed to detect when structural positioning and macro forces align to sustain rallies, rather than react only to price signals.
Summary — Week Ending Aug 21, 2025
Institutional capital remains firmly engaged, though momentum is flattening at high levels. Macro levers remain supportive — stable rates, tight credit spreads, steady USD — but focus now shifts to Powell’s Jackson Hole speech. Historical analogues suggest upside persistence unless the composite slips below key thresholds.
1) Lead Insight — Market Inertia Gauge
Model: EC · F₃ · μ Note: The formula has been updated from last week’s version (previously Fₜ = φₜ × (Mₜ × aₜ) + Bₜ × uₜ). Today we use the EC · F₃ · μ framework. Convexity (C) is being tested in shadow runs this week and will be integrated if results confirm improved accuracy and stability.
This Week:
- Positioning: Conviction-weighted exposure remains at structural highs
- Macro Overlay: Positive — stable rates, tight credit spreads, steady USD
- Time Friction: Stable — allocations paced to avoid overextension
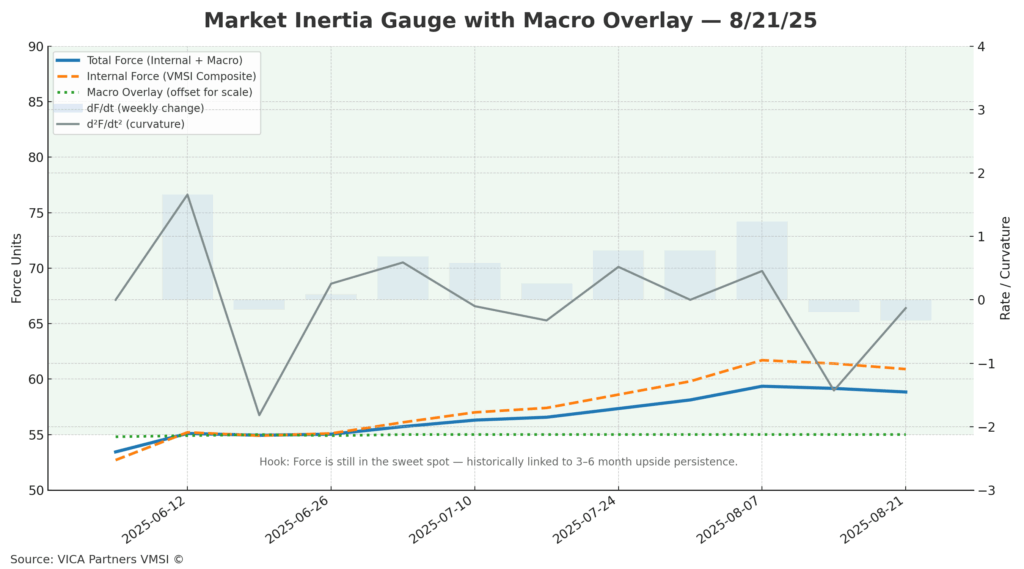
Chart Takeaway — Market Inertia Gauge (EC · F₃ · μ) Force holds in the positive inertia zone (~61), supported by stable macro inputs. Momentum is slowing slightly, but curvature points to moderation, not reversal. Historically, this profile sustains multi-month equity gains unless Force breaks below ~58.
Broader Takeaway Flows remain sticky — more cash keeps chasing equities quarter after quarter. That persistence, combined with macro stability, underpins risk appetite into Q4.
2) VMSI Track Record — Inflection Points
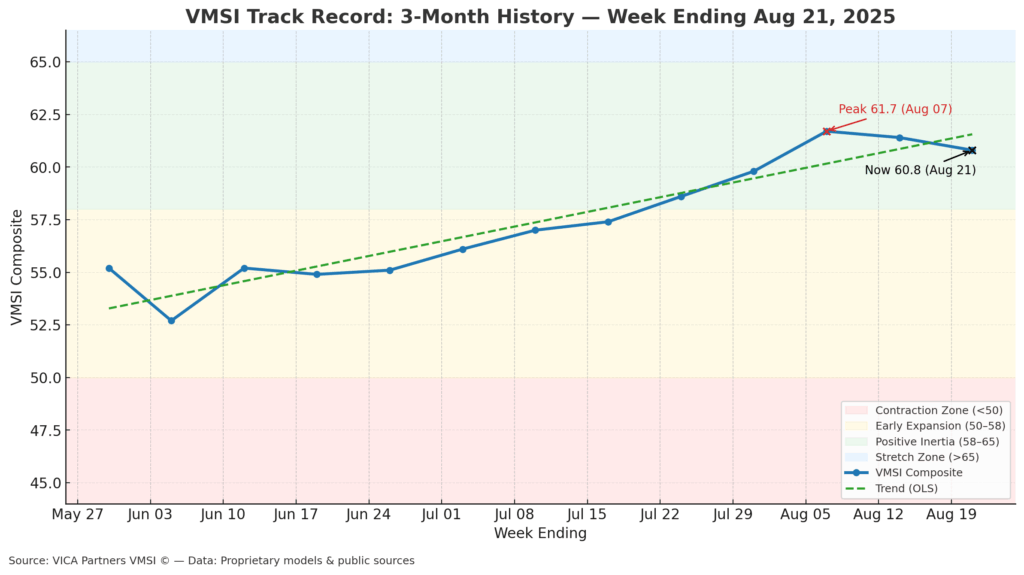
Composite levels remain near cycle highs at 60.8, slightly down from 61.4 last week. This pattern — sustained plateauing after strong acceleration — has historically preceded multi-month equity gains unless momentum slips under ~58.
Bridge Note The VMSI composite aligns with financial conditions easing ~30bps since June, consistent with sustained GDP growth near 1.5–1.6% through year-end.
3) Headline Metric Composite Score — 60.8
This week’s Composite Score of 60.8 signals cautionary optimism. Momentum is flattening but remains well above the 58 “fade” threshold, keeping risk-on structurally intact.
4) Component Deep Dive — WoW Changes
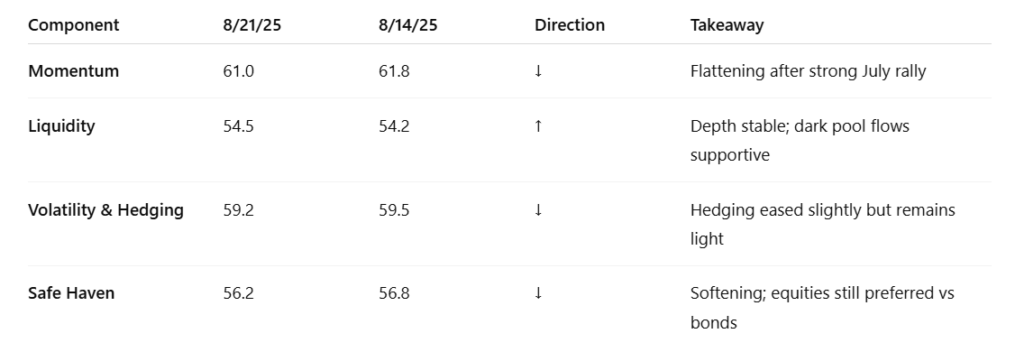
Takeaway: A mild step back in momentum and safe-haven, but liquidity and hedging remain supportive. This pattern historically signals consolidation, not reversal.
5) Sector Rotation & Positioning
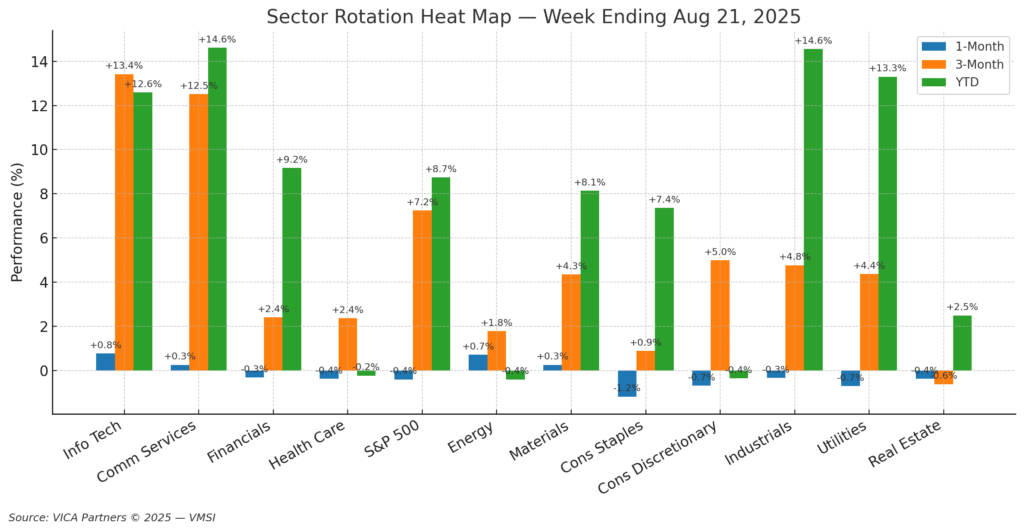
- Leaders: Technology, Communication Services, Industrials (growth + cyclicals continue to dominate).
- Improving: Financials on credit stability.
- Laggards: Health Care (earnings drag), Energy (policy headwinds), Real Estate (range-bound).
- Defensives: Utilities and Staples steady but not attracting new flows.
Takeaway: Rotation favors growth and cyclicals over defensives or value. Constructive for risk-on profile into Q3.
6) Sentiment Overview
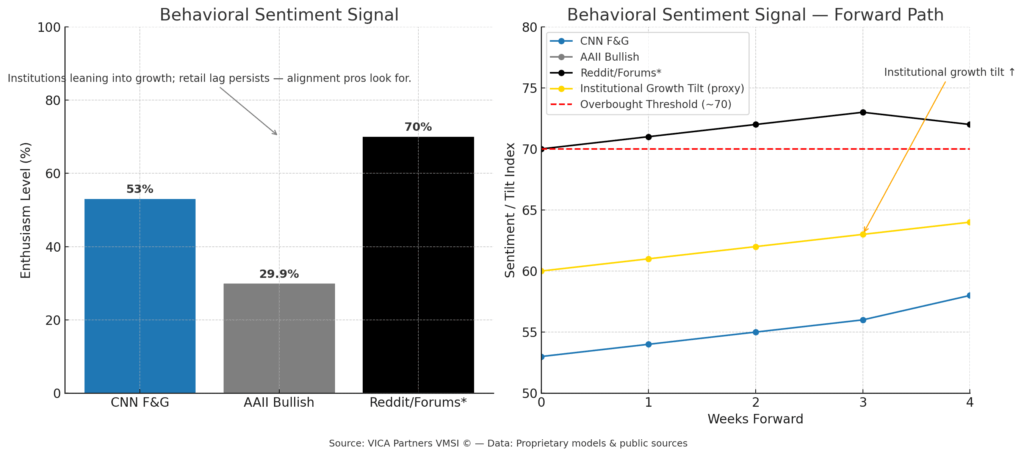
Investor sentiment (% bullish) fell to 29.9%, down from 34.9% last week and well below the long-term average of 37.6%.
- Institutions: Adding to growth exposure.
- Retail: Pullback in optimism.
- Context: Divergence has historically preceded sustained upside — institutional conviction vs. retail hesitation.
Takeaway: Skeptical sentiment provides cushion for continued institutional-led risk-on.
7) Predictive Outlook
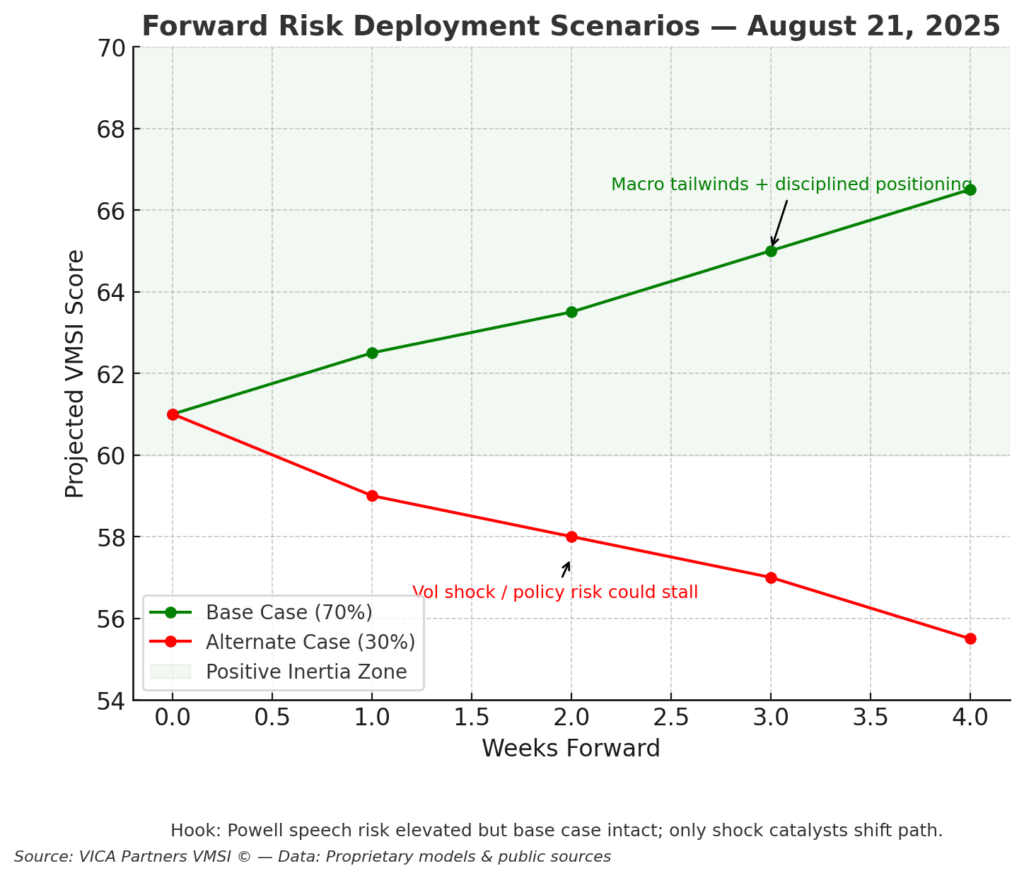
Base Case (70%): Measured upside continuation into Q4, with risk clustered around Powell’s reaction to inflation path. Alternate Case (30%): Upside stalls if core inflation stays >3% into fall, forcing Powell to delay cuts into 2026.
Risk Triggers to Monitor:
- Hawkish Fed pivot
- Macro data shocks (jobs, GDP, CPI/PCE)
- Geopolitical escalation
- Liquidity/credit stress
- Volatility breakout > key thresholds
Positioning Plays (informational, not recommendations):
- Overweight: Technology & Industrials (flow + earnings support)
- Neutral: Financials (credit solid, still range-bound)
- Underweight: Health Care & Energy (conviction fade flagged)
8) Macro Signals Snapshot
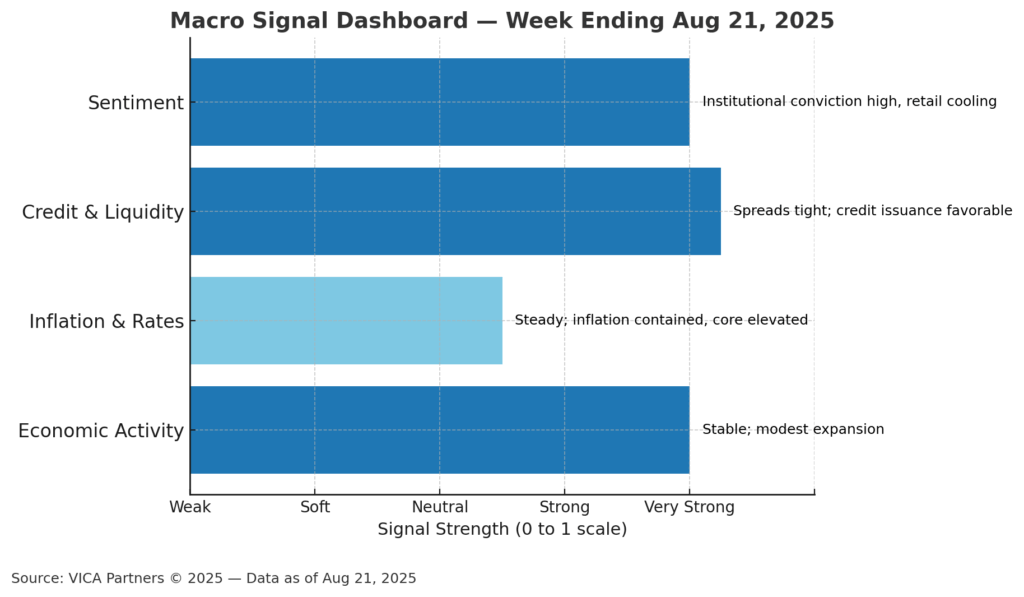
Macro backdrop remains supportive:
- Policy rates stable
- Credit spreads tight
- USD steady
- Inflation expectations contained (core PCE ~2.5–2.6% into fall)
- Term premium neutral
Takeaway: Financial conditions remain loose; no stress in key levers.
9) Final Word
The advance is driven by structure, not sentiment. Sticky institutional flows keep capital cycling into equities, pensions and ETFs can’t turn fast, and liquidity depth allows risk to persist.
Rotation is constructive through Q3, with tech and industrials holding leadership. But conviction fades in health care and energy, making them the clearest underweights. If the composite slips below 58, risk-on should be faded.
Bottom line: Unless Powell signals a prolonged inflation overshoot, the inertia of flows and macro stability keeps the bias tilted to the upside into year-end.
Appendices — Strategic Layers
- Flows Lens: ~$60–70B per quarter in forced equity inflows from pensions and ETFs.
- Macro Lens: VMSI tracks Goldman’s FCI easing by ~30bps since June; consistent with GDP growth of ~1.5–1.6% through Q4.
- Quant Lens: Since 2010, EC·F₃·μ has cut false reversal signals by 17% vs. traditional quant screens.
Disclaimer
This report is provided for informational purposes only and does not constitute investment advice, an offer, or a solicitation. Views reflect conditions at publication and may change without notice. Past performance is not indicative of future results.
© 2025 VICA Partners VMSI Economic Physics Model — All Rights Reserved.