Chart patterns type 1 – Head and Shoulders

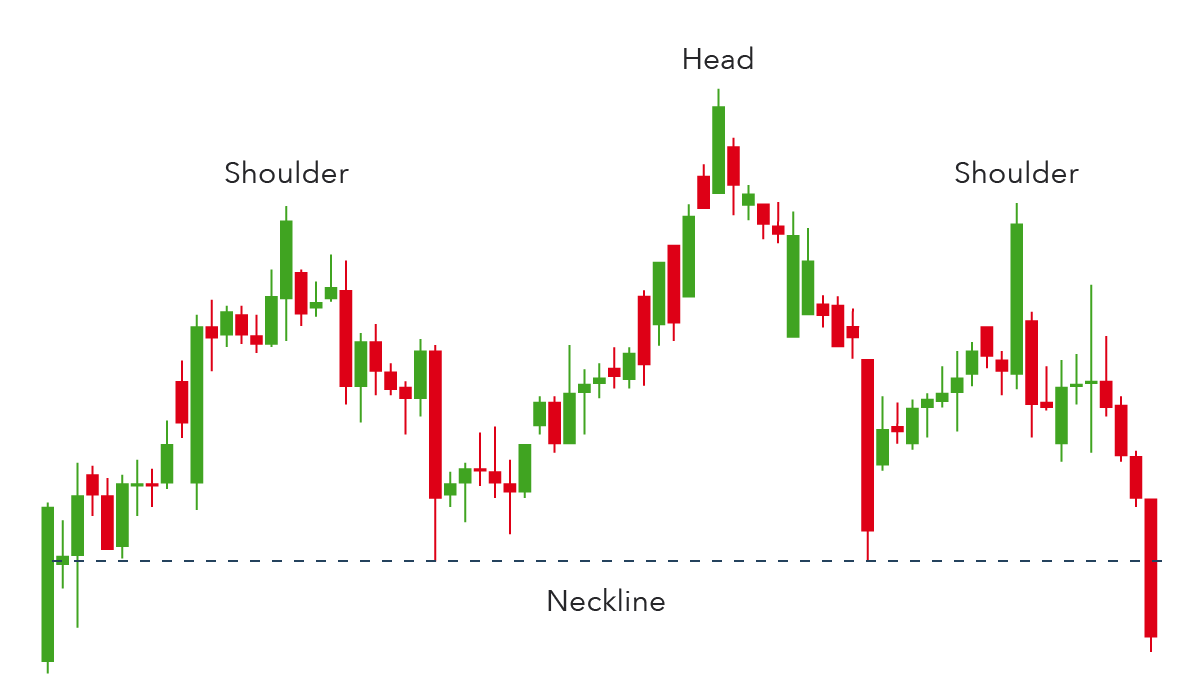
Head and shoulders is a chart pattern in which a large peak has a slightly smaller peak on either side of it. What its used for/ to predict a bullish-to-bearish reversal. What to look for/ the first and third peak will be smaller than the second, but they will all fall back to the same … Read more

Forward P/E explained

Forward P/E (price-to-earnings) ratio is a financial metric used to value a company’s stock. It is calculated by dividing the current stock price by the estimated earnings per share (EPS) for the next twelve months. The forward P/E ratio gives investors an idea of what the market is willing to pay for a company’s future … Read more

PEG Ratio explained and its importance

The PEG ratio, which stands for Price/Earnings to Growth ratio, is an important financial metric that investors use to assess the value of a stock. It takes into account a company’s earnings growth rate and its price-to-earnings (P/E) ratio to determine whether a stock is overvalued or undervalued. The PEG ratio is important for several … Read more

Momentum Investing

Pro Tip: Momentum investing The main rationale behind momentum investing is that once a trend is well-established, it likely to continue! Momentum investing, buying on positive performance and selling off on trend. Research has shown that momentum trading has an edge in the stock market when used over a short timeframe, such as 3-12 months, … Read more