Technical Update 06-24-2023 DJIA & S&P500

TECHNICAL ANALYSIS Major Indices Week of June 23, 2023 Stocks spent the entire shortened trading week lower and closed near the low end of the weekly ranges. The market is responding to a big shift in sentiment over the past three weeks. Prior to the new 2023 highs for most indices the battle was between … Read more

Technical Update 05-29-2023 DJIA & S&P500

TECHNICAL ANALYSIS Major Indices Week of May 26, 2023 Stocks saw another extremely volatile week last week, once again led by tech stocks. The Dow saw a two-month trading low against lower trendline support in Thursday’s minor cycle timing point and then all indices rallied with the Nasdaq and the FANG leading the way, closing … Read more

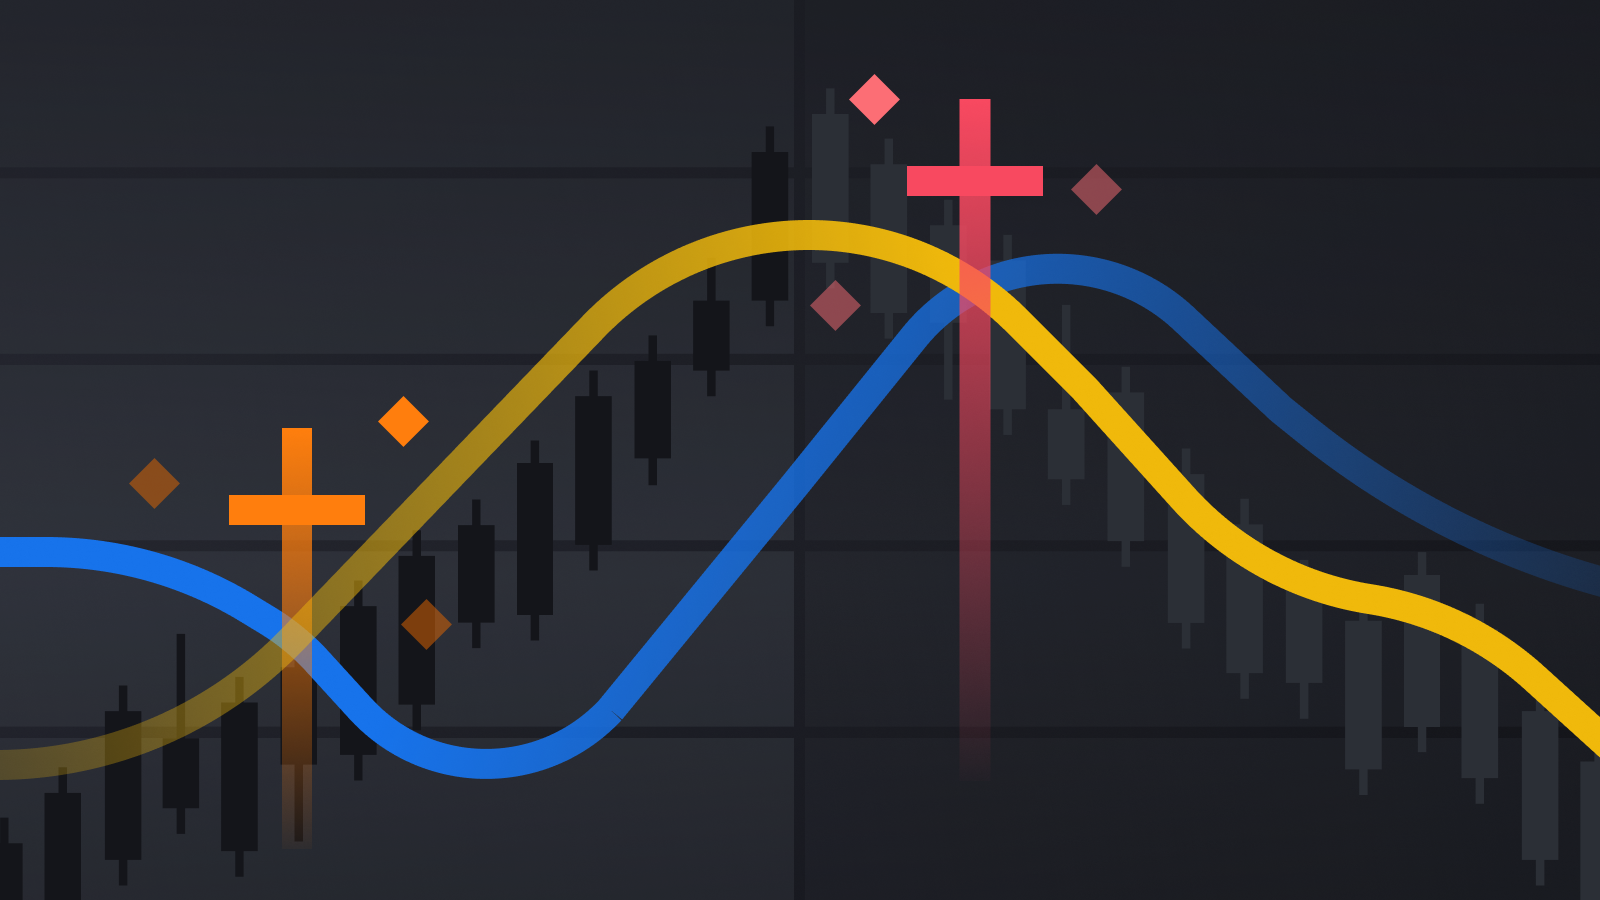
Golden Cross technical indicator signals a potential bullish trend reversal or continuation

A Golden Cross is a basic technical indicator used in financial markets, particularly in the analysis of stock prices. It is formed when a shorter-term moving average crosses above a longer-term moving average, signaling a potential bullish trend reversal or continuation. Here’s a step-by-step explanation of how a Golden Cross is formed and interpreted: Moving … Read more

Technical Update 05-21-2023 DJIA & S&P500

TECHNICAL ANALYSIS Major Indices Week of May 19, 2023 Stocks traded another volatile week with prices setting a key low in the CRITICAL cycle timing dates of Monday-Tuesday and then rallied sharply to carry the S&P500 into a new yearly high and the Nasdaq to the highest levels since April 2022. The selloff on Friday … Read more

Technical Update 05-14-2023 DJIA & S&P500

TECHNICAL ANALYSIS Major Indices Week of May 12, 2023 United States Michigan Consumer Sentiment Stocks ended the week mostly lower for the blue chips and the S&P while tech continued to lead the overall market. Prices were actually in relatively tight weekly ranges with the Dow closing the week down -1.10%, S&P500 down -0.30%, the … Read more

Technical Update 05-07-2023 DJIA & S&P500

Timing TECHNICAL ANALYSIS Major Indices Week of May 5, 2023 Note: For the latest update on the US Dollar, click here. Stocks set a swing high in Monday’s minor timing and then swooned sharply to four week lows (on Thursday’s key timing) before staging a sharp rally on Friday to erase much of the week’s … Read more

Double Bottom chart pattern

A double bottom pattern is a technical analysis charting formation showing a major change in trend from a prior down move. Its bullish reversal pattern, because it signifies the end of a downtrend and a shift towards an uptrend. The double bottom pattern looks like the letter “W.” The twice-touched low is considered a support … Read more