Chart patterns type 1 – Head and Shoulders

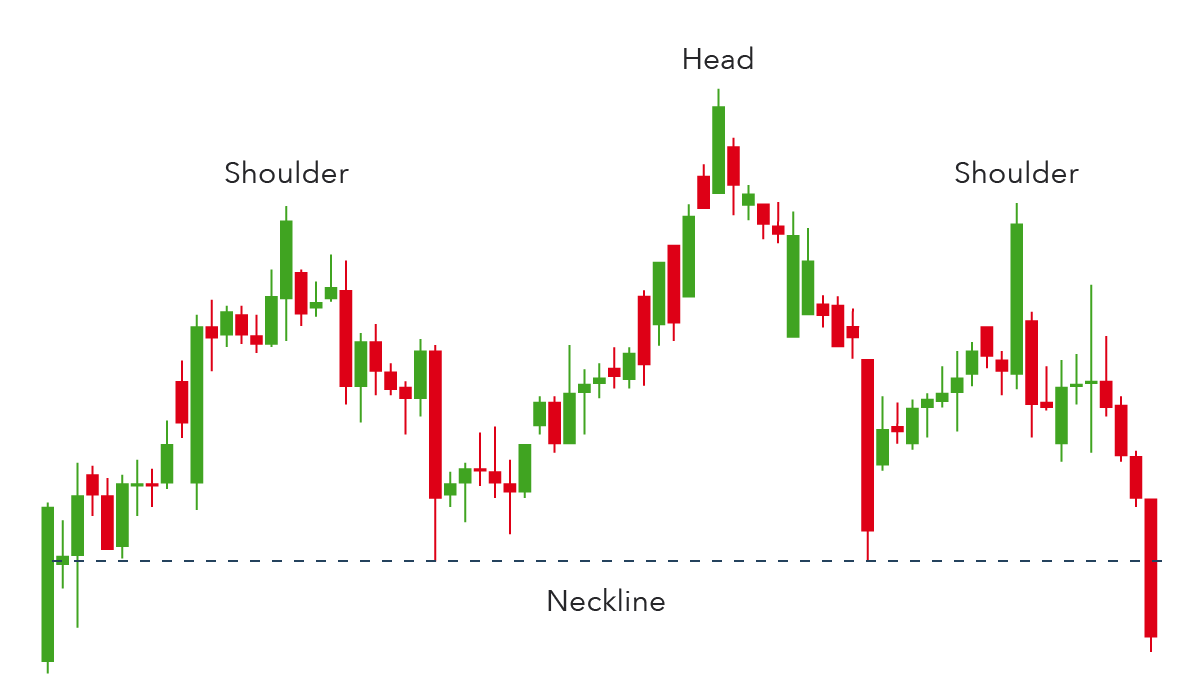
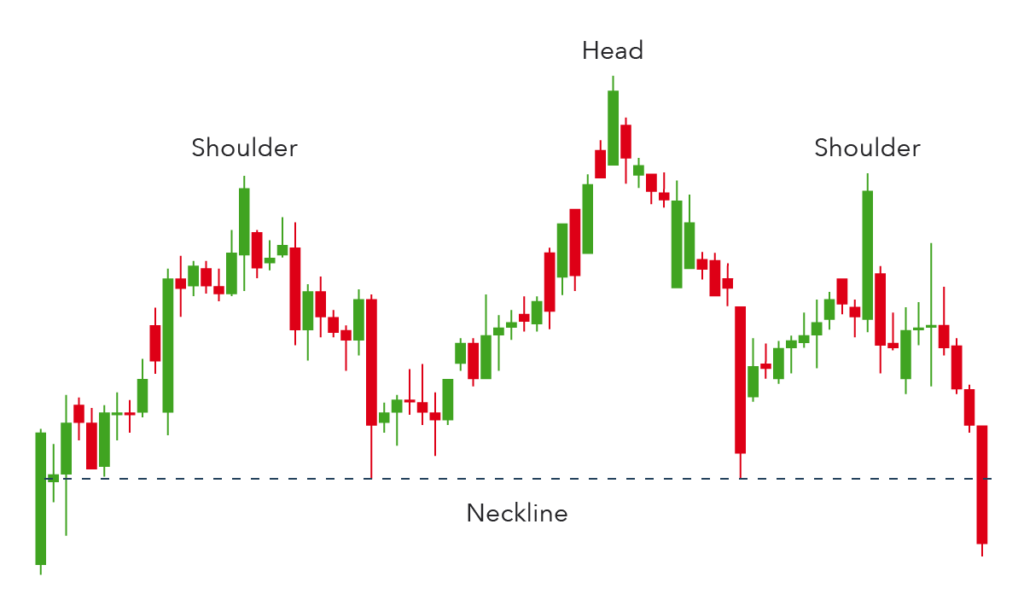
Head and shoulders is a chart pattern in which a large peak has a slightly smaller peak on either side of it.

What its used for/ to predict a bullish-to-bearish reversal.

What to look for/ the first and third peak will be smaller than the second, but they will all fall back to the same level of support, otherwise known as the ‘neckline’. Once the third peak has fallen back to the level of support, it is likely that it will breakout into a bearish downtrend.
Journal

VMSI INDEX

Cyclicals Lead, Hedging Slows, VMSI Signals Institutional Confidence Growing

July 24, 2025 | VICA Research — Volatility & Market Sentiment Index |  VICA Partners’ VMSI© (Volatility & Market Sentiment ...
VMSI INDEX

Housing Market: Late-Cycle Strain, Repricing Likely by 2026

Sources: National Association of REALTORS®, BLS, VMSI The U.S. housing market is showing clear late-cycle characteristics. Prices remain elevated, yet ...
News

Mandate Clarity Is Monetary Power

By VICA Partners | July 2025(Peer-reviewed by institutional market strategists and asset managers) The Federal Reserve’s policy efficacy is increasingly ...