Chart patterns type 1 – Head and Shoulders

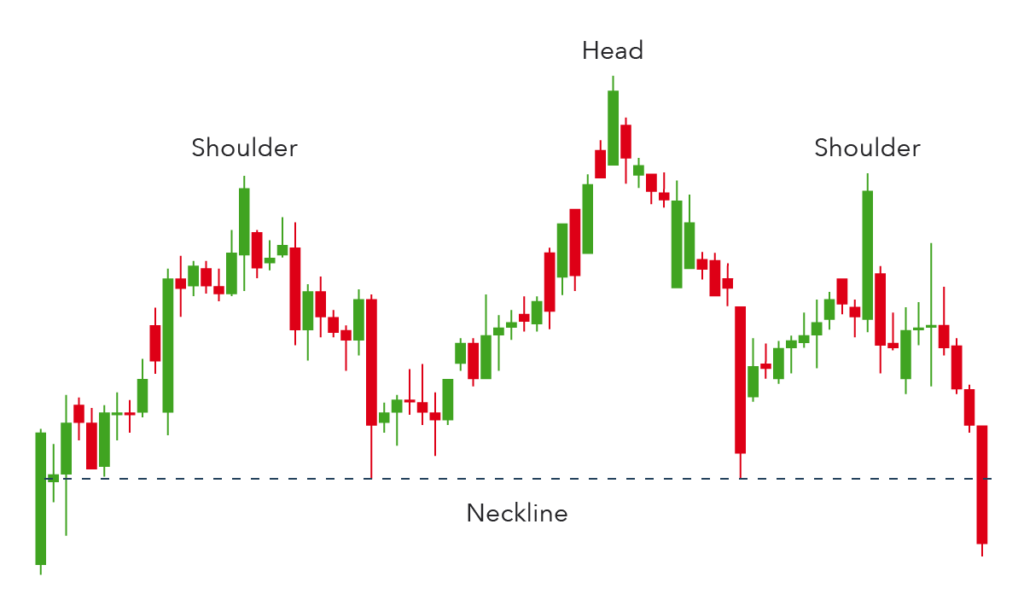
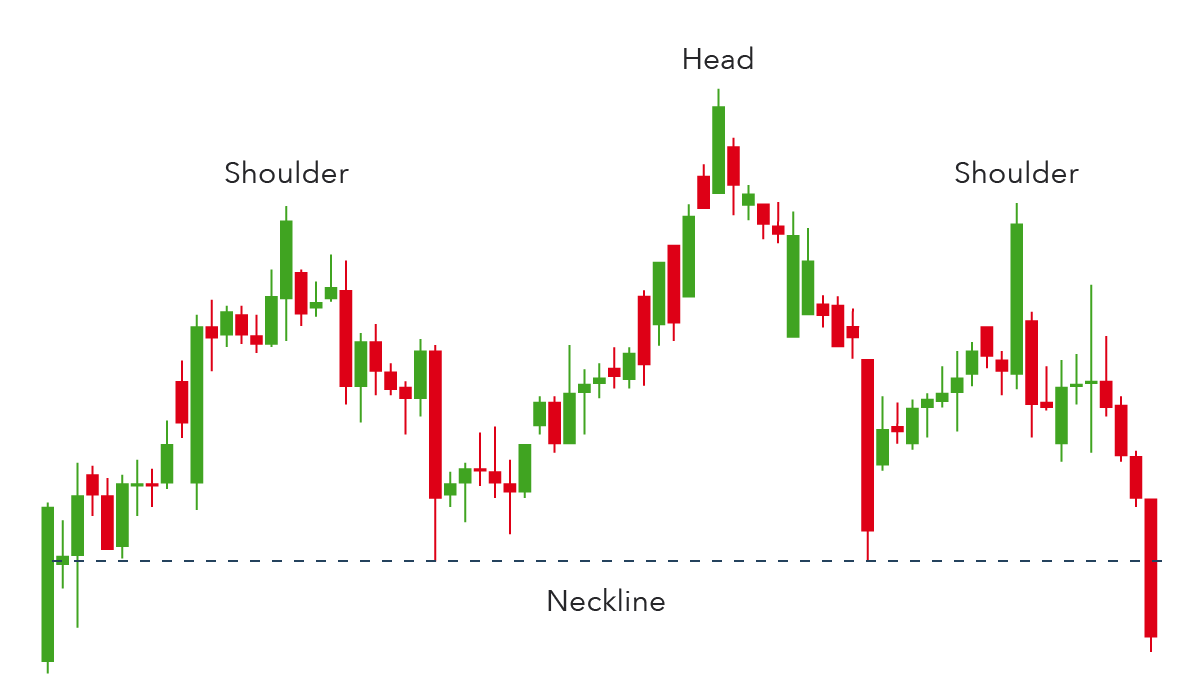
Head and shoulders is a chart pattern in which a large peak has a slightly smaller peak on either side of it.

What its used for/ to predict a bullish-to-bearish reversal.

What to look for/ the first and third peak will be smaller than the second, but they will all fall back to the same level of support, otherwise known as the ‘neckline’. Once the third peak has fallen back to the level of support, it is likely that it will breakout into a bearish downtrend.

Journal

VMSI INDEX

The Persistence Premium

VMSI™ Institutional Market Intelligence Report — FORCE-12.2 Institutional Edition Week Ending October 23, 2025 The Persistence Premium Liquidity Buys Time ...
VMSI INDEX

The Calm Holds — Credit Is the Fuse

VMSI™ Institutional Market Intelligence Report — FORCE-12.2 Institutional Edition. Week Ending October 16 2025 The Calm Holds — Credit Is ...
VMSI INDEX

Liquidity Rules, Credit Waits — The Calm Before Convexity

VMSI™ Institutional Market Intelligence Report — FORCE-12 Institutional Edition Week Ending October 9 2025 Theme: Liquidity Rules, Credit Waits — ...