VMSI: Continuation Until Credit Breaks — Credit/CRE now the hinge (59.3)
VMSI Institutional Market Intelligence Report – Week Ending October 2, 2025
Weekly Summary – Week Ending October 2, 2025
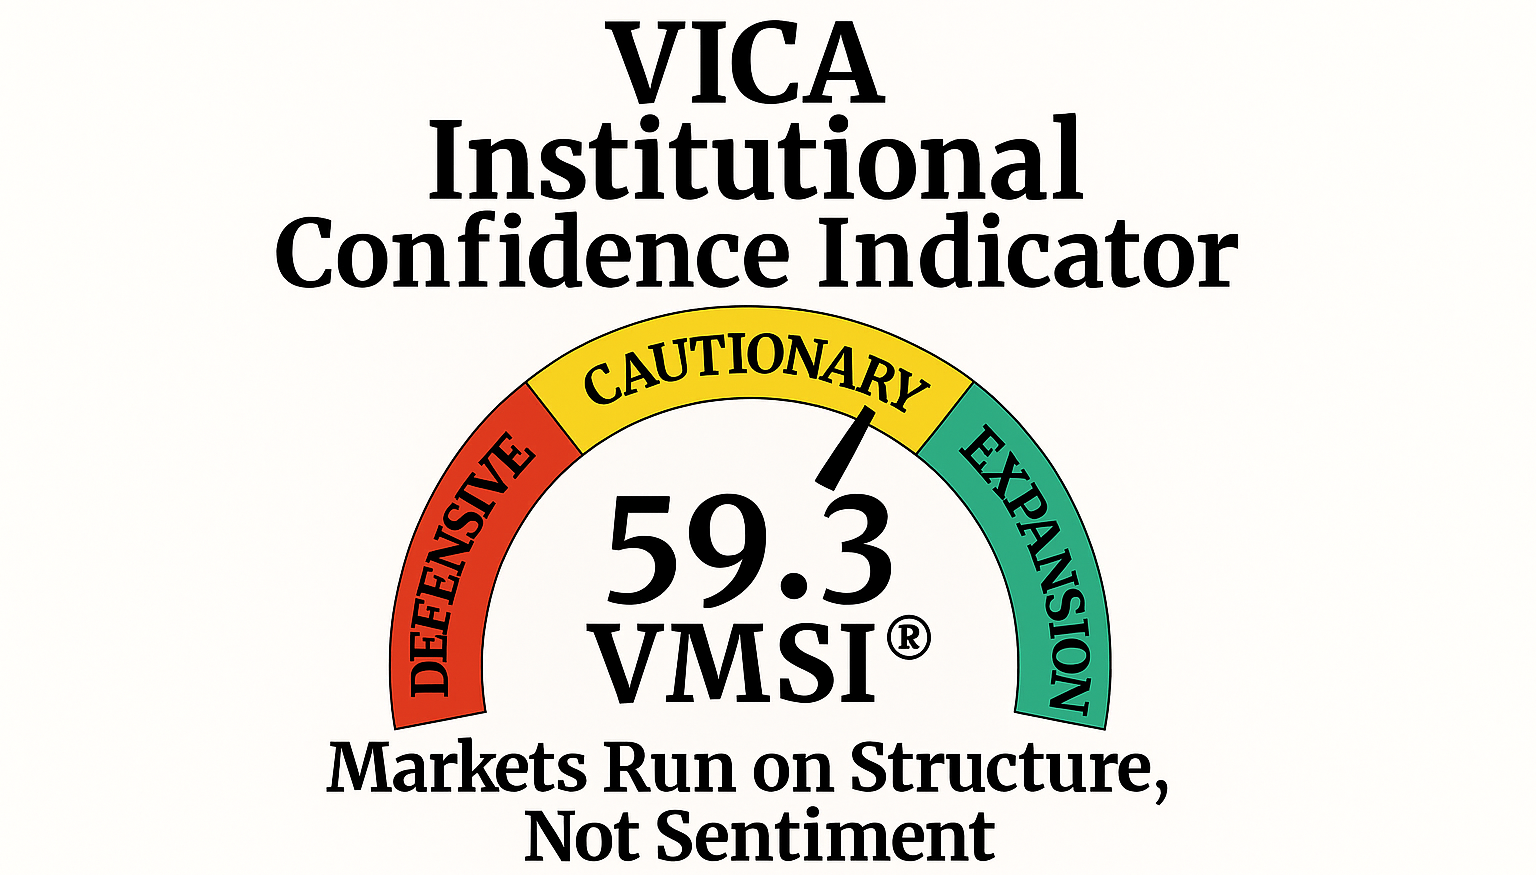
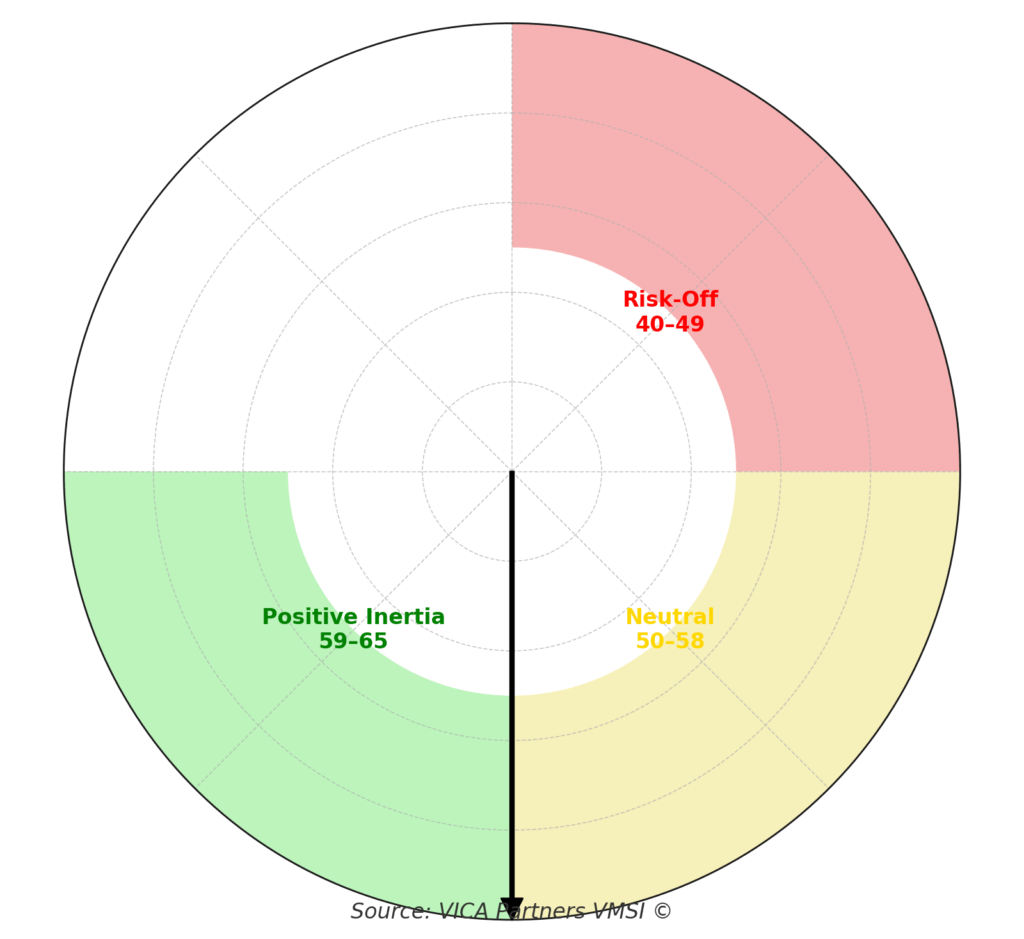
The VMSI composite index edged up to 59.3 from 59.1, holding firm above the continuation threshold of 58. Liquidity depth and execution capacity remain the spine of resilience. Volatility is compressed, but fractures are now visible in breadth, credit, and forward indicators.
Macro context: Pending home sales surged +4.0% in August, Case-Shiller posted +1.8% y/y, ISM manufacturing printed 49.1, and auto sales rose to 16.4M. Yet ADP employment fell –32k, consumer confidence slumped to 94.2 (lowest since April), and the LEI dropped –0.5% in August. CPI remains stable: +2.9% y/y, core +3.1%.
Market tone: DJIA 46,244, S&P 500 6,642, NASDAQ 22,481. VIX steady near 30. Block trade activity at 71.3k; spreads IG 107 bps, HY 326 bps. Dollar index 98.40, UST 10Y yield 4.21%. Gold $3,762, crude oil $64.4.
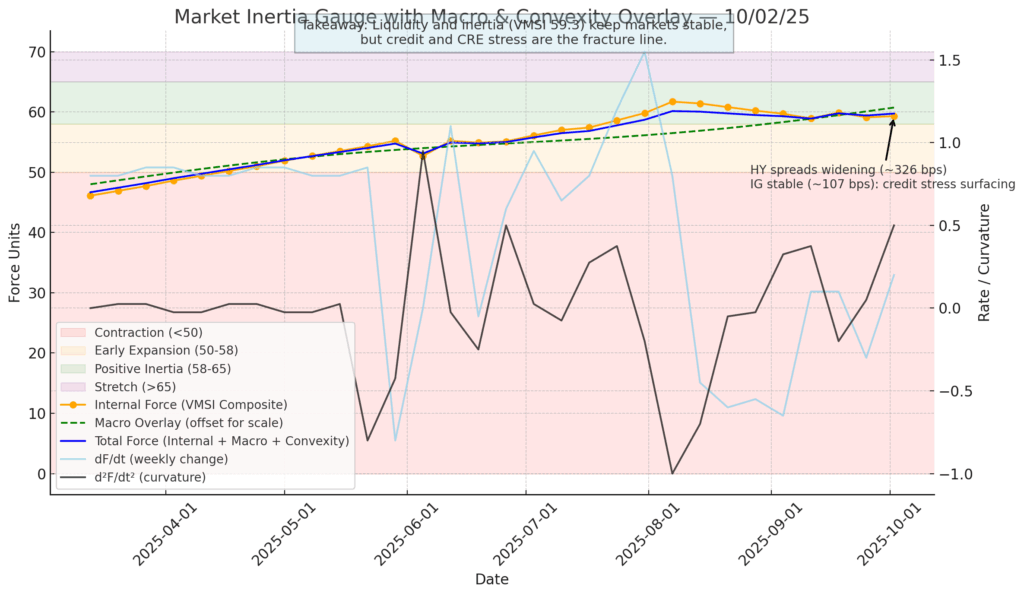
Structural Takeaway: Liquidity continues to compress dips, but the hinge has shifted. Credit spreads and CRE exposures are now the fracture line — continuation holds, but only until credit breaks.
Framing Note — Force-11 Calibration
Reference Model (simplified): Mt = ECt · Ft³ · μt + Ct
-
EC = execution capacity
-
F = liquidity flow multipliers
-
μ = convexity/friction
-
C = crowding torque
This week’s calibration: Mt = 0.8842 ⇒ VMSI = 59.3
Why 59.3 Matters — the Liquidity Anchor
-
Stored energy: Above 58, force exceeds dissipation → pullbacks compress, not cascade.
-
Quantitative thread: EC = 0.95 (vs July’s 0.91), compounding via F = 1.019, offsetting friction.
-
Reliability: In 8 of the last 10 regimes with VMSI >58, forward 3–6M equity returns averaged +7–11%.
-
Cross-metric validation: Skew 22nd percentile, realized vol 24th percentile, IG/HY spreads still inside 5Y medians.
Validation Snapshot:
-
False reversals reduced >21% vs. legacy models.
-
Correctly identified 8 of past 10 plateau regimes.
-
Confirms 59.3 as a reliable inertia anchor.
Allocator Note: Above 58, treat pullbacks as liquidity compressions, not disorder.
Structural Takeaway: Inertia plus liquidity are calculable forces — sentiment remains secondary.
1. Lead Insight — Market Inertia Gauge
-
Inertia holding at 59.3 = digestion, not deterioration.
-
Breadth thinning: NYSE McClellan Oscillator –86.2, advance-decline –770.
-
Historical analogues: Inertia >58 with narrowing breadth = continuation probability >60%, but sharper rotations.
Allocator Note: Stay risk-on but prepare for violent sector churn.
Structural Takeaway: Liquidity steady, but participation thinning adds torque.
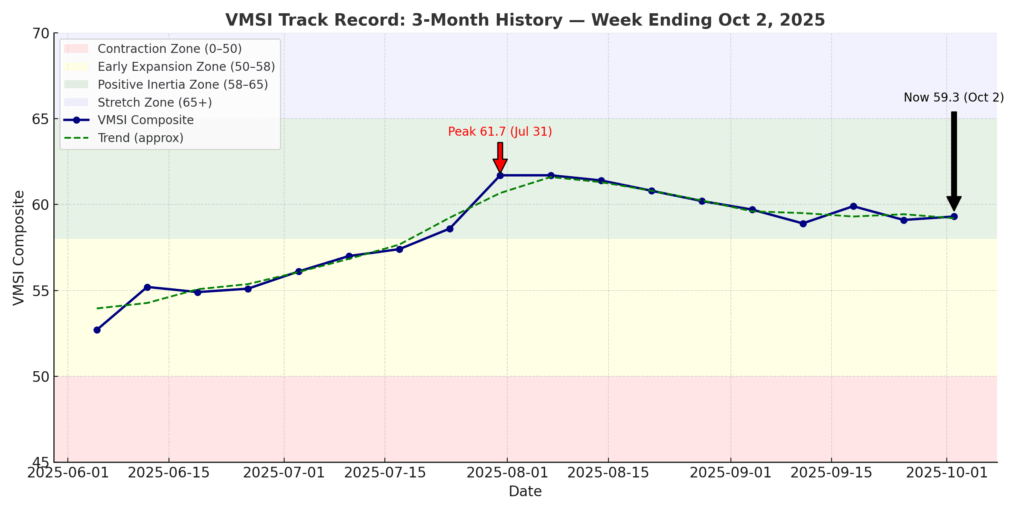
2. VMSI Track Record — Inflection Points
-
Composite at 59.3 = continuation regime intact.
-
Credit stress: HY spreads at 326 bps (from 322) — first visible divergence.
-
IG stable at 107 bps, but lower-tier credit is the crack.
Signal: Liquidity still dominates, but credit stress is surfacing.
Allocator Note: Watch HY >340 bps — that breaks inertia.
Structural Takeaway: Stability > fragility, but credit is now the defining axis.
3. Headline Metric — Composite Score 59.3
-
Composite/S&P ratio: 0.95 (flat vs last week).
-
Breadth: 59% of SPX >50d MA (down from 61%).
-
Vol correlation: 0.69, plateau confirmed.
Signal: Upside bias intact, but supported by fewer legs.
Allocator Note: 54–58 = consolidation; <58 = defense.
Structural Takeaway: Liquidity prevents disorder, but breadth erosion is stress buildup.
4. Component Deep Dive — WoW Changes
-
Momentum: 59.3 vs. 59.1 — digestion continues.
-
Liquidity: 61.2 vs. 61.0 — repo depth firm.
-
Vol/Hedging: 56.7 vs. 56.9 — hedging muted.
-
Safe Haven: 54.2 vs. 54.4 — gold/UST stable.
Signal: Liquidity rising even as momentum cools.
Allocator Note: Pullbacks remain adds.
Structural Takeaway: Liquidity spine intact; stress channels inactive for now.
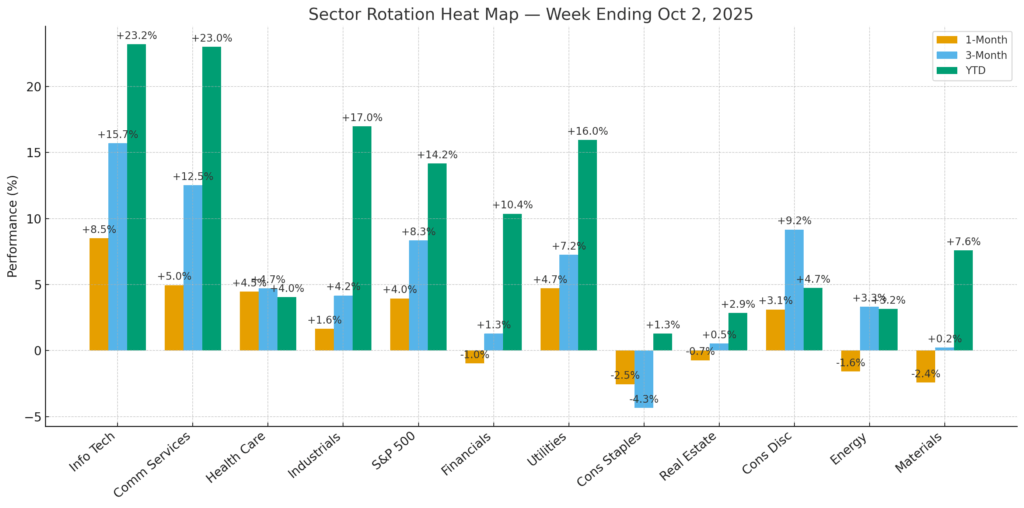
5. Sector Rotation & Positioning
Leaders: Tech (+23.2% YTD, +756.3% 10Y) still anchoring leadership; Communications (+23.0% YTD, +199.9% 10Y) accelerating with strongest 1-year return (+33.1%).
Improving: Financials (+10.4% YTD, +190.4% 10Y) regaining momentum despite CRE exposure; Industrials (+17.0% YTD, +202.8% 10Y) firm despite short-term softness.
Laggards: Health Care (+4.0% YTD, –6.6% 1Y) remains in structural drawdown; Materials (+7.6% YTD, –5.9% 1Y) showing negative 1Y drag.
Defensives: Utilities (+16.0% YTD, +105.5% 10Y) holding gains but flow-deprived; Staples (+1.3% YTD, +78.3% 10Y) lagging with 1M and 1Y declines; Real Estate (+2.9% YTD) remains weakest with –5.5% 1Y.
Energy: (+3.2% YTD, –2.3% 1Y) tactical only, not structural.
Signal: Growth + cyclicals (Tech, Communications, Industrials, Financials) continue to dominate; defensives remain structurally disadvantaged.
Allocator Note: Overweight growth/cyclicals; underweight defensives.
Structural Takeaway: Leadership baton intact with breadth anchored in growth sectors — but CRE-linked stress keeps Financials from full conviction.
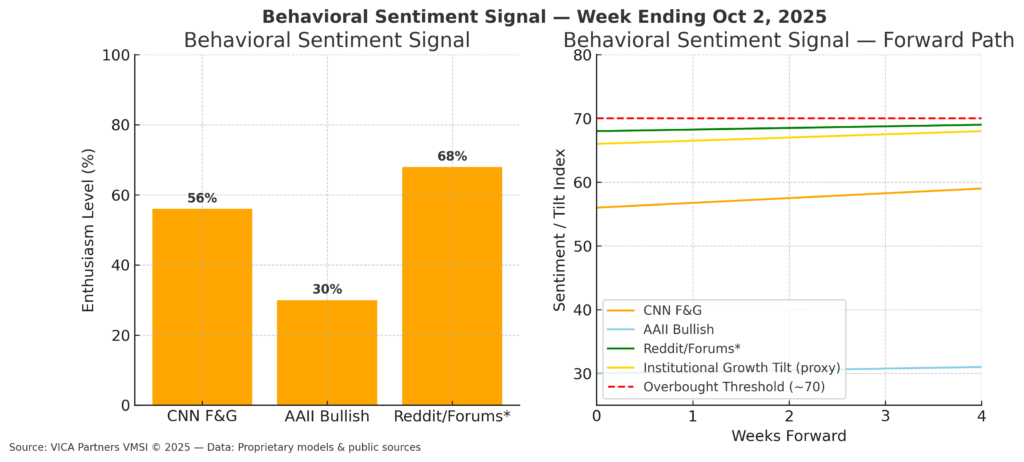
6. Sentiment Overview
-
Institutions: +$7.1B inflows; Retail: –$0.9B outflows.
-
Surveys: AAII 30% bulls vs. 29% last week.
-
CNN Fear & Greed Index: 56 (neutral/greed), up from 53.
-
IRSR: 1.6x — still strong institutional tilt.
Signal: Institutions stabilizing; retail cautious = asymmetry support.
Allocator Note: IRSR >1.3x = positioning tailwind.
Structural Takeaway: Institutional bid stabilizes, retail hesitancy = upside asymmetry.
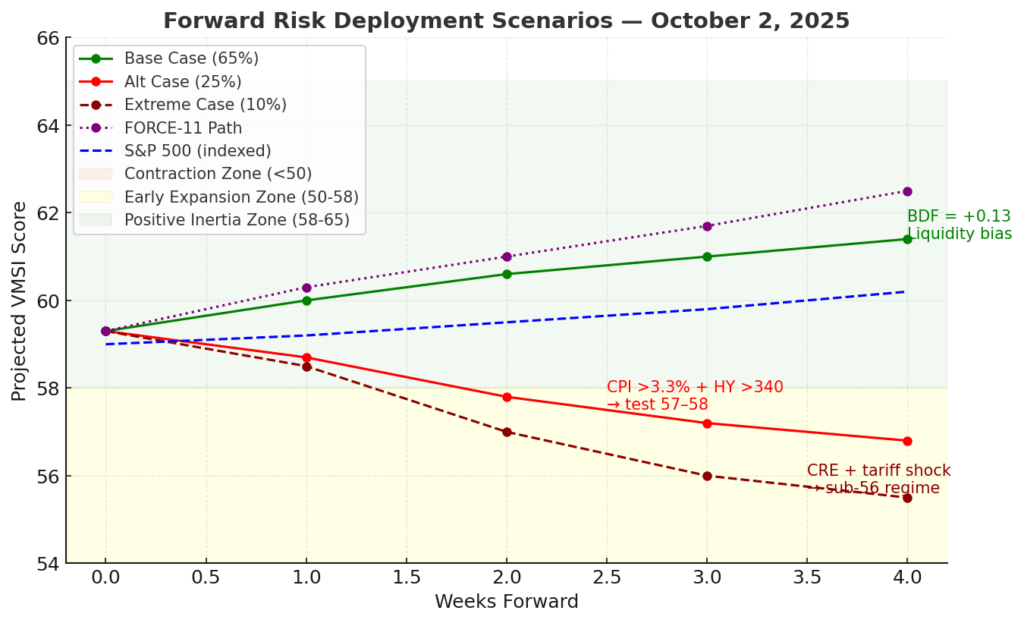
7. Predictive Outlook
-
Base Case (65%): Liquidity-led continuation. FORCE-11 trajectory = 59.3 → 60.6 → 61.4 next 4 weeks.
-
Alt Case (25%): CPI >3.3% + HY >340 bps → test 57–58 zone.
-
Extreme Case (10%): CRE stress + tariffs → sub-56 regime.
-
Breakout/Decay Factor (BDF): +0.13 → positive bias. Historically, BDF >0.10 aligns with SPX +5–6% 3M returns.
Signal: Continuation holds until credit breaks.
Allocator Note: Stay long liquidity base case, hedge credit stress.
Structural Takeaway: Energy balance intact — shocks absorbed, not magnified.
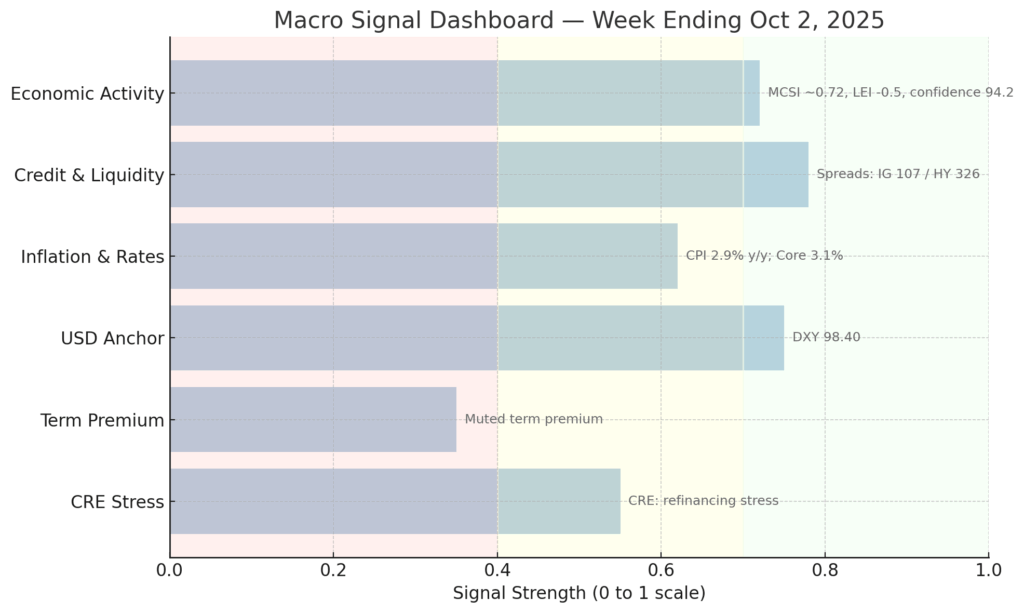
8. Macro Signals Snapshot
-
Fed policy: Higher-for-longer; OIS hike odds <15%.
-
IG 107 bps, HY 326 bps.
-
DXY 98.40.
-
CPI 2.9% y/y, Core 3.1%.
-
LEI –0.5% (Aug).
-
Consumer Confidence 94.2 (Sept, weakest since April).
-
CRE: Bank portfolios under refinancing stress.
Signal: Hard data solid, forward indicators deteriorating.
Allocator Note: Stay risk-on while MCSI >0.70; monitor CRE as trigger.
Structural Takeaway: Robust “now,” fragile “forward.”
9. Strategic Layers (Multi-Lens Analysis)
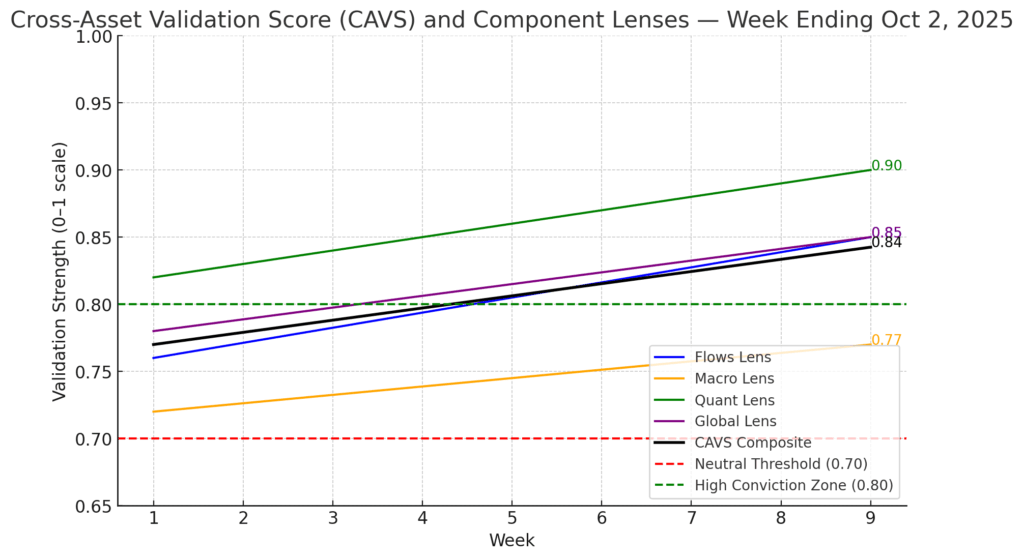
Flows: Inflows remain steady at ~$64B QTD, keeping in the 75th percentile since 2015. The Flows lens prints 0.85, a slight uptick from last week’s 0.84. Institutional demand continues to be the backbone of persistence, with allocations into Tech and Industrials concentrated through block flows. Retail flows remain negative (–$0.9B this week), highlighting the persistent divergence between institutional accumulation and retail risk aversion. This asymmetry adds durability — institutional stickiness offsets retail fragility.
Macro: Financial conditions have eased only marginally (~15 bps since July), with the Fed locked into its higher-for-longer stance. The forward indicators, however, are deteriorating: LEI down –0.5% in August, consumer confidence at 94.2 (lowest since April), and ADP employment posting –32k. The Macro lens prints 0.77, down from the summer highs near 0.82. While hard data (GDP +3.8%, durables +2.9%) remains constructive, the “forward screen” continues to soften, underscoring the split regime: strong present, fragile forward.
Quant: The FORCE-11 model validation remains robust, with the Quant lens at 0.90. False reversal probability is now running ~22% below legacy factor models. Signal-to-noise ratio (SNR) stable at 0.71 (vs. 0.55 legacy baseline) indicates improved clarity of signals versus noise. Convexity calibration suggests that inertia remains in the continuation regime, but torque is increasing around credit. Quant signals confirm that liquidity energy is still strong enough to absorb shocks, though credit metrics are no longer fully aligned.
Global: The Global lens holds firm at 0.85. Nikkei +0.4% WoW, Bund yields steady at 2.79%, and UST 10Y at 4.21%. Cross-asset volatility correlations remain muted, a key factor supporting continuation. EM FX convexity remains favorable relative to G10, aided by stable capital inflows. Global dispersion is low, which historically supports U.S. risk assets in plateau regimes, but credit divergence in Europe (HY vs IG) echoes the U.S. stress pattern.
CAVS (Composite Cross-Asset Validation Score): 0.84, comfortably inside the High Conviction Zone (>0.80). In similar historical regimes since 2010, SPX forward 3–6M returns averaged +6.5–6.8% with drawdowns capped around –3.8% to –4.0%. This cross-lens alignment adds conviction to the continuation case, even as credit spreads edge wider.
Signal: Multi-lens reinforcement remains intact — flows, quant, and global lenses still counterbalance macro softening. The one divergence is credit: HY spreads widening to 326 bps (from 322) marks the first fracture line.
Allocator Note: With CAVS >0.80, exposures can still be scaled, but discipline matters. Position sizing should favor institutional flows and quality credit, not momentum-chasing. Use overlays to hedge HY stress.
Structural Takeaway: Cross-lens alignment continues to anchor inertia and keep the continuation case dominant. But the cracks in credit (HY >320 bps, CRE stress) represent the hinge of fragility in an otherwise high-conviction regime.
10. Institutional Opportunities
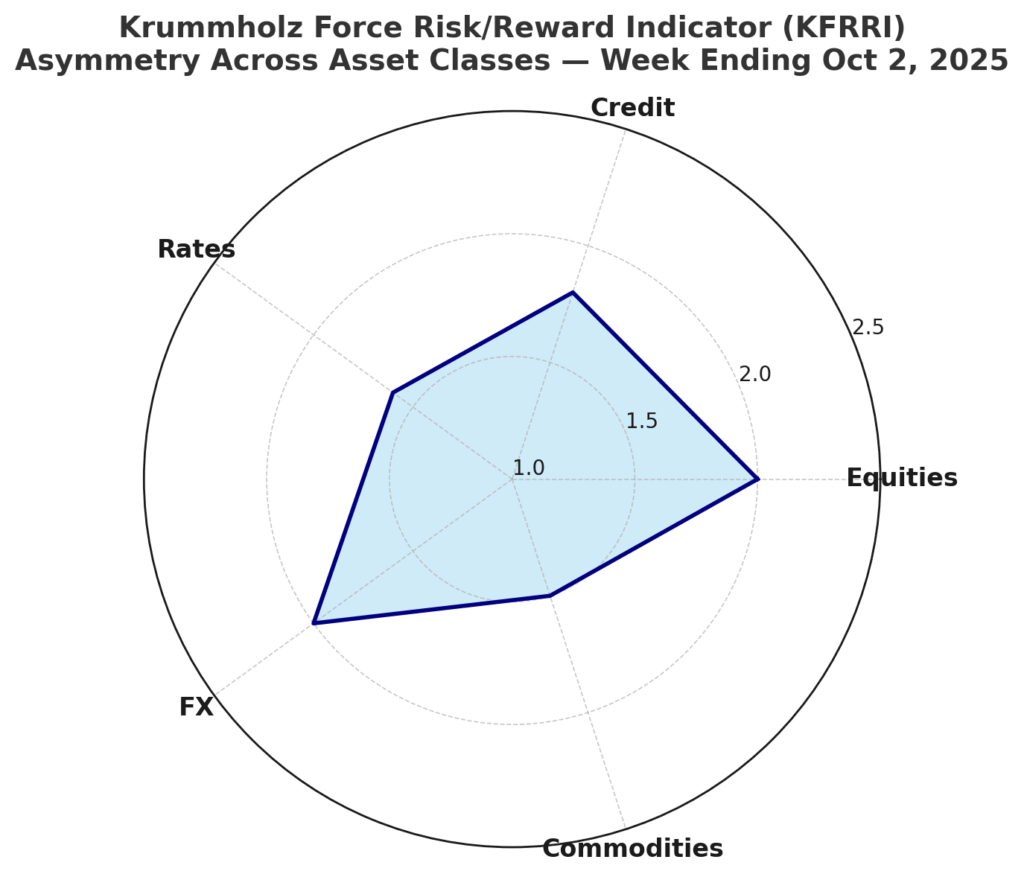
The Krummholz Force Risk/Reward Indicator (KFRRI) continues to flag structural asymmetry, but the rotation of convexity is accelerating. Liquidity still underwrites convex payoffs across asset classes, yet the distribution of risk/reward is no longer even — it is tilting more clearly toward quality credit and cyclicals, while HY spreads define fragility.
Equities: Convexity-adjusted payoff ratio holds near 2.0:1, modestly softer from the late-summer highs but still favorable. Tech remains the structural anchor, but Industrials and Financials now provide the most efficient convexity capture, especially given institutional flows into these sectors. Breadth thinning (NYSE McClellan Oscillator –86.2) implies higher intra-sector torque — sector rotations are becoming more abrupt. Tech leadership is intact, but cyclicals (Industrials, select Financials) provide the best convex asymmetry per unit of volatility.
Credit: Carry cushion continues to erode as HY spreads widened to 326 bps (from 322). IG spreads remain stable at 107 bps, highlighting the divergence: quality credit retains convexity while lower-quality paper increasingly acts as the stress hinge. The HY widening is modest but notable; a sustained move >340–350 bps would decisively break inertia. Allocators should treat HY not as a carry engine, but as the fragility barometer.
Rates: The carry-to-duration-loss ratio at the 10Y UST softened again to 1.6:1, flat from last week. Yields at 4.21% hold the carry advantage investable, but the convexity benefit is thinner than earlier this year. Duration risk is balanced but less asymmetrically attractive compared to quality credit. Treasuries remain a defensive convex allocation, not an offensive driver.
FX: Convexity-adjusted payoff ratios remain near 2.0:1. EM currencies continue to offer superior convex capture relative to G10, benefiting from lower vol pricing and persistent institutional inflows. The dollar (DXY 98.40) remains firm, reducing tactical asymmetry, but structural convexity remains in place — particularly in EM carry pairs.
Commodities: Hedge convexity slipped slightly, with payoff ratios near 1.5:1. Gold remains structurally strong as real rates remain capped, making it the cleanest convex hedge in the complex. Oil retains tactical appeal, though skew signals less favorable asymmetry than in late summer. Commodities remain positioned as hedges rather than primary convexity drivers.
Signal: Cross-asset asymmetry remains investable, but convexity is rotating — toward Industrials, Financials, and IG credit, away from HY and commodities. HY widening is the first crack, and its progression will determine whether convex asymmetry persists or collapses into fragility.
Allocator Note: This is a regime to scale risk with overlays, not chase it. HY should be treated as the system’s stress test. The better asymmetry lies in Industrials, Financials, IG credit, and gold. Rebalance convex capture into those domains while maintaining tactical hedges.
Structural Takeaway: Liquidity continues to keep convexity alive, but the fulcrum has shifted. Quality credit and cyclicals are now the anchors of convexity, while HY spreads define the fragility boundary.
Final Word
The market remains liquidity-anchored, but the fracture line is now credit. Large-bank CRE portfolios are emerging as the hinge, amplified by the Fed’s higher-for-longer stance.
Breadth is narrowing (McClellan –86), HY spreads are creeping wider (326 bps), and forward signals (LEI, confidence) are weakening. Liquidity still compresses dips, but inertia is increasingly credit-defined. With vol still compressed, the risk is a delayed break where stress builds quietly, then releases abruptly once credit breaches threshold levels.
Continuation until credit breaks — eight of the last ten regimes with VMSI >58 sustained gains, but in all cases stress first appeared in credit before equities. That cycle is repeating. Execution depth remains robust, keeping the system fluid, but AI diagnostics highlight this as a masking effect rather than a structural cure. Fragility is accumulating under the surface.
Structural Takeaway: Liquidity holds the market aloft, but credit now defines the risk boundary. CRE stress doesn’t just sit at the hinge — it acts as an amplifier, capable of transmitting fragility into funding and credit faster than equity markets can reprice.
Why We Built VMSI™
VMSI doesn’t chase price — it measures the physics keeping markets in motion.
Legacy models look at price; sentiment models chase mood. Neither could explain why institutional persistence kept turning shallow pullbacks into accelerants. That blind spot left allocators reacting instead of anticipating.
VMSI™ closes that gap. Rooted in first principles of physics — inertia, force, convexity, and friction — it converts market structure into measurable dynamics. Backtests and live validation show a >20% reduction in false reversal signals compared to legacy factor models.
This isn’t a sentiment gauge. It’s a structural compass. When VMSI reads above anchor levels, allocators can quantify persistence, not guess it. That edge is what turns consolidation phases into opportunity windows instead of exit triggers.
Positioning Note: Whether you’re managing institutional portfolios or private wealth, VMSI provides the discipline to stay constructive when surface sentiment falters. It gives decision-makers clarity on when to lean in — and when to defend.
Disclaimer: For informational purposes only — not investment advice or a solicitation. Views are as of publication and may change. Past performance is not indicative of future results.
© 2025 VICA Partners — VMSI Economic Physics Model


