
Decades in Review: Unveiling Stock Market Insights
Exploring the S&P 500’s performance across various timelines offers a concise glimpse into market trends.
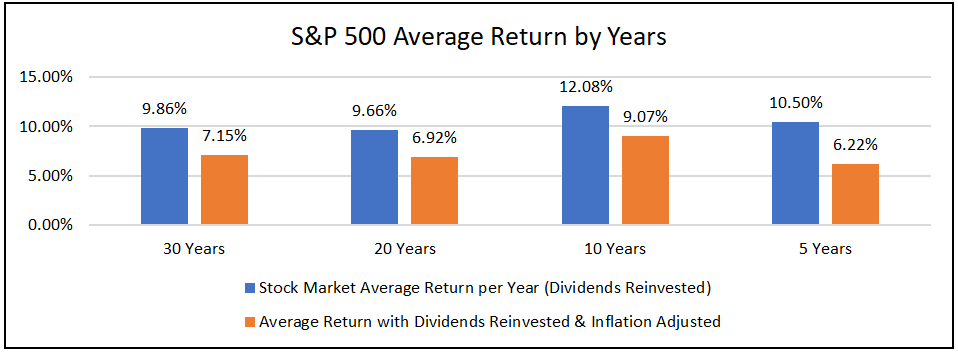
30-Year Snapshot: Stability Amid Growth
Over the last 30 years, up to September 2023, the S&P 500’s annualized return stands at 9.862%, assuming reinvested dividends. Adjusted for inflation, it holds steady at 7.146%. Without dividends, the figures are 7.831% and 5.165%, respectively.

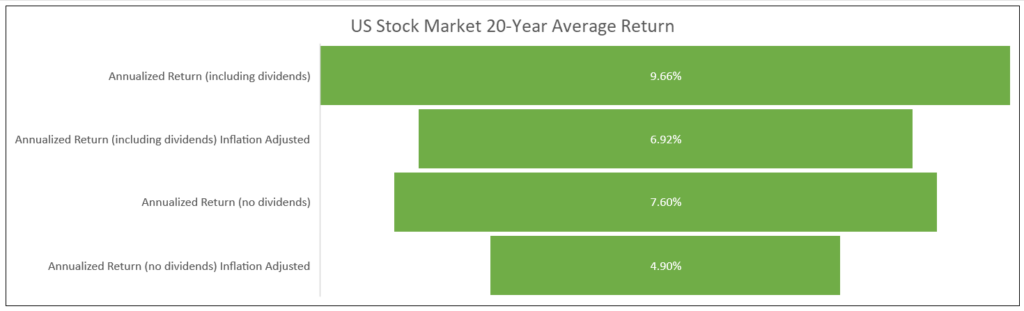
20-Year Perspective: Finding Balance
In the preceding two decades, the S&P 500 shows a 9.66% average yearly return, incorporating reinvested dividends. Adjusted for inflation, this stabilizes at 6.915%. Excluding dividends, the annualized return is 7.597%, with an inflation-adjusted figure of 4.904%.
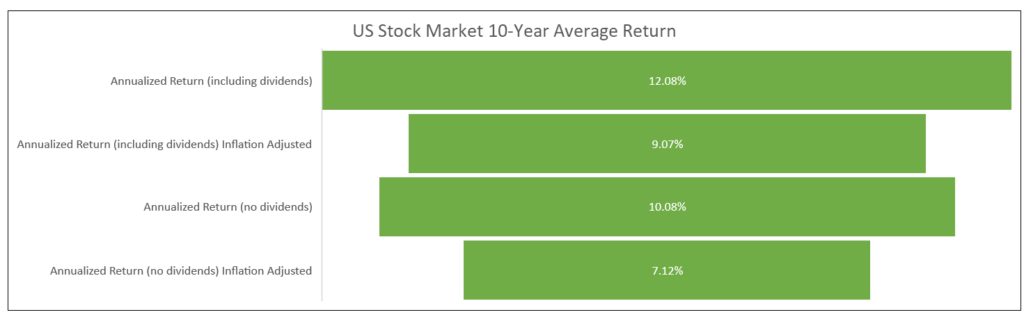
A Decade in Focus: The Roaring 2010s
In the most recent 10 years leading to September 2023, the S&P 500 impresses with a 12.078% average yearly return (assuming reinvested dividends). Factoring in inflation, this robustly adjusts to 9.066%. Without dividends, the annualized return is 10.083%, with an inflation-adjusted value of 7.124%.
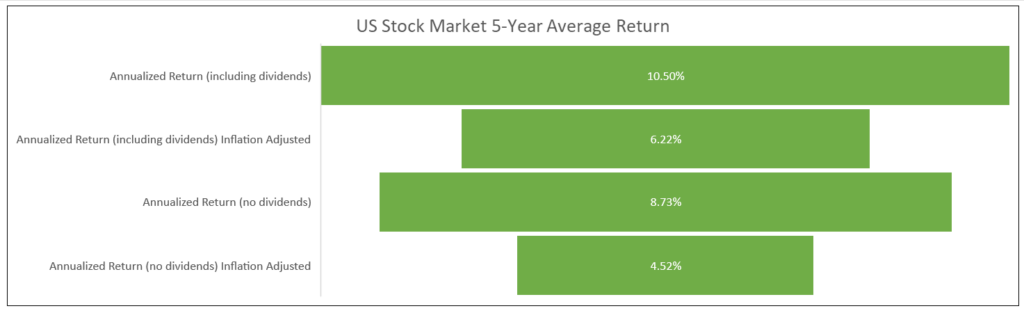
5-Year Exploration: Recent Trends
Examining the last five years, the S&P 500 delivers a 10.495% average yearly return, considering reinvested dividends. With inflation adjustments, this figure drops to 6.221%. Without dividends, the annualized return is 8.729%, and inflation-adjusted, it is 4.523%.
Market Realities: Beyond the Numbers
While statistics highlight consistent growth, the stock market’s non-linear trajectory is evident. Historical leaps occurred the 80s-90s, and the stretch from 2010 to 2021. Despite a dip in 2022 and early 2023, the market rebounded, remaining below previous highs.
Factors Shaping Returns
Considerations for long-term returns include minimizing expenses, reinvesting dividends, and recognizing portfolio composition impacts returns. Inflation’s impact emphasizes the need to stay ahead, with the S&P 500 historically outpacing inflation.


