
TECHNICAL ANALYSIS
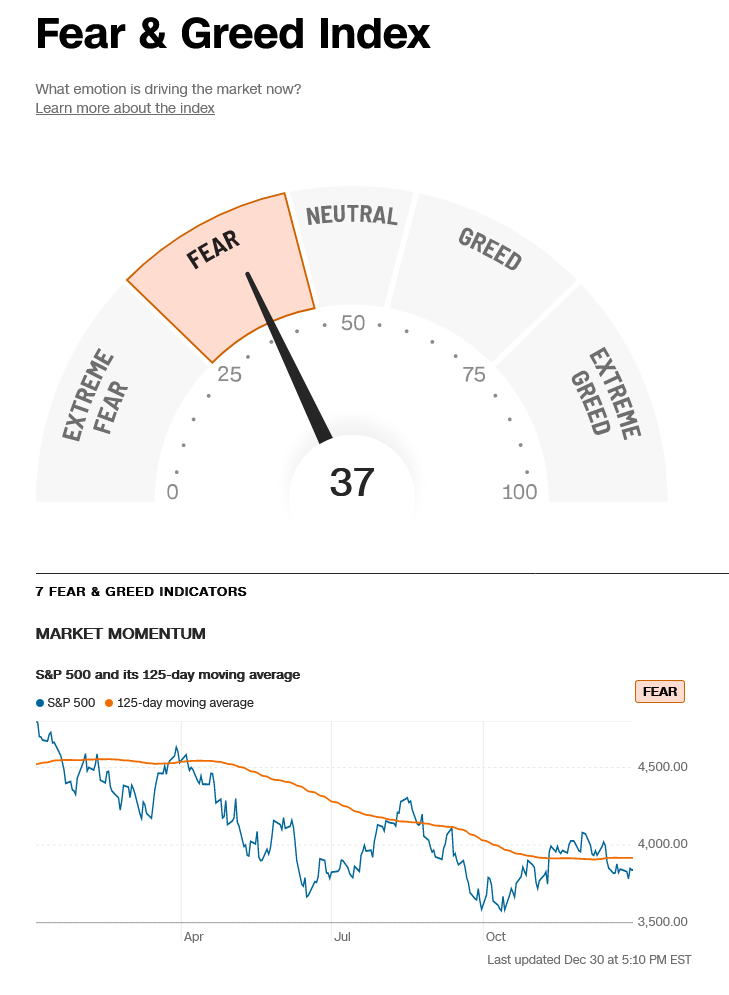
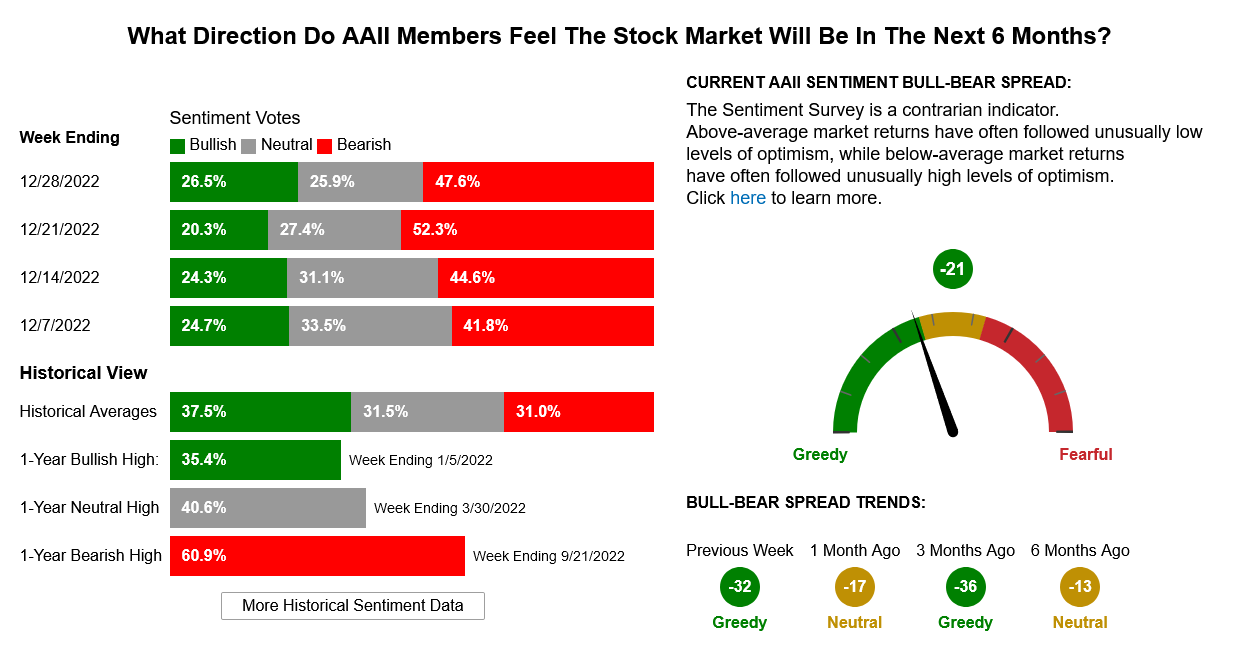
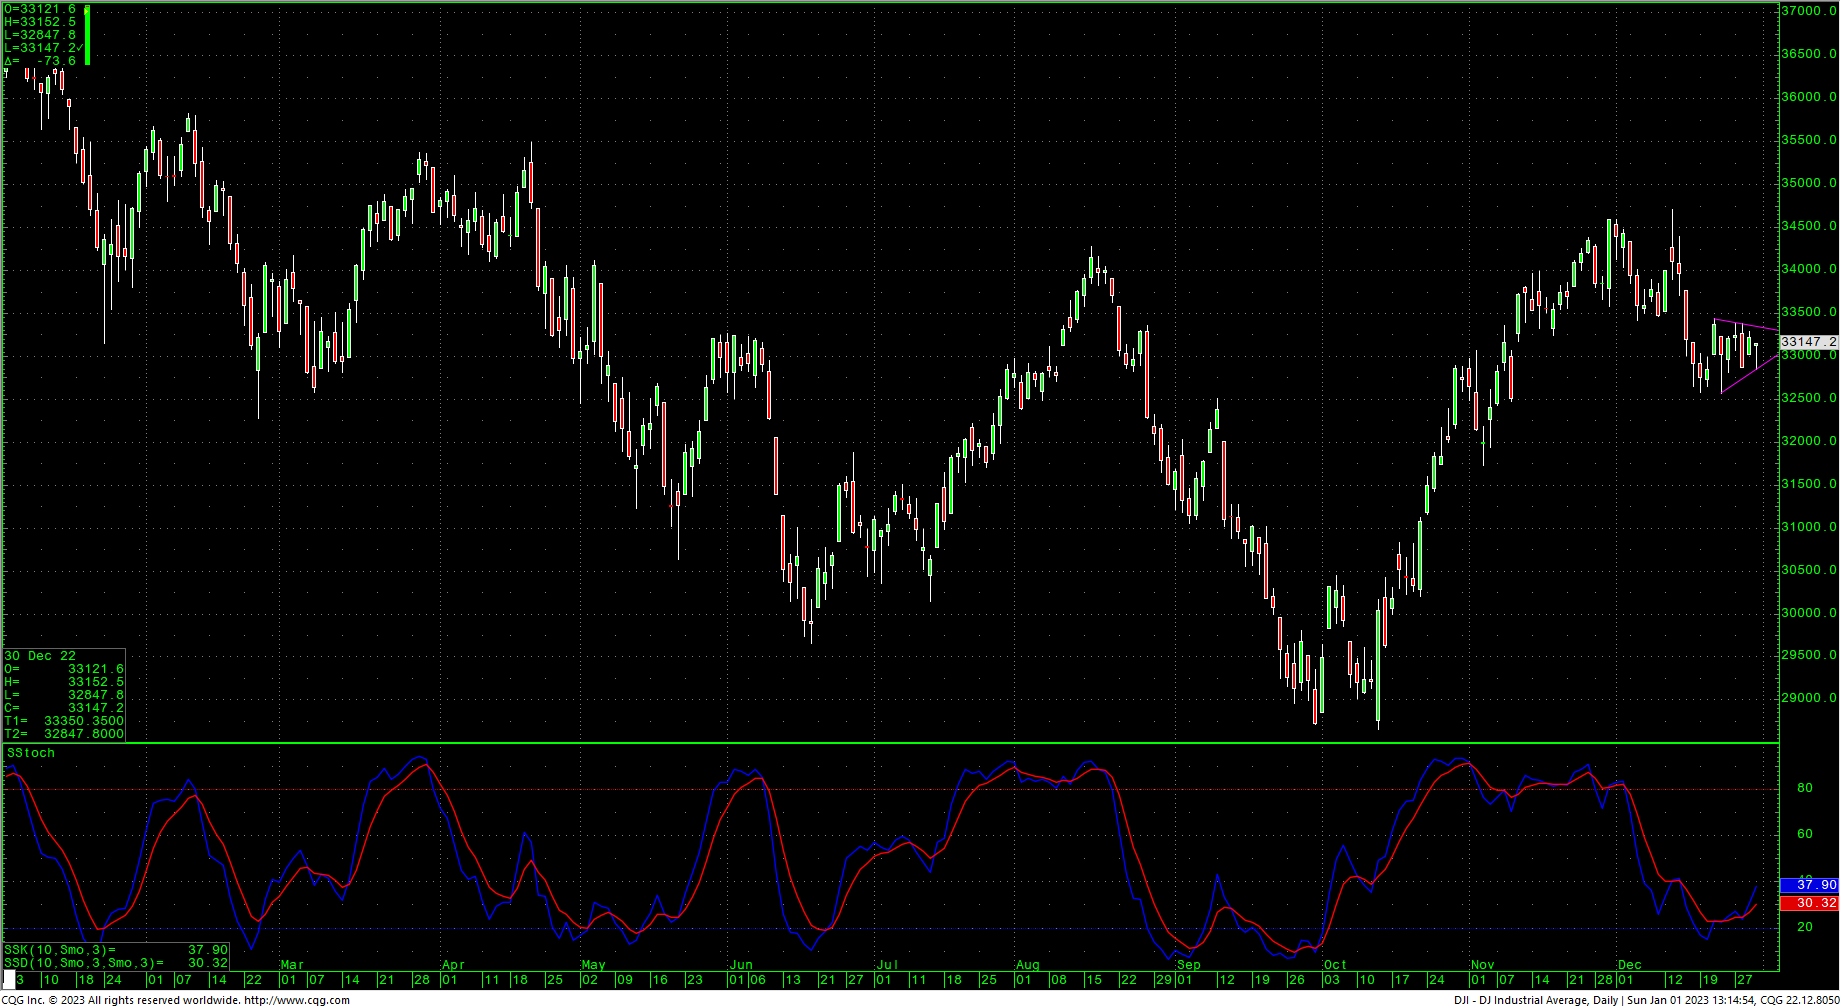
The DJIA traded a tight, inside week on quiet holiday volume and closed fractionally lower on the week. Short-term, prices are building a flagging triangle pattern off to the side of the recent decline. The hourly is trying to turn up from oversold conditions and the daily is doing the same. Conversely, the weekly has only just hooked down from overbought conditions as prices flirt with both the 21-week and 50-week moving averages on that chart. The recent selloff has taken sentiment back toward mostly ‘fear,’ although the 52-week High/Low remains relatively frothy…closing at -2.15% on December 30th.
Dow Jones Industrial Average Hourly HLC
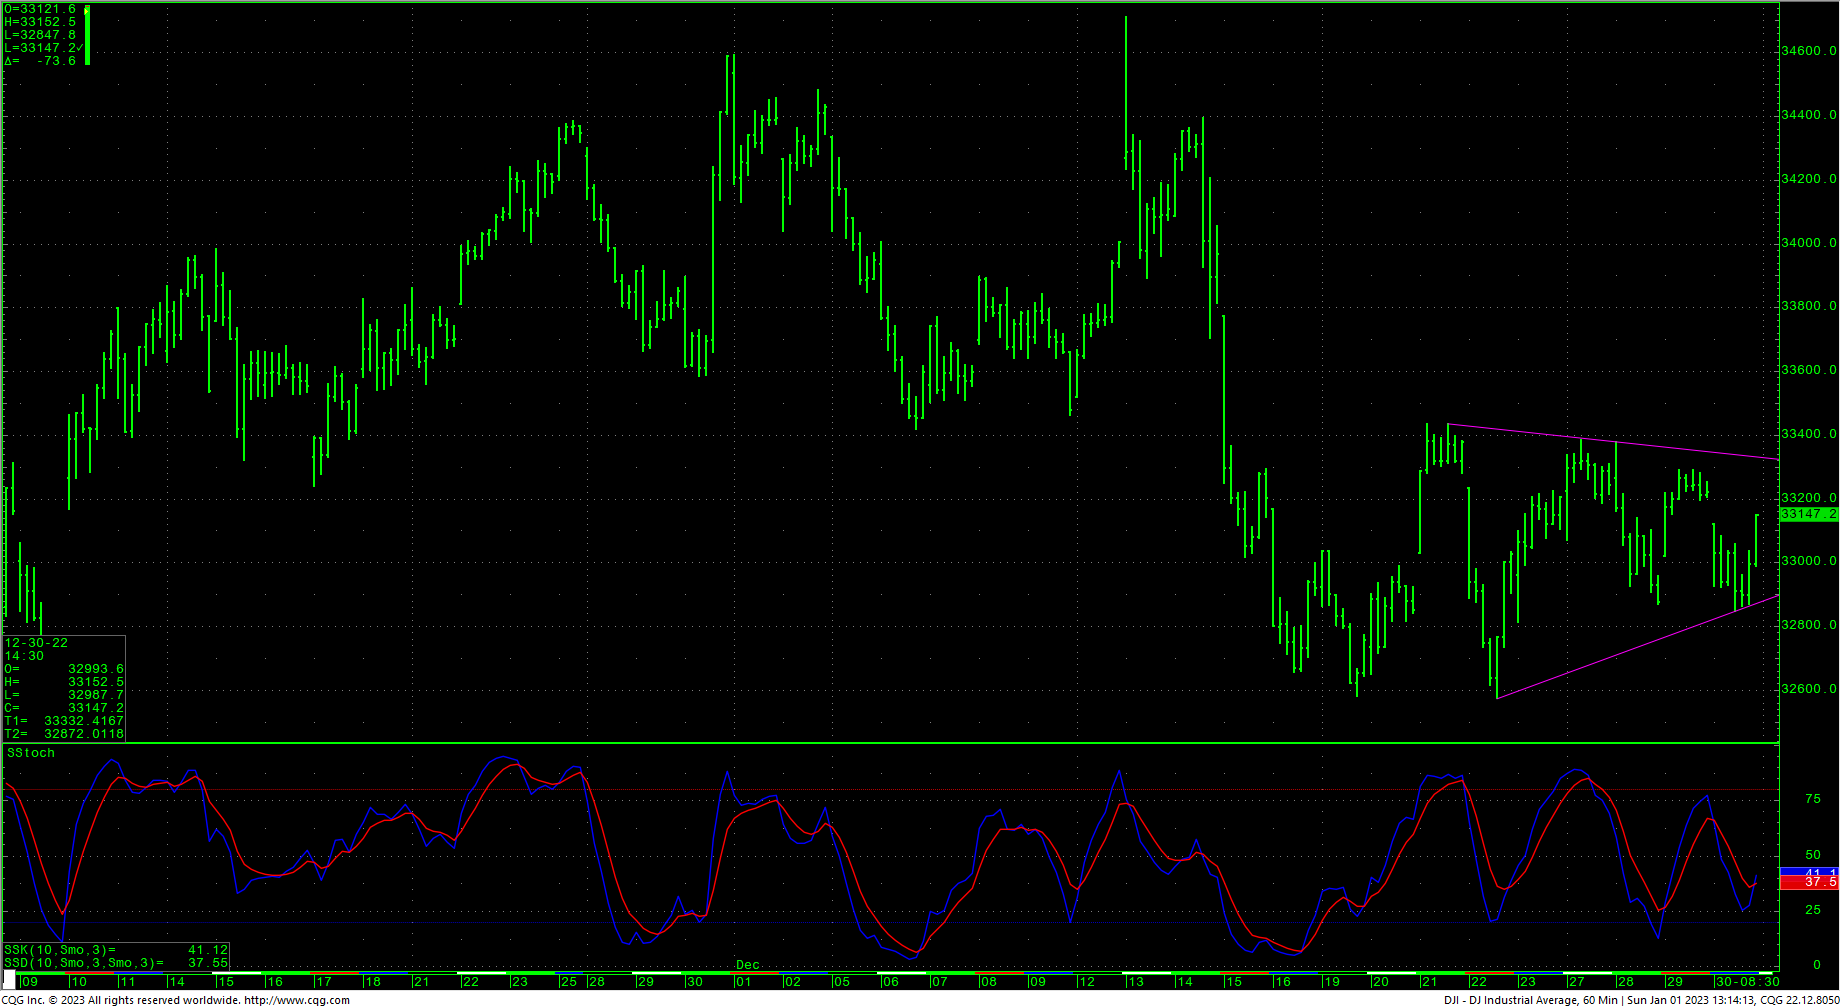
Support remains pivotal against 32867/32850 with critical short-term support just under the recent swing lows at 32473 through 32400.. with one more minor spot at 32343. A breakdown under 32343 opens counts to key short-term support of 32170. A breakdown with closes under 32170 sets up 32099 with longer-term potential toward 31727/31686. Closes under 31686 will open counts into the 30972/30960 level with support of 31423 and 31160.
CNN Fear & Greed Index
AAII Investor Sentiment
Dow Jones Industrial Average Daily Candles
Resistance is 33293, 33400/33436. A drive above 33436 should test 33564/33583 with potential to short-term key resistance at 33642/33650. Closes back over 33650 are near-term friendly and suggest a drive to critical short-term resistance at 33895/33910. Closes over 33910 are bullish and set up a move to 34177/34207. Above 34207 will test 34400 with a shot at the recent highs at 34712.
Resistance
- 33293 **
- 33400/33436 *** ↑
- 33522 **
- 33642/33650 *** ↑
- 33895/33910 *** ↑
- 34177/34207 *** ↑
- 34300 **
- 34400 ***
- 34700/34712 *** ↑
Support
- 32987 **
- 32867/32850 *** ↓
- 32800 *** ↓
- 32654 **
- 32573 *** ↓
- 32473/32400 *** ↓
- 32343 **
- 32324 *** ↓
- 32170 **
- 32099 ***
- 31727/31686 *** ↓
- 31423 ***

