
TECHNICAL ANALYSIS
The DJIA traded a massive outside week down with prices setting a new trading high Tuesday and then swooning 2057.7 points to close in the bottom portion of the week’s range for a total decline of 1.66%. As we pointed out in last week’s update, the hourly chart was showing a rounded top formation and that ”lower prices are in the immediate future.” At this point, the hourly is now deeply oversold and the market has dropped near to a very pivotal level of short-term support that runs from 32473 through 32400.
Dow Jones Industrial Average Hourly HLC
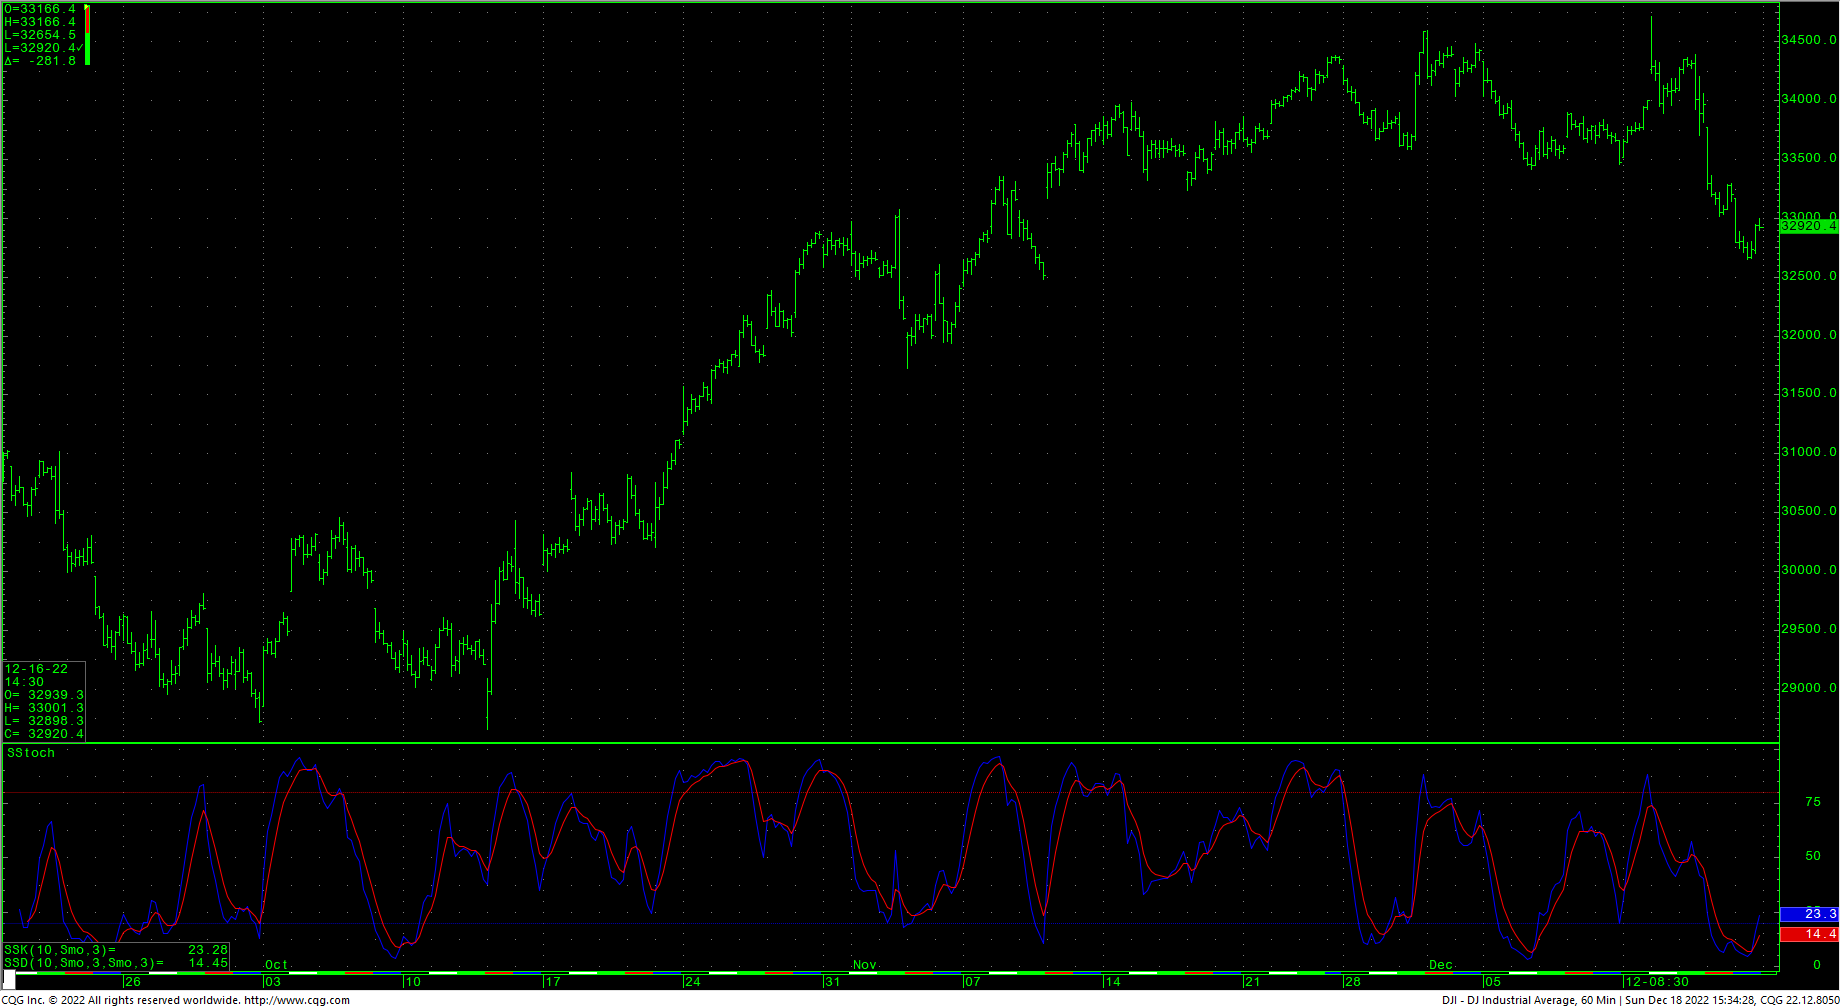
That area remains pivotal support with one more minor spot at 32343. A breakdown under 32343 opens counts to critical short-term support of 32867/32850. A breakdown with closes under 32850 set up 32099 with longer-term potential toward 31727/31686. Closes under 31686 will open counts into the 30972/30960 level with support of 31423 and 31160.
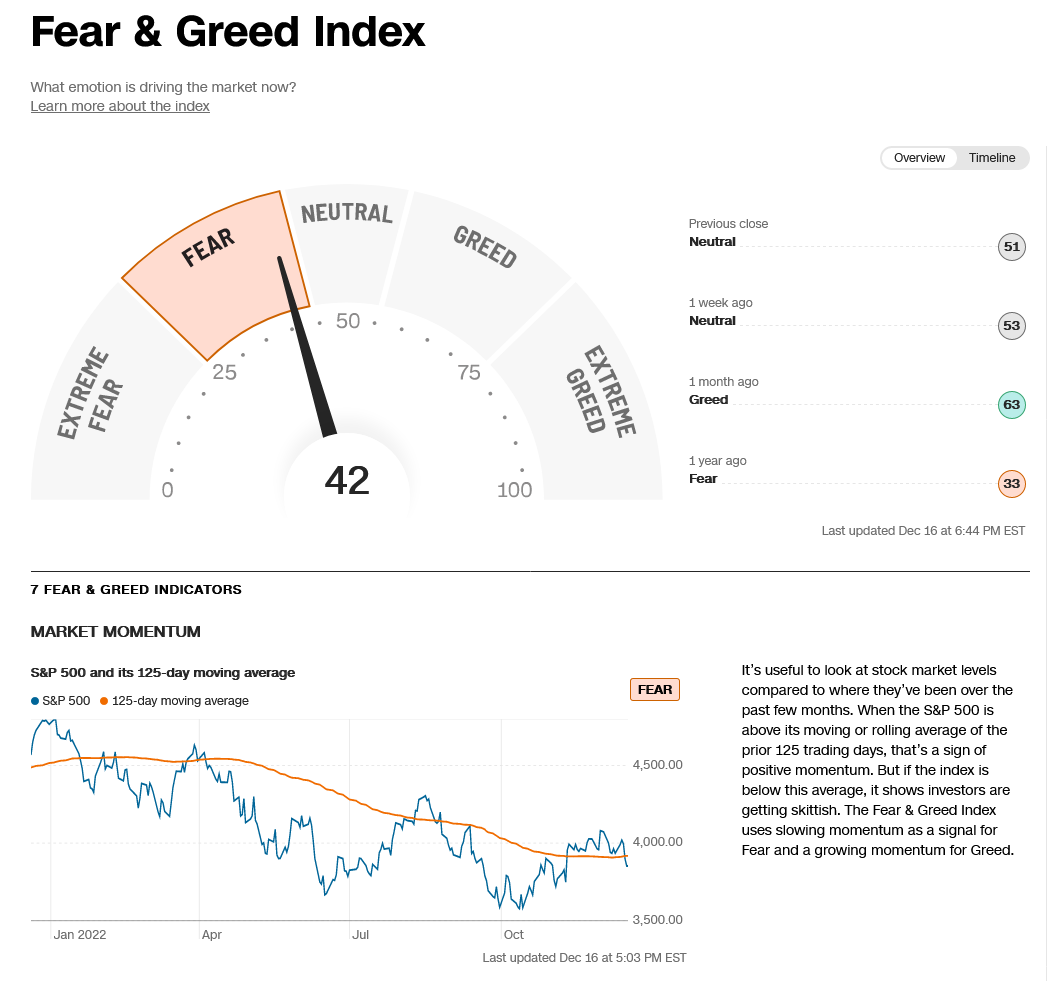
CNN Fear & Greed Index
Dow Jones Industrial Average Weekly HLC
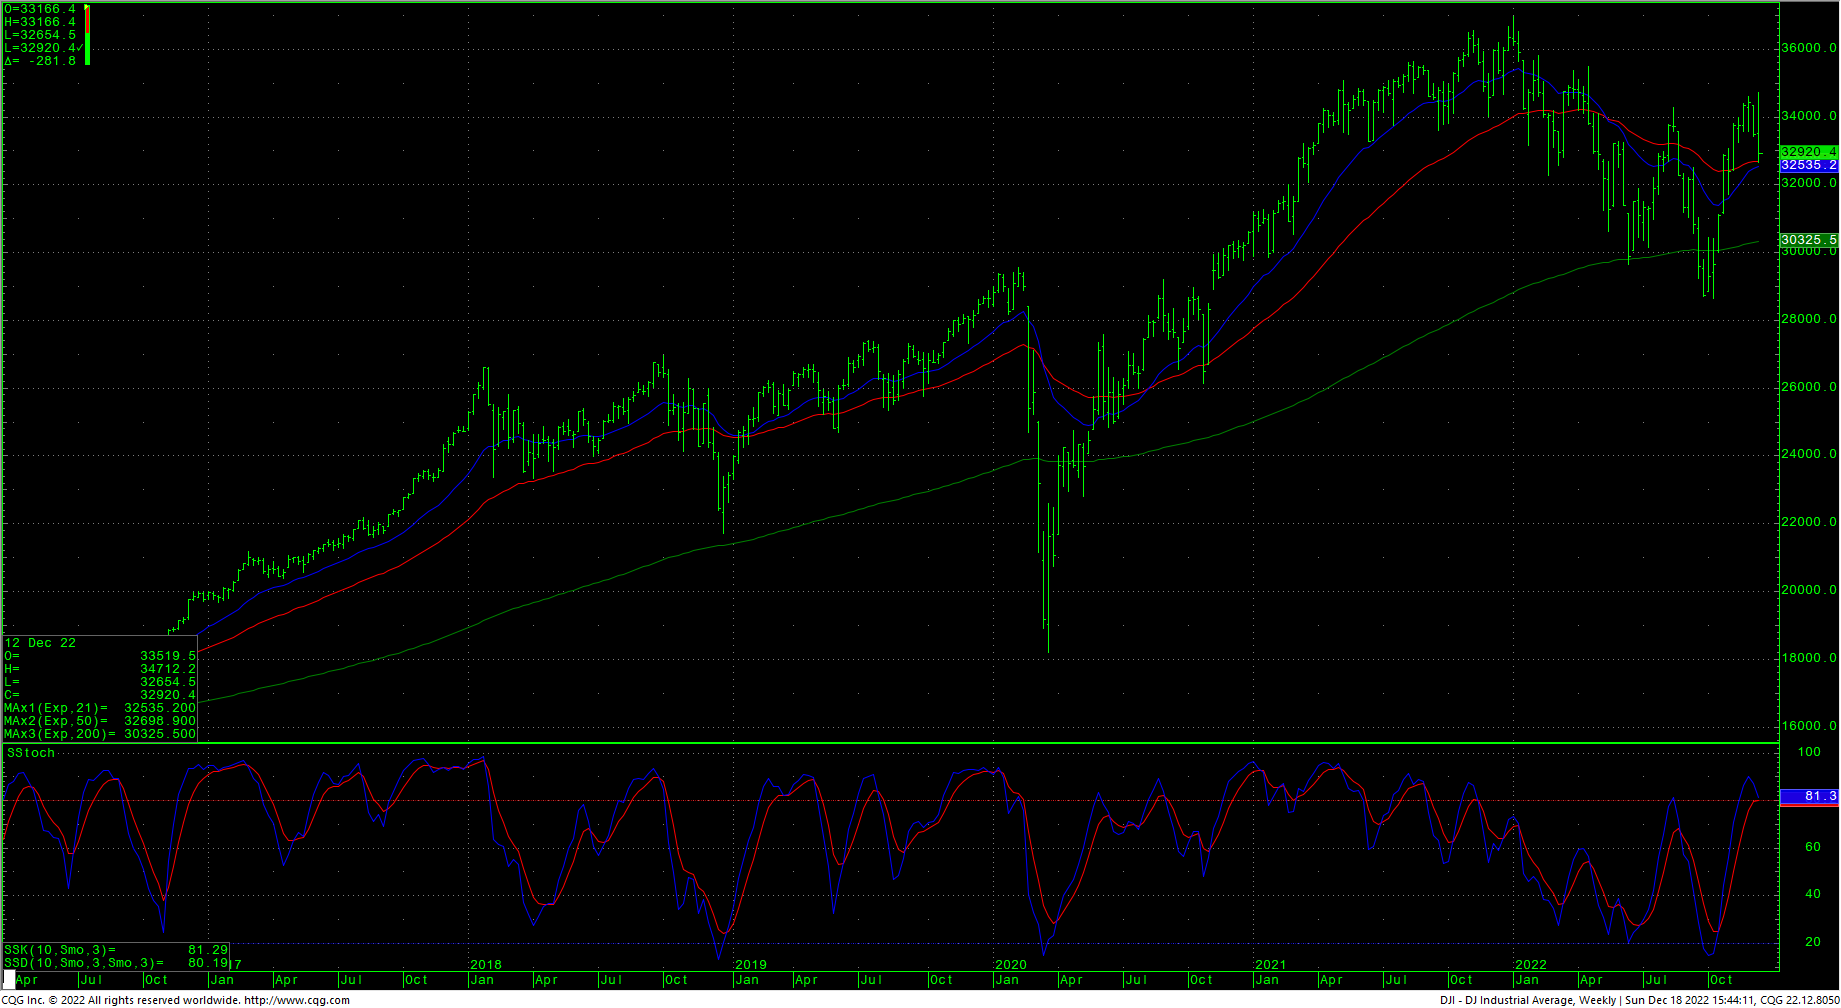
Resistance is 33000 and 33140/33188. A drive above 33188 should test 33290/33296 with potential to short-term pivotal resistance at 33440/33450. Closes back over 33450 are near-term friendly and suggest a drive to 33683 with resistance at 33608/33626. A close over 33683 sets up critical short-term resistance at 33926/33940. Closes over 33940 are bullish and set up a move to 34197/34226. Above 34226 will test 34400 with a shot at the recent highs at 34712.
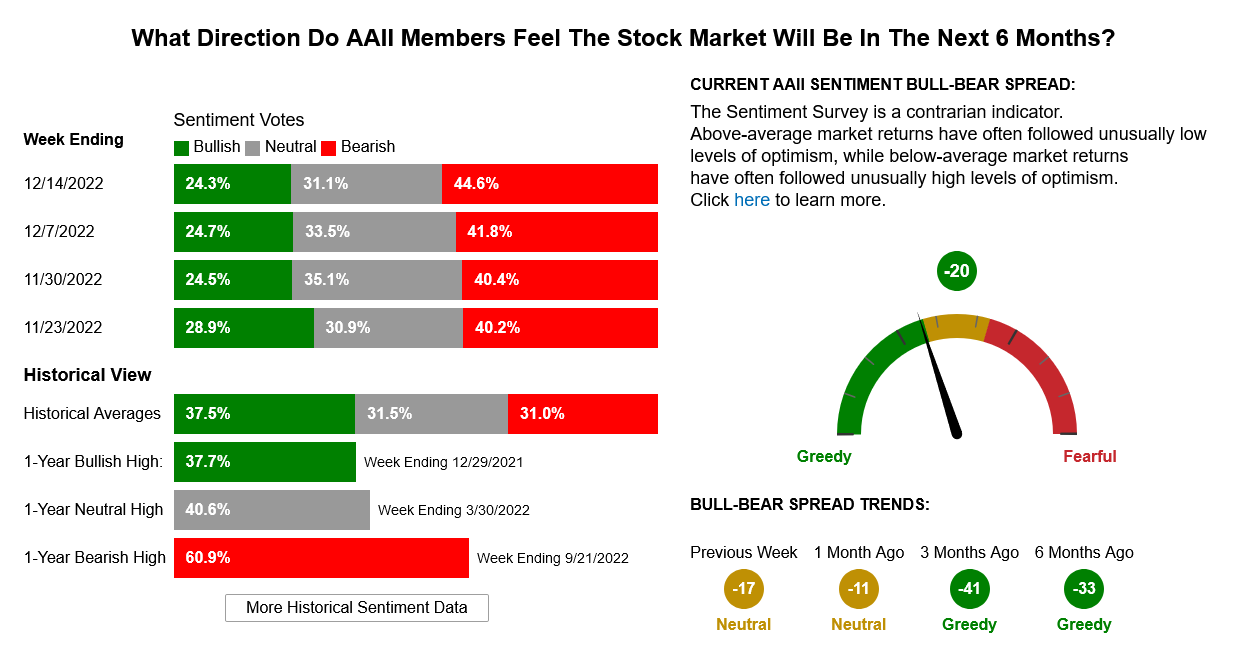
AAII Investor Sentiment Survey
Resistance
- 33000 **
- 33140/33188 *** ↑
- 33290/33296 *** ↑
- 33367 **
- 33440/33450 *** ↑
- 33683 *** ↑
- 33926/33940 *** ↑
- 34197/34226 *** ↑
- 34400 **
- 34700/34712 *** ↑
Support
- 32800 *** ↓
- 32654 **
- 32473/32400 *** ↓
- 32343 **
- 32324 *** ↓
- 32170 **
- 32099 ***
- 31727/31686 *** ↓
- 31423 ***

