Double Bottom chart pattern

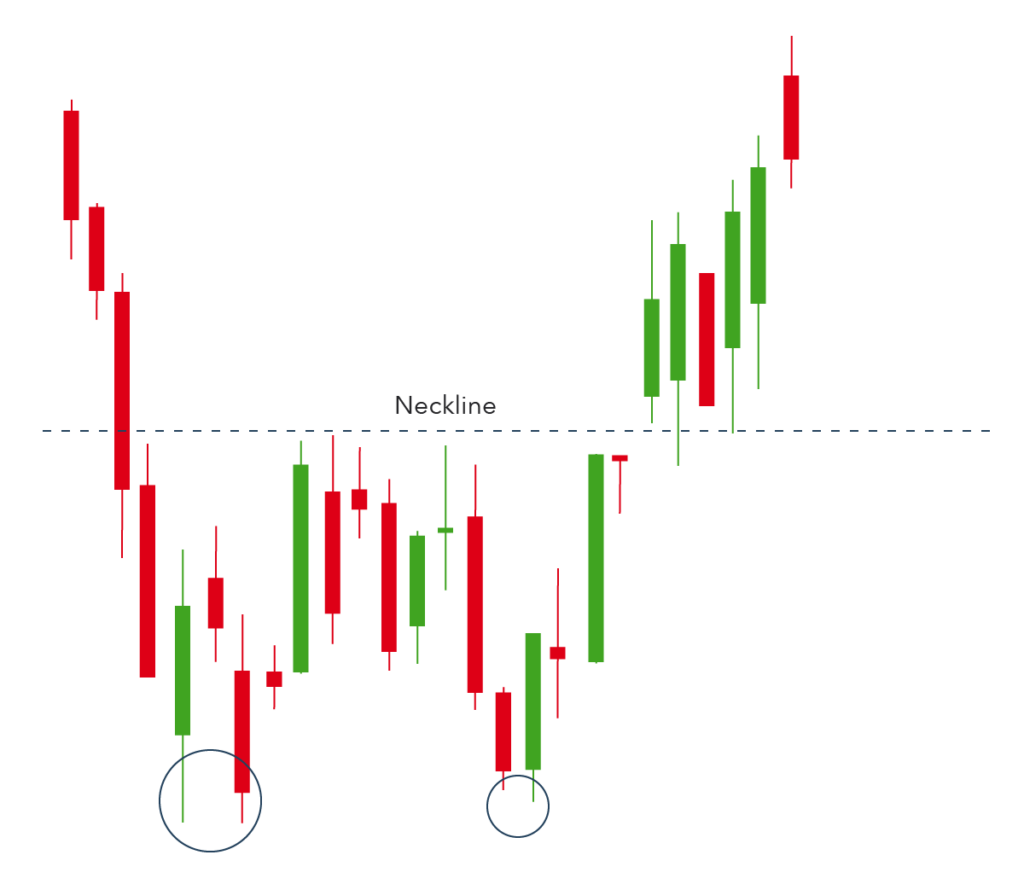
A double bottom pattern is a technical analysis charting formation showing a major change in trend from a prior down move. Its bullish reversal pattern, because it signifies the end of a downtrend and a shift towards an uptrend. The double bottom pattern looks like the letter “W.” The twice-touched low is considered a support level.


Journal

VMSI INDEX

Cyclicals Lead, Hedging Slows, VMSI Signals Institutional Confidence Growing

July 24, 2025 | VICA Research — Volatility & Market Sentiment Index |  VICA Partners’ VMSI© (Volatility & Market Sentiment ...
VMSI INDEX

Housing Market: Late-Cycle Strain, Repricing Likely by 2026

Sources: National Association of REALTORS®, BLS, VMSI The U.S. housing market is showing clear late-cycle characteristics. Prices remain elevated, yet ...
News

Mandate Clarity Is Monetary Power

By VICA Partners | July 2025(Peer-reviewed by institutional market strategists and asset managers) The Federal Reserve’s policy efficacy is increasingly ...